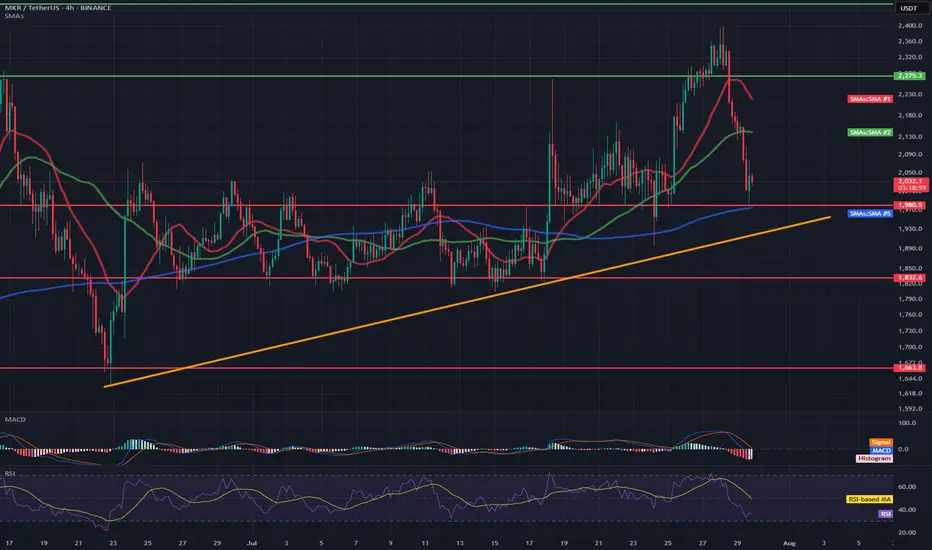
MKR/USDT 4H Chart📉 Short-term situation:
The price is currently trading around 2028 USDT, after a sharp decline from around 2273 USDT (resistance).
The support level around 2000 USDT is currently being tested (coinciding with the SMA 200 – blue line).
A dynamic uptrend line (orange) is also visible, which could act as a key support level in the event of further declines.
🔍 Support and Resistance Levels:
Resistance:
🔴 2188 USDT – recent local high and convergence with the SMA 21.
🟢 2273 USDT – major resistance; previous rebound and point of significant price reaction.
Support:
🔵 1980 USDT – local support + SMA200.
🟠 Uptrend line (~1940–1960 USDT).
🔴 1832 USDT – stronger horizontal support with multiple confirmations.
🔴 1623 USDT – very strong support, from previous lows.
📊 Technical indicators:
RSI (Relative Strength Index):
Current value: ~42, neutral, but approaching the oversold zone (<30).
The RSI is falling rapidly, suggesting selling pressure, but a reaction is possible near current support.
MACD:
Negative signal: signal line crossing from above + descending histogram.
Indicates a continuation of the correction, but we are approaching the potential exhaustion of the downward momentum.
📈 Moving averages:
EMA/SMA 50 and 200:
The price is currently testing the SMA200 – crucial for the medium-term trend.
SMA21 (red) and SMA50 (green) – have reversed downward, which may suggest a weakening of bullish momentum.
🔮 Scenarios:
🟢 Bullish scenario (confirmation of support):
A rebound from 1980–2000 USDT and further upward movement.
Potential target: first ~2180 USDT, then ~2273 USDT.
The condition is a demand response at the current level + an improvement in the RSI/MACD.
🔴 Bearish scenario (breakout of support):
If the 1980 USDT level is broken and the price falls below the uptrend line, a continued decline to 1832 USDT or even lower is possible.
Confirmation will be a strong bearish candle with high volume and a further decline in the RSI/MACD.
MKRUSDT
MKR ANALYSIS🔮 #MKR Analysis
🌟🚀 As we said earlier #MKR moved around 48%. Right now #MKR is trading in an Ascending Triangle Pattern and here we can see that #MKR moving again towards its neckline. We see see more bullish move in upcoming days
🔖 Current Price: $2260
⏳ Target Price: $2664
⁉️ What to do?
- We have marked crucial levels in the chart . We can trade according to the chart and make some profits. 🚀
#MKR #Cryptocurrency #Breakout #DYOR

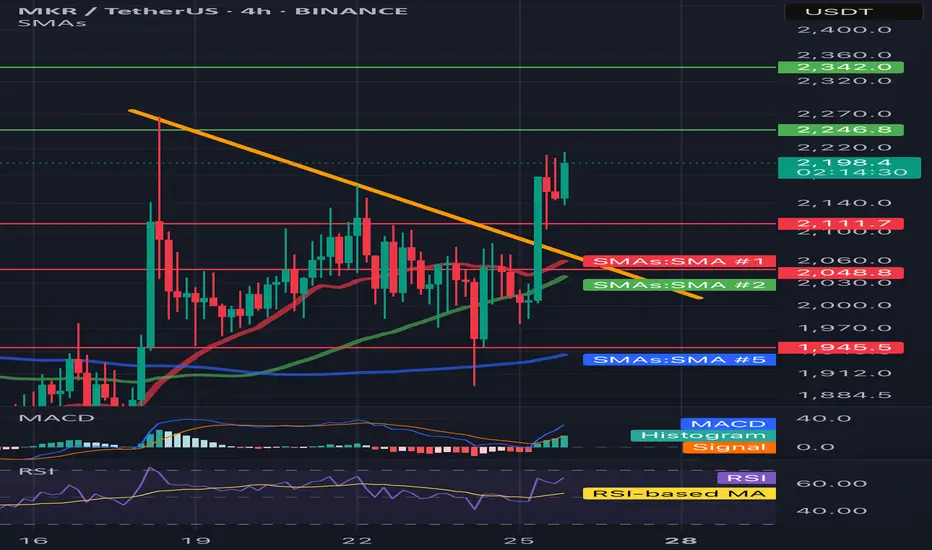
MKR/USDT 4H📈 Trend and price structure
• The price has just been above the downward trend line (yellow line), which suggests the potential reversal of the trend to the upward.
• Breaking was strong - a candle with a large growth volume and an increase +9.13%, which emphasizes the pressure of buyers.
⸻
🔍 levels of support and resistance
• resistance:
• ~ 2342 USDT - a clear level of resistance (green line) - may be the target for the next upward movement.
• 2246.8 USDT - first resistance to overcome.
• Support:
• 2111.7 USDT - level of local support after struggling (earlier resistance).
• 2048.8 USDT - SMA #1 (red medium), can be support at the back.
• 1945.5 USDT - strong support in the form of long -term SMA (blue line, SMA #5).
⸻
📊 Technical indicators
✅ MacD (below)
• The MacD line cut the signal line up - buy signal.
• The histogram is growing, which confirms the growth moment.
✅ RSI
• RSI has bounced from level 40 and is currently above 60 - it suggests upward momentum, but it is not yet purchased, so there may be room for further growth.
⸻
✅ Medium walking (SMAS)
• The price was pierced by SMA #1 (red) and SMA #2 (green) with impetus, which means a change in sentiment.
• If it stays above these medium - a bull signal.
• SMA 50 (green)> SMA 200 (blue) = potentially a golden cross is formed on a longer TF.
⸻
📌 Summary - technical scenario:
🐂 Bycza scenario:
• If the price lasts above 2111.7 USDT, it may continue to increase to USDTt and further up to $ 2,342.
• Confirmation will be the continuation of growth on MacD and RSI over 60-70.
🐻 Bear scenario (threats):
• If the price drops below 2048 USDT, possible correction up to 1945 USDT.
• RSI returning below 50 and Macd Cross down would be a reversal signal.
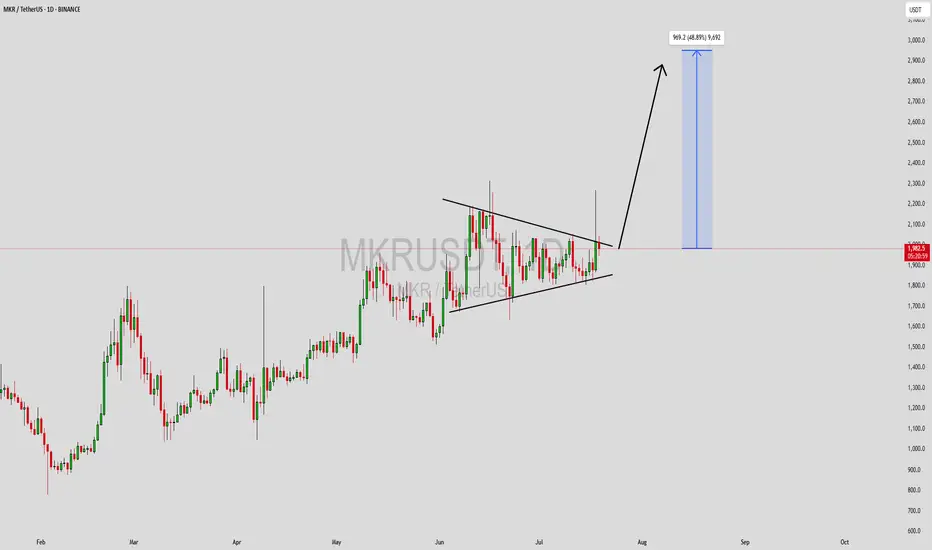
MKRUSDT Forming Symmetrical TriangleMKRUSDT has formed a textbook symmetrical triangle pattern on the daily chart, a classic consolidation structure that often precedes a strong breakout. The price is currently pressing against the upper resistance line, and a breakout above this range could trigger a bullish continuation toward the $2,900 level, suggesting a potential gain of 30% to 40%+. The rising volume on the recent candles confirms that traders are positioning themselves ahead of a possible move, making this setup highly watchable for swing traders.
Maker (MKR), being a major governance token in the DeFi ecosystem, continues to attract interest due to its role in the MakerDAO protocol and its connection to the DAI stablecoin. As DeFi fundamentals remain strong and institutional capital slowly returns to decentralized finance platforms, MKR is likely to benefit from renewed attention. This breakout could be a reflection of that growing confidence.
The bullish sentiment is further supported by strong fundamentals and technical indicators aligning in favor of upside momentum. With crypto market sentiment gradually improving and altcoins showing signs of strength, MKR could outperform many peers in the coming weeks. Watch for confirmation above the triangle resistance and monitor volume spikes to validate a strong entry.
✅ Show your support by hitting the like button and
✅ Leaving a comment below! (What is You opinion about this Coin)
Your feedback and engagement keep me inspired to share more insightful market analysis with you!
MKR/USDT 4H Chart🔍 1. Technical Pattern:
The chart shows a descending wedge (orange lines) that has broken out upward.
The breakout occurred on increasing volume (a signal of bullish strength).
The price is currently trading above a resistance line, which is now acting as support (~1980 USDT).
📊 2. Support and Resistance Levels:
Support (red lines):
1903 USDT – local consolidation support.
1801 USDT – strong support at the previous bottom.
1727 and 1632 USDT – fallback zones in case of strong declines.
Resistance (green and blue lines):
2120 USDT – first target after the breakout.
2168 USDT – another strong resistance from the previous consolidation.
2312 USDT – high resistance, potential target if the uptrend continues.
📈 3. Indicators:
🔹 Stochastic RSI:
Close to the overbought zone, but not yet giving a sell signal.
A short consolidation or correction may occur in the coming hours.
🔹 MACD:
The MACD line is above the signal and the histogram is still rising – a buy signal.
No signs of weakening momentum.
🔹 RSI:
The RSI is rising, but not yet in the overbought zone (>70).
Shows the strength of the trend, but there is room for further upward movement.
🧠 Summary and scenarios:
✅ Bullish scenario:
If the price remains above 1980 USDT, the next targets are:
2120 USDT
2168 USDT
Potentially 2312 USDT with continued demand
⚠️ Bearish scenario (less likely at this time):
If the price returns below 1980 USDT and does not regain this level:
Possible return to 1903 or lower (1801 USDT).

#MKR/USDT#MKR
The price is moving within a descending channel on the 1-hour frame, adhering well to it, and is heading toward a strong breakout and retest.
We are experiencing a rebound from the lower boundary of the descending channel. This support is at 2008.
We are experiencing a downtrend on the RSI indicator, which is about to break and retest, supporting the upward trend.
We are heading toward stability above the 100 moving average.
Entry price: 2333
First target: 2201
Second target: 2097
Third target: 2333

#MKR/USDT Ready to launch upwards#MKR
The price is moving in a descending channel on the 1-hour frame and is adhering to it well and is heading to break it strongly upwards
We have a bounce from the lower limit of the descending channel, this support is at a price of 1200
We have a downtrend on the RSI indicator that is about to be broken, which supports the rise
We have a trend to stabilize above the moving average 100
Entry price 1243
First target 1270
Second target 1311
Third target 1356

Maker (MKR)MKR usdt Daily analysis
Time frame 4hours
Risk rewards ratio =2 👈👌
Target 2400$
Now is a good opportunity to break the 1930$ resistance and reach to the next resistance area in 2400$
But if mkr can't break this resistance, will fall down to 1600$

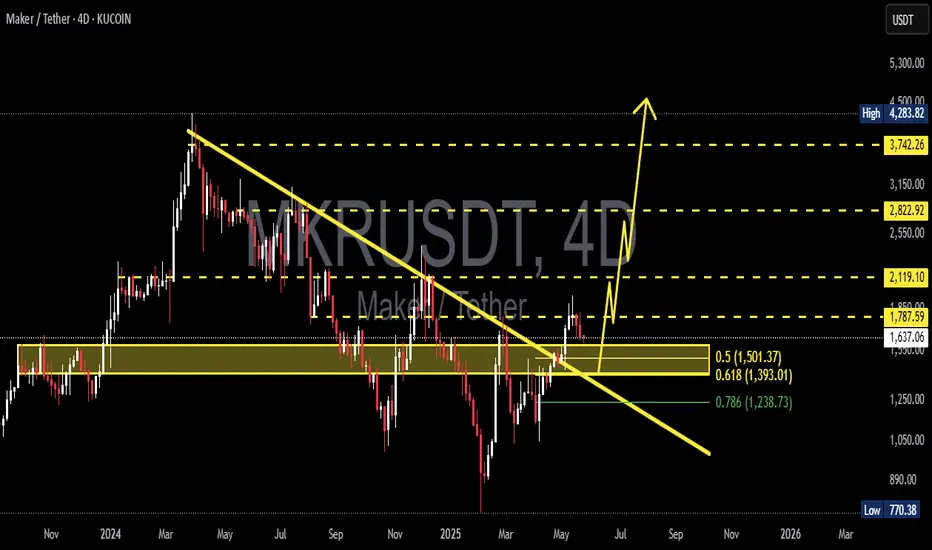
MKR 1W🔍1. Overall Trend:
In the long term, we can see that MKR was in a downtrend, as evidenced by the falling trendline (orange dashed line).
The last candles show that the price has broken this downtrend line - this could indicate a potential trend reversal or at least an attempted upside correction.
📊Support and resistance levels (horizontal chart):
Strong support (red) and resistance (green) levels are marked:
✅ Resistances:
~3,770 USDT – local top, very strong resistance.
~3,079 USDT – previous support, now acting as resistance.
~2,002 USDT – current growth barrier, price is currently struggling with this level.
🔻 Supports:
~1,574 USDT – current local support.
~1,248 USDT – next support, previously tested.
~800 USDT and ~400 USDT – historical accumulation zones, deep support levels.
Oscillators (bottom of the chart):
Stochastic RSI – currently in the upper zone, which may suggest that the market is approaching overbought. Possible correction.
RSI (classic) – oscillates around 50, i.e. neutral, but with a slight upward slope. There is no overbought signal yet.
🧠 Conclusions:
➕ Bullish signals (pro-growth):
Break of the downtrend line (may be the first signal of a trend change).
Formation of a higher low.
Oscillators are not yet in the extreme zone.
➖ Bearish signals (pro-fall):
The price has not yet managed to break the resistance at 2,002 USDT.
Stochastic RSI indicator close to the overbought zone - possible short correction.
📌 Scenarios:
1. Upside scenario:
If the price breaks through the 2,002 USDT level and stays above it, the next target will be the 3,079 USDT level.
Confirmation will be the rising RSI and staying above the trend line.
2. Downside scenario:
If the price fails to break through the 2,002 USDT level and falls below the 1,574 USDT level, a possible test of the 1,248 USDT level or even lower (800 USDT).

MKRUSDT 1D AnalysisMKR ~ 1D Analysis
#MKR Buy on retest of this support block with short term target of at least 10%++ from here.
MKR/USDT 4h chart ReviewHello everyone, let's look at the 4H MKR chart to USDT, in this situation we can see how the price moves on the created upward trend line. Going further, let's check the places of potential target for the price:
T1 = $ 1576
T2 = 1657 $
Т3 = 1714 $
Let's go to Stop-Loss now in case of further declines on the market:
SL1 = $ 1529
SL2 = $ 1499
SL3 = $ 1450
SL4 = 1372 $
Looking at the RSI indicator, we see
How slight relaxations give space for further increases by living in the upward trend of price.

ALTCOINS | ALTSeason | Buy Zones PART 3⚜TRX
TRX has been really strong over the past few days, continuously making higher lows which is early signs of a bullish sentiment. Though, I would want to see the price hold the highlighted support zones before making any decisions. A close UNDER would likely lead to a lower drop.
In that case, I'd be willing to buy at 0,22:
⚜GRT
GRT I'd be looking to buy very low, between the two following prices:
⚜RNDR
Render has bounced from the first buy-zone, but it seems likely we'll retest again soon since the bounce did not equate to a reversal:
⚜MAKER
Optimistic longer term on this coin. Strong decline, lower buy likely here:
⚜AAVE
Strong short-term bearish sentiment, weighted heavier towards the lower zone:
Make sure you don't miss part 1 and part 2 !!

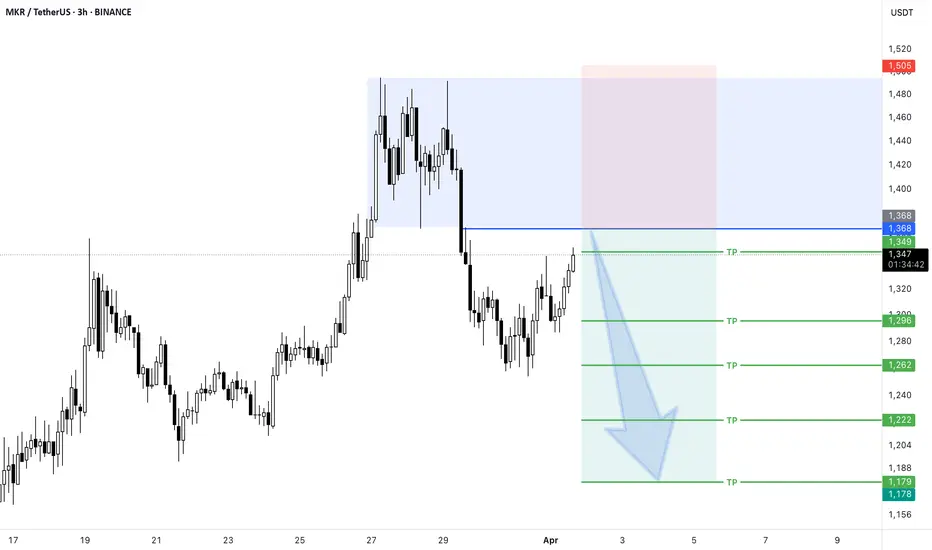
Short Position MKR/USDT#Singal
MKR/USDT
🔴 Short Position
🎲 Entry @ 1,368
✅ Target1@ 1,349
✅ Target2 @ 1,296
✅ Target3 @ 1,262
✅ Target4 @ 1,222
✅ Target5 @ 1,179
❌ Stop Loss @ 1,505
Leverage: 5X_15X
Margin: 10% of Wallet Balance
⚠️"Take Care of Risk Management for Your Account"
MKR Looks Bearish (1D)The correction of MKR seems to have started from the point marked START on the chart.
This correction appears to be a diametric pattern, and we are now in the late stages of wave F, which has been a bullish wave.
It is expected that from the red zone, wave G a bearish wave will begin.
The closure of a daily candle above the invalidation level will invalidate this analysis.
For risk management, please don't forget stop loss and capital management
Comment if you have any questions
Thank You

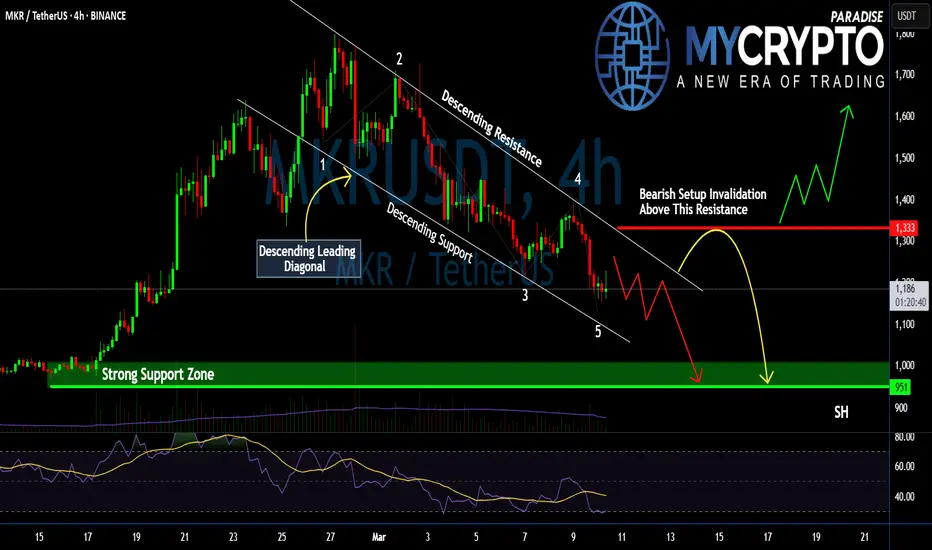
#MKR Bears in Control: Is a Breakdown Inevitable or Not?Yello, Paradisers! Is #MKR setting up for another leg down, or will the Bulls finally step in? The structure is clear; this could get ugly unless something changes soon. Let’s break down the #Maker setup:
💎#MKRUSDT is forming a Descending Leading Diagonal, a classic bearish pattern within a larger zigzag correction. This structure suggests that sellers remain in control, with each bounce being met by renewed selling pressure.
💎Price is currently reacting off the descending support near $1,160. While a short-term bounce toward $1,250 - $1,300 is possible, it remains within the bearish framework. The critical resistance to watch is at $1,333—a breakout above this level would invalidate the bearish setup and signal a shift in momentum.
💎If the bearish structure holds, the next leg down could take us to the strong support zone at $1,000 - $950. This is where buyers will have their last real chance to defend the trend. A failure to hold this level could open the door to a deeper correction.
💎RSI remains weak, showing no strong bullish divergence, signaling that momentum is still in favor of the sellers. The volume is declining, meaning the recent price action lacks strong buying conviction.
Strive for consistency, not quick profits. The market rewards discipline and patience—trade smart, Paradisers!
MyCryptoParadise
iFeel the success 🌴
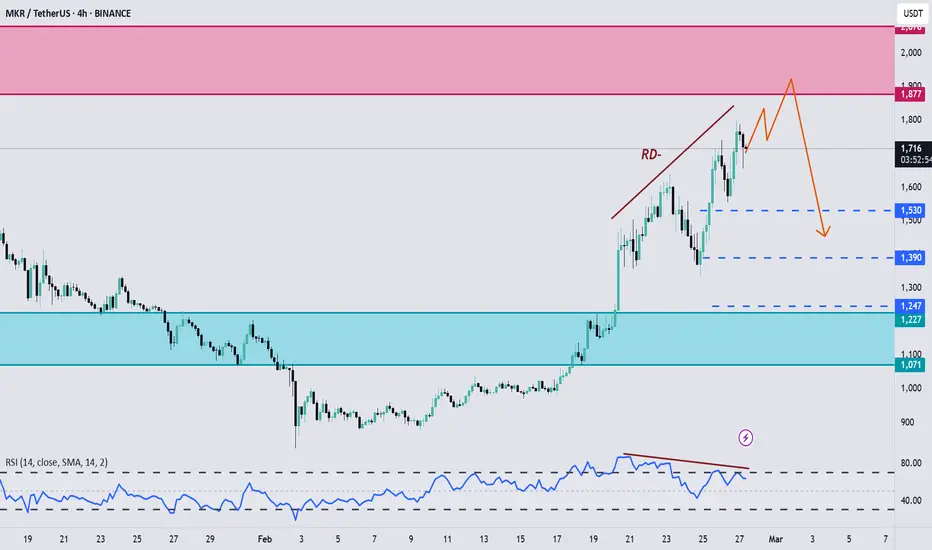
MKR, Ready for a short opportunity !!!Hello Traders, Hope you are doing great.
After a good upward movement that happened in last weeks, now it seems that bulls are going to lose their control and we'll probably see a downward correction after the price reaches to the specified supply zone, we also have regular divergences on 4H and Daily timeframes.
So for upcoming days I expect a slowly upward movement at first and after that Bears step in and cause a downward correction happen. Targets have determined by Blue dashed lines.
And finally Tell me What are your thoughts about MKR ? UP or DOWN ? comment your opinion below this post.
UniversOfSignals | MKRUSDT 70% Move?Let's analyze and review one of the best coins in the DAo area together and find another entry point together and update our previous triggers
🌐 Overview Bitcoin
Before starting today's altcoin analysis, let's look at Bitcoin on the 1-hour timeframe. Since yesterday, Bitcoin experienced a correction, which was necessary for the market, and it pulled back to the 102135 range. The next trigger for a long position will be a breakout above 104714.
Yesterday's correction, coupled with an increase in Bitcoin dominance, caused noticeable declines in some altcoins. This highlights the importance of monitoring BTC pairs in your checklist these days.
MakerDAO’s sharp increase in fees and growth in Total Value Locked (TVL) has fueled demand. On February 20, $156.77 million of MKR was burned, reducing supply. Growth in active addresses and trading volume has driven the price higher. Strong resistance at $1,800 may limit further growth. MakerDAO’s emergency offering has raised concerns about $3.1 billion USDC exposure.
📊 Weekly Timeframe
In the weekly timeframe, the token has seen a 95% gain on the coin, which is a good sign in these market conditions!
Also, in this timeframe, we are in an opening triangle, which is characterized by high volatility, and we are constantly moving towards the bottom and top of this triangle, regardless of the ceiling and floor or support and resistance, and the exit from this triangle will also be sharp.
In this timeframe, we did not have a trigger in advance to say that we could buy or anything else, and it moved very sharply. If you lose, it is normal and do not blame yourself and your strategy.
After exiting this triangle and breaking 2.182, we can have a good trigger to buy, and for now, if you bought and held during this fluctuation and are in profit above 50%, it is logical to save profit, but if you did FOMO and bought, it is better not to continue trading and be busy watching the tutorial for now.
📝 Final Thoughts
Stay calm, trade wisely, and let's capture the market's best opportunities!
This analysis reflects our opinions and is not financial advice.
Share your thoughts in the comments, and don’t forget to share this analysis with your friends!

TradeCityPro | MKRUSDT 70% Move?👋 Welcome to TradeCityPro Channel!
Let's analyze and review one of the best coins in the DAo area together and find another entry point together and update our previous triggers
🌐 Overview Bitcoin
Before starting today's altcoin analysis, let's look at Bitcoin on the 1-hour timeframe. Since yesterday, Bitcoin experienced a correction, which was necessary for the market, and it pulled back to the 102135 range. The next trigger for a long position will be a breakout above 104714.
Yesterday's correction, coupled with an increase in Bitcoin dominance, caused noticeable declines in some altcoins. This highlights the importance of monitoring BTC pairs in your checklist these days.
MakerDAO’s sharp increase in fees and growth in Total Value Locked (TVL) has fueled demand. On February 20, $156.77 million of MKR was burned, reducing supply. Growth in active addresses and trading volume has driven the price higher. Strong resistance at $1,800 may limit further growth. MakerDAO’s emergency offering has raised concerns about $3.1 billion USDC exposure.
📊 Weekly Timeframe
In the weekly timeframe, the token has seen a 95% gain on the coin, which is a good sign in these market conditions!
Also, in this timeframe, we are in an opening triangle, which is characterized by high volatility, and we are constantly moving towards the bottom and top of this triangle, regardless of the ceiling and floor or support and resistance, and the exit from this triangle will also be sharp.
In this timeframe, we did not have a trigger in advance to say that we could buy or anything else, and it moved very sharply. If you lose, it is normal and do not blame yourself and your strategy.
After exiting this triangle and breaking 2.182, we can have a good trigger to buy, and for now, if you bought and held during this fluctuation and are in profit above 50%, it is logical to save profit, but if you did FOMO and bought, it is better not to continue trading and be busy watching the tutorial for now.
📝 Final Thoughts
Stay calm, trade wisely, and let's capture the market's best opportunities!
This analysis reflects our opinions and is not financial advice.
Share your thoughts in the comments, and don’t forget to share this analysis with your friends!

MKR/USDT: Accelerated Golden Cross & Strong Uptrend ConfirmationMKR is showing clear bullish momentum, forming higher lows and seeing increasing trading volume, both signs of a sustained uptrend. The price has reclaimed key moving averages and is now testing the 200 SMA ($1,517)—a critical level that, once broken, could trigger a strong upward move. Initially, the golden cross (50 SMA crossing above 200 SMA) was expected within 2-4 weeks, but given BTC’s renewed strength and rising market liquidity, this formation could now happen much sooner—potentially within 7-14 days if the current momentum continues.
With BTC stabilizing and likely resuming its uptrend toward $95K-$100K+, liquidity is expected to flow into strong altcoins like MKR. If MKR breaks and holds above $1,517, initial targets of $1,8 and $2,1 could be reached quickly. However, with higher volume and strong technical confirmation, a move toward $2,4 - $2,8 is highly probable. If momentum accelerates further, $3,0+ could be a mid-term target, supported by both technical and macro market conditions.
For traders, a confirmed breakout above $1,517 with strong volume would signal a breakout opportunity, while investors looking for accumulation zones might watch for pullbacks to $1,493 (100 SMA) or $1,223 (50 SMA) as potential re-entry points. With increasing volume, higher lows, and a likely golden cross arriving earlier than expected, MKR is positioned for a significant rally in the coming weeks.

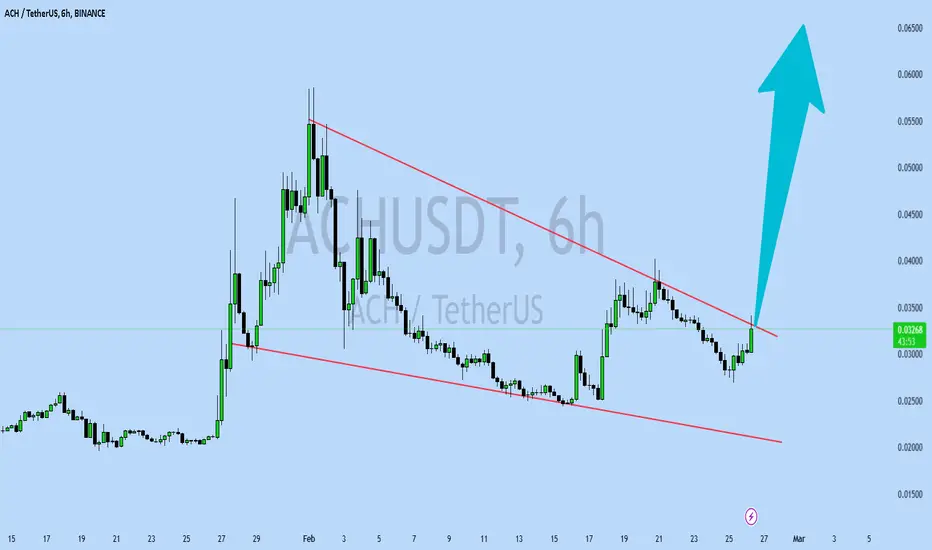
ACHUSDT UPDATEACHUSDT is a cryptocurrency trading at $0.03285. Its target price is $0.06500, indicating a potential 90%+ gain. The pattern is a Bullish Falling Wedge, a reversal pattern signaling a trend change. This pattern suggests the downward trend may be ending. A breakout from the wedge could lead to a strong upward move. The Bullish Falling Wedge is a positive signal, indicating a potential price surge. Investors are optimistic about ACHUSDT's future performance. The current price may be a buying opportunity. Reaching the target price would result in significant returns. ACHUSDT is poised for a potential breakout and substantial gains.

MKR ANALYSIS📊 #MKR Analysis : Update
✅There was a formation of Falling Wedge Pattern on daily chart with a huge breakout 🧐
We could expect more bullish move if #MKR breaks the major resistance zone.
👀Current Price: $1.537
🚀 Target Price: $2.060
⚡️What to do ?
👀Keep an eye on #MKR price action and volume. We can trade according to the chart and make some profits⚡️⚡️
#MKR #Cryptocurrency #TechnicalAnalysis #DYOR

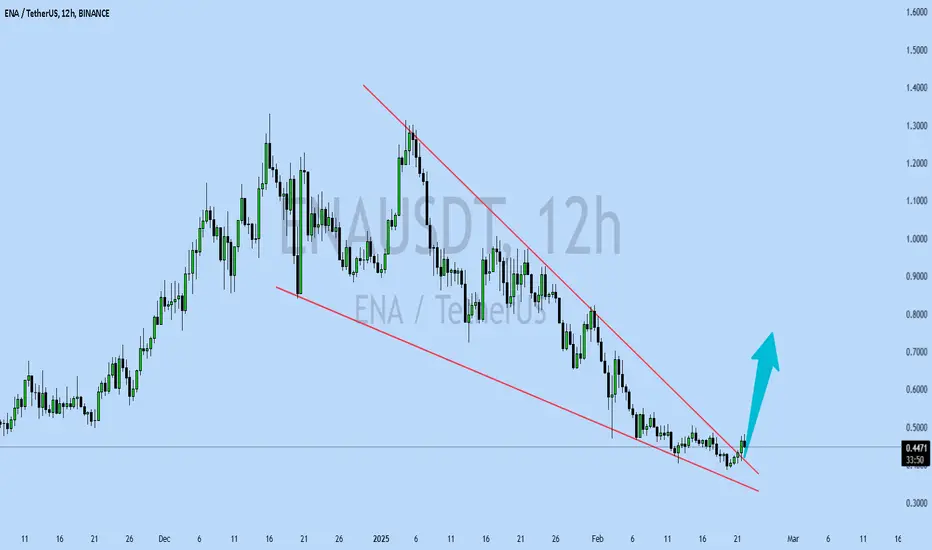
ENAUSDT UPDATEENAUSDT is a cryptocurrency trading at $0.4483. Its target price is $0.7500, indicating a potential 70%+ gain. The pattern is a Bullish Falling Wedge, a reversal pattern signaling a trend change. This pattern suggests the downward trend may be ending. A breakout from the wedge could lead to a strong upward move. The Bullish Falling Wedge is a positive signal, indicating a potential price surge. Investors are optimistic about ENAUSDT's future performance. The current price may be a buying opportunity. Reaching the target price would result in significant returns. ENAUSDT is poised for a potential breakout and substantial gains.