Journey to 53K: Final Attempt at MNQ EntryForex, Crypto and Futures Trading Risk Disclosure:
The National Futures Association (NFA) and Commodity Futures Trading Commission (CFTC), the regulatory agencies for the forex and futures markets in the United States, require that customers be informed about potential risks in trading these markets. If you do not fully understand the risks, please seek advice from an independent financial advisor before engaging in trading.
Trading forex and futures on margin carries a high level of risk and may not be suitable for all investors. The high degree of leverage can work against you as well as for you. Before deciding to trade, you should carefully consider your investment objectives, level of experience, and risk appetite.
There is a possibility of losing some or all of your initial investment, and therefore, you should not invest money that you cannot afford to lose. Be aware of the risks associated with leveraged trading and seek professional advice if necessary.
BDRipTrades Market Opinions (also applies to BDelCiel and Aligned & Wealthy LLC):
Any opinions, news, research, analysis, prices, or other information contained in my content (including live streams, videos, and posts) are provided as general market commentary only and do not constitute investment advice. BDRipTrades, BDelCiel, and Aligned & Wealthy LLC will not accept liability for any loss or damage, including but not limited to, any loss of profit, which may arise directly or indirectly from the use of or reliance on such information.
Accuracy of Information: The content I provide is subject to change at any time without notice and is intended solely for educational and informational purposes. While I strive for accuracy, I do not guarantee the completeness or reliability of any information. I am not responsible for any losses incurred due to reliance on any information shared through my platforms.
Government-Required Risk Disclaimer and Disclosure Statement:
CFTC RULE 4.41 - HYPOTHETICAL OR SIMULATED PERFORMANCE RESULTS HAVE CERTAIN LIMITATIONS. UNLIKE AN ACTUAL PERFORMANCE RECORD, SIMULATED RESULTS DO NOT REPRESENT ACTUAL TRADING. ALSO, SINCE THE TRADES HAVE NOT BEEN EXECUTED, THE RESULTS MAY HAVE UNDER-OR-OVER COMPENSATED FOR THE IMPACT, IF ANY, OF CERTAIN MARKET FACTORS, SUCH AS LACK OF LIQUIDITY. SIMULATED TRADING PROGRAMS IN GENERAL ARE ALSO SUBJECT TO THE FACT THAT THEY ARE DESIGNED WITH THE BENEFIT OF HINDSIGHT. NO REPRESENTATION IS BEING MADE THAT ANY ACCOUNT WILL OR IS LIKELY TO ACHIEVE PROFIT OR LOSSES SIMILAR TO THOSE SHOWN.
Performance results discussed in my content are hypothetical and subject to limitations. There are frequently sharp differences between hypothetical performance results and the actual results subsequently achieved by any particular trading strategy. One of the limitations of hypothetical trading results is that they do not account for real-world financial risk.
Furthermore, past performance of any trading system or strategy does not guarantee future results.
General Trading Disclaimer:
Trading in futures, forex, and other leveraged products involves substantial risk and is not appropriate for all investors.
Do not trade with money you cannot afford to lose.
I do not provide buy/sell signals, financial advice, or investment recommendations.
Any decisions you make based on my content are solely your responsibility.
By engaging with my content, including live streams, videos, educational materials, and any communication through my platforms, you acknowledge and accept that all trading decisions you make are at your own risk. BDRipTrades, BDelCiel, and Aligned & Wealthy LLC cannot and will not be held responsible for any trading losses you may incur.
Mnq

Journey to 53K: Mark up MNQ with me! 2.18.25Forex, Crypto and Futures Trading Risk Disclosure:
The National Futures Association (NFA) and Commodity Futures Trading Commission (CFTC), the regulatory agencies for the forex and futures markets in the United States, require that customers be informed about potential risks in trading these markets. If you do not fully understand the risks, please seek advice from an independent financial advisor before engaging in trading.
Trading forex and futures on margin carries a high level of risk and may not be suitable for all investors. The high degree of leverage can work against you as well as for you. Before deciding to trade, you should carefully consider your investment objectives, level of experience, and risk appetite.
There is a possibility of losing some or all of your initial investment, and therefore, you should not invest money that you cannot afford to lose. Be aware of the risks associated with leveraged trading and seek professional advice if necessary.
BDRipTrades Market Opinions (also applies to BDelCiel and Aligned & Wealthy LLC):
Any opinions, news, research, analysis, prices, or other information contained in my content (including live streams, videos, and posts) are provided as general market commentary only and do not constitute investment advice. BDRipTrades, BDelCiel, and Aligned & Wealthy LLC will not accept liability for any loss or damage, including but not limited to, any loss of profit, which may arise directly or indirectly from the use of or reliance on such information.
Accuracy of Information: The content I provide is subject to change at any time without notice and is intended solely for educational and informational purposes. While I strive for accuracy, I do not guarantee the completeness or reliability of any information. I am not responsible for any losses incurred due to reliance on any information shared through my platforms.
Government-Required Risk Disclaimer and Disclosure Statement:
CFTC RULE 4.41 - HYPOTHETICAL OR SIMULATED PERFORMANCE RESULTS HAVE CERTAIN LIMITATIONS. UNLIKE AN ACTUAL PERFORMANCE RECORD, SIMULATED RESULTS DO NOT REPRESENT ACTUAL TRADING. ALSO, SINCE THE TRADES HAVE NOT BEEN EXECUTED, THE RESULTS MAY HAVE UNDER-OR-OVER COMPENSATED FOR THE IMPACT, IF ANY, OF CERTAIN MARKET FACTORS, SUCH AS LACK OF LIQUIDITY. SIMULATED TRADING PROGRAMS IN GENERAL ARE ALSO SUBJECT TO THE FACT THAT THEY ARE DESIGNED WITH THE BENEFIT OF HINDSIGHT. NO REPRESENTATION IS BEING MADE THAT ANY ACCOUNT WILL OR IS LIKELY TO ACHIEVE PROFIT OR LOSSES SIMILAR TO THOSE SHOWN.
Performance results discussed in my content are hypothetical and subject to limitations. There are frequently sharp differences between hypothetical performance results and the actual results subsequently achieved by any particular trading strategy. One of the limitations of hypothetical trading results is that they do not account for real-world financial risk.
Furthermore, past performance of any trading system or strategy does not guarantee future results.
General Trading Disclaimer:
Trading in futures, forex, and other leveraged products involves substantial risk and is not appropriate for all investors.
Do not trade with money you cannot afford to lose.
I do not provide buy/sell signals, financial advice, or investment recommendations.
Any decisions you make based on my content are solely your responsibility.
By engaging with my content, including live streams, videos, educational materials, and any communication through my platforms, you acknowledge and accept that all trading decisions you make are at your own risk. BDRipTrades, BDelCiel, and Aligned & Wealthy LLC cannot and will not be held responsible for any trading losses you may incur.

MNQ!/NQ1! Day Trade Plan for 02/17/25MNQ!/NQ1! Day Trade Plan for 02/17/25
📈22320-22350
📉22190-22130
Like and share for more daily MNQ/NQ levels 🤓📈📉🎯💰
*These levels are derived from comprehensive backtesting and research, demonstrating over 90% accuracy. This statistical foundation suggests that price movements are likely to exceed initial estimates.*

Live execution and insights to my MNQ POI The Bias we had was perfect, and it panned out just right. We were a little late to the party, I had just walked into my room after taking my dog outside. As soon as I saw it at my zone I felt the urge to enter so I did.
I recommend you guys check out the previous video I posted of my MNQ POI
Over 120 points SL which I am not a fan of but on MNQ that is about $65 risk. We took our profits early for precaution and to keep our greed in check.
Give a like and thumbs up if you enjoyed the video and my personal insights!
Forex, Crypto and Futures Trading Risk Disclosure:
The National Futures Association (NFA) and Commodity Futures Trading Commission (CFTC), the regulatory agencies for the forex and futures markets in the United States, require that customers be informed about potential risks in trading these markets. If you do not fully understand the risks, please seek advice from an independent financial advisor before engaging in trading.
Trading forex and futures on margin carries a high level of risk and may not be suitable for all investors. The high degree of leverage can work against you as well as for you. Before deciding to trade, you should carefully consider your investment objectives, level of experience, and risk appetite.
There is a possibility of losing some or all of your initial investment, and therefore, you should not invest money that you cannot afford to lose. Be aware of the risks associated with leveraged trading and seek professional advice if necessary.
BDRipTrades Market Opinions (also applies to BDelCiel and Aligned & Wealthy LLC):
Any opinions, news, research, analysis, prices, or other information contained in my content (including live streams, videos, and posts) are provided as general market commentary only and do not constitute investment advice. BDRipTrades, BDelCiel, and Aligned & Wealthy LLC will not accept liability for any loss or damage, including but not limited to, any loss of profit, which may arise directly or indirectly from the use of or reliance on such information.
Accuracy of Information: The content I provide is subject to change at any time without notice and is intended solely for educational and informational purposes. While I strive for accuracy, I do not guarantee the completeness or reliability of any information. I am not responsible for any losses incurred due to reliance on any information shared through my platforms.
Government-Required Risk Disclaimer and Disclosure Statement:
CFTC RULE 4.41 - HYPOTHETICAL OR SIMULATED PERFORMANCE RESULTS HAVE CERTAIN LIMITATIONS. UNLIKE AN ACTUAL PERFORMANCE RECORD, SIMULATED RESULTS DO NOT REPRESENT ACTUAL TRADING. ALSO, SINCE THE TRADES HAVE NOT BEEN EXECUTED, THE RESULTS MAY HAVE UNDER-OR-OVER COMPENSATED FOR THE IMPACT, IF ANY, OF CERTAIN MARKET FACTORS, SUCH AS LACK OF LIQUIDITY. SIMULATED TRADING PROGRAMS IN GENERAL ARE ALSO SUBJECT TO THE FACT THAT THEY ARE DESIGNED WITH THE BENEFIT OF HINDSIGHT. NO REPRESENTATION IS BEING MADE THAT ANY ACCOUNT WILL OR IS LIKELY TO ACHIEVE PROFIT OR LOSSES SIMILAR TO THOSE SHOWN.
Performance results discussed in my content are hypothetical and subject to limitations. There are frequently sharp differences between hypothetical performance results and the actual results subsequently achieved by any particular trading strategy. One of the limitations of hypothetical trading results is that they do not account for real-world financial risk.
Furthermore, past performance of any trading system or strategy does not guarantee future results.
General Trading Disclaimer:
Trading in futures, forex, and other leveraged products involves substantial risk and is not appropriate for all investors.
Do not trade with money you cannot afford to lose.
I do not provide buy/sell signals, financial advice, or investment recommendations.
Any decisions you make based on my content are solely your responsibility.
By engaging with my content, including live streams, videos, educational materials, and any communication through my platforms, you acknowledge and accept that all trading decisions you make are at your own risk. BDRipTrades, BDelCiel, and Aligned & Wealthy LLC cannot and will not be held responsible for any trading losses you may incur.

My POI and Market Outlook for MNQ 2.13.25Forex, Crypto and Futures Trading Risk Disclosure:
The National Futures Association (NFA) and Commodity Futures Trading Commission (CFTC), the regulatory agencies for the forex and futures markets in the United States, require that customers be informed about potential risks in trading these markets. If you do not fully understand the risks, please seek advice from an independent financial advisor before engaging in trading.
Trading forex and futures on margin carries a high level of risk and may not be suitable for all investors. The high degree of leverage can work against you as well as for you. Before deciding to trade, you should carefully consider your investment objectives, level of experience, and risk appetite.
There is a possibility of losing some or all of your initial investment, and therefore, you should not invest money that you cannot afford to lose. Be aware of the risks associated with leveraged trading and seek professional advice if necessary.
BDRipTrades Market Opinions (also applies to BDelCiel and Aligned & Wealthy LLC):
Any opinions, news, research, analysis, prices, or other information contained in my content (including live streams, videos, and posts) are provided as general market commentary only and do not constitute investment advice. BDRipTrades, BDelCiel, and Aligned & Wealthy LLC will not accept liability for any loss or damage, including but not limited to, any loss of profit, which may arise directly or indirectly from the use of or reliance on such information.
Accuracy of Information: The content I provide is subject to change at any time without notice and is intended solely for educational and informational purposes. While I strive for accuracy, I do not guarantee the completeness or reliability of any information. I am not responsible for any losses incurred due to reliance on any information shared through my platforms.
Government-Required Risk Disclaimer and Disclosure Statement:
CFTC RULE 4.41 - HYPOTHETICAL OR SIMULATED PERFORMANCE RESULTS HAVE CERTAIN LIMITATIONS. UNLIKE AN ACTUAL PERFORMANCE RECORD, SIMULATED RESULTS DO NOT REPRESENT ACTUAL TRADING. ALSO, SINCE THE TRADES HAVE NOT BEEN EXECUTED, THE RESULTS MAY HAVE UNDER-OR-OVER COMPENSATED FOR THE IMPACT, IF ANY, OF CERTAIN MARKET FACTORS, SUCH AS LACK OF LIQUIDITY. SIMULATED TRADING PROGRAMS IN GENERAL ARE ALSO SUBJECT TO THE FACT THAT THEY ARE DESIGNED WITH THE BENEFIT OF HINDSIGHT. NO REPRESENTATION IS BEING MADE THAT ANY ACCOUNT WILL OR IS LIKELY TO ACHIEVE PROFIT OR LOSSES SIMILAR TO THOSE SHOWN.
Performance results discussed in my content are hypothetical and subject to limitations. There are frequently sharp differences between hypothetical performance results and the actual results subsequently achieved by any particular trading strategy. One of the limitations of hypothetical trading results is that they do not account for real-world financial risk.
Furthermore, past performance of any trading system or strategy does not guarantee future results.
General Trading Disclaimer:
Trading in futures, forex, and other leveraged products involves substantial risk and is not appropriate for all investors.
Do not trade with money you cannot afford to lose.
I do not provide buy/sell signals, financial advice, or investment recommendations.
Any decisions you make based on my content are solely your responsibility.
By engaging with my content, including live streams, videos, educational materials, and any communication through my platforms, you acknowledge and accept that all trading decisions you make are at your own risk. BDRipTrades, BDelCiel, and Aligned & Wealthy LLC cannot and will not be held responsible for any trading losses you may incur.

Targetting buyside on NNQThis is in demo due to the fact I’m working double this week so I had to take this on my phone, regardless we had an amazing day which is great and builds our confidence specially because we are utilizing our cellphone to take the entry.
I am starting to notice I am getting better at recognizing certain market patters making me more confident and comfortable taking my trade ideas.
Disclaimer:
Trading can bring total loss of funds, be very careful and take these trades at your own risk. ⛔️

Journey to 53K: Analyze this MNQ trade with me! 2.10.25It really helps out if you guys support and subscribe. Give it a like if you guys enjoy this content it motivates me to keep posting and shows me that what I am sharing you guys find valuable. I appreciate the 600+ views, to those watching, thank you for being an early follower of my journey and may God bless yours.
Forex, Crypto and Futures Trading Risk Disclosure:
The National Futures Association (NFA) and Commodity Futures Trading Commission (CFTC), the regulatory agencies for the forex and futures markets in the United States, require that customers be informed about potential risks in trading these markets. If you do not fully understand the risks, please seek advice from an independent financial advisor before engaging in trading.
Trading forex and futures on margin carries a high level of risk and may not be suitable for all investors. The high degree of leverage can work against you as well as for you. Before deciding to trade, you should carefully consider your investment objectives, level of experience, and risk appetite.
There is a possibility of losing some or all of your initial investment, and therefore, you should not invest money that you cannot afford to lose. Be aware of the risks associated with leveraged trading and seek professional advice if necessary.
BDRipTrades Market Opinions (also applies to BDelCiel and Aligned & Wealthy LLC):
Any opinions, news, research, analysis, prices, or other information contained in my content (including live streams, videos, and posts) are provided as general market commentary only and do not constitute investment advice. BDRipTrades, BDelCiel, and Aligned & Wealthy LLC will not accept liability for any loss or damage, including but not limited to, any loss of profit, which may arise directly or indirectly from the use of or reliance on such information.
Accuracy of Information: The content I provide is subject to change at any time without notice and is intended solely for educational and informational purposes. While I strive for accuracy, I do not guarantee the completeness or reliability of any information. I am not responsible for any losses incurred due to reliance on any information shared through my platforms.
Government-Required Risk Disclaimer and Disclosure Statement:
CFTC RULE 4.41 - HYPOTHETICAL OR SIMULATED PERFORMANCE RESULTS HAVE CERTAIN LIMITATIONS. UNLIKE AN ACTUAL PERFORMANCE RECORD, SIMULATED RESULTS DO NOT REPRESENT ACTUAL TRADING. ALSO, SINCE THE TRADES HAVE NOT BEEN EXECUTED, THE RESULTS MAY HAVE UNDER-OR-OVER COMPENSATED FOR THE IMPACT, IF ANY, OF CERTAIN MARKET FACTORS, SUCH AS LACK OF LIQUIDITY. SIMULATED TRADING PROGRAMS IN GENERAL ARE ALSO SUBJECT TO THE FACT THAT THEY ARE DESIGNED WITH THE BENEFIT OF HINDSIGHT. NO REPRESENTATION IS BEING MADE THAT ANY ACCOUNT WILL OR IS LIKELY TO ACHIEVE PROFIT OR LOSSES SIMILAR TO THOSE SHOWN.
Performance results discussed in my content are hypothetical and subject to limitations. There are frequently sharp differences between hypothetical performance results and the actual results subsequently achieved by any particular trading strategy. One of the limitations of hypothetical trading results is that they do not account for real-world financial risk.
Furthermore, past performance of any trading system or strategy does not guarantee future results.
General Trading Disclaimer:
Trading in futures, forex, and other leveraged products involves substantial risk and is not appropriate for all investors.
Do not trade with money you cannot afford to lose.
I do not provide buy/sell signals, financial advice, or investment recommendations.
Any decisions you make based on my content are solely your responsibility.
By engaging with my content, including live streams, videos, educational materials, and any communication through my platforms, you acknowledge and accept that all trading decisions you make are at your own risk. BDRipTrades, BDelCiel, and Aligned & Wealthy LLC cannot and will not be held responsible for any trading losses you may incur.

MNQ Practicing some Entries on NFP.Just practicing for next week. Not trading today.
Market is choppy and coming my for stops so you have to leave wider stops., which I am not comfortable with. I like to enter trades that run with my entry.
But we can see we got some right entries the stops just needed to be wider and the bias/target was correct. So lets see the outcome of the trading day but I am content with the shots I took today.
Forex, Crypto and Futures Trading Risk Disclosure:
The National Futures Association (NFA) and Commodity Futures Trading Commission (CFTC), the regulatory agencies for the forex and futures markets in the United States, require that customers be informed about potential risks in trading these markets. If you do not fully understand the risks, please seek advice from an independent financial advisor before engaging in trading.
Trading forex and futures on margin carries a high level of risk and may not be suitable for all investors. The high degree of leverage can work against you as well as for you. Before deciding to trade, you should carefully consider your investment objectives, level of experience, and risk appetite.
There is a possibility of losing some or all of your initial investment, and therefore, you should not invest money that you cannot afford to lose. Be aware of the risks associated with leveraged trading and seek professional advice if necessary.
BDRipTrades Market Opinions (also applies to BDelCiel and Aligned & Wealthy LLC):
Any opinions, news, research, analysis, prices, or other information contained in my content (including live streams, videos, and posts) are provided as general market commentary only and do not constitute investment advice. BDRipTrades, BDelCiel, and Aligned & Wealthy LLC will not accept liability for any loss or damage, including but not limited to, any loss of profit, which may arise directly or indirectly from the use of or reliance on such information.
Accuracy of Information: The content I provide is subject to change at any time without notice and is intended solely for educational and informational purposes. While I strive for accuracy, I do not guarantee the completeness or reliability of any information. I am not responsible for any losses incurred due to reliance on any information shared through my platforms.
Government-Required Risk Disclaimer and Disclosure Statement:
CFTC RULE 4.41 - HYPOTHETICAL OR SIMULATED PERFORMANCE RESULTS HAVE CERTAIN LIMITATIONS. UNLIKE AN ACTUAL PERFORMANCE RECORD, SIMULATED RESULTS DO NOT REPRESENT ACTUAL TRADING. ALSO, SINCE THE TRADES HAVE NOT BEEN EXECUTED, THE RESULTS MAY HAVE UNDER-OR-OVER COMPENSATED FOR THE IMPACT, IF ANY, OF CERTAIN MARKET FACTORS, SUCH AS LACK OF LIQUIDITY. SIMULATED TRADING PROGRAMS IN GENERAL ARE ALSO SUBJECT TO THE FACT THAT THEY ARE DESIGNED WITH THE BENEFIT OF HINDSIGHT. NO REPRESENTATION IS BEING MADE THAT ANY ACCOUNT WILL OR IS LIKELY TO ACHIEVE PROFIT OR LOSSES SIMILAR TO THOSE SHOWN.
Performance results discussed in my content are hypothetical and subject to limitations. There are frequently sharp differences between hypothetical performance results and the actual results subsequently achieved by any particular trading strategy. One of the limitations of hypothetical trading results is that they do not account for real-world financial risk.
Furthermore, past performance of any trading system or strategy does not guarantee future results.
General Trading Disclaimer:
Trading in futures, forex, and other leveraged products involves substantial risk and is not appropriate for all investors.
Do not trade with money you cannot afford to lose.
I do not provide buy/sell signals, financial advice, or investment recommendations.
Any decisions you make based on my content are solely your responsibility.
By engaging with my content, including live streams, videos, educational materials, and any communication through my platforms, you acknowledge and accept that all trading decisions you make are at your own risk. BDRipTrades, BDelCiel, and Aligned & Wealthy LLC cannot and will not be held responsible for any trading losses you may incur.

Catching the FOMC buy on MNQ - Leap ChallengeUsing the Paper trading leap account for this, did not want to risk my prop firm account but as we can see we had an extremely profitable day. This happens to me often where I decide not to trade for safety and then the day I decide not to trade is usually my biggest days sometimes. Lol
Anyways, If you guys want me to share and post the execution of this trade, I would really appreciate if you guys could give this post some likes.
Please do follow and subscribe for my MNQ & NQ market insights. I am happy to see you here!
Forex, Crypto and Futures Trading Risk Disclosure:
The National Futures Association (NFA) and Commodity Futures Trading Commission (CFTC), the regulatory agencies for the forex and futures markets in the United States, require that customers be informed about potential risks in trading these markets. If you do not fully understand the risks, please seek advice from an independent financial advisor before engaging in trading.
Trading forex and futures on margin carries a high level of risk and may not be suitable for all investors. The high degree of leverage can work against you as well as for you. Before deciding to trade, you should carefully consider your investment objectives, level of experience, and risk appetite.
There is a possibility of losing some or all of your initial investment, and therefore, you should not invest money that you cannot afford to lose. Be aware of the risks associated with leveraged trading and seek professional advice if necessary.
BDRipTrades Market Opinions (also applies to BDelCiel and Aligned & Wealthy LLC):
Any opinions, news, research, analysis, prices, or other information contained in my content (including live streams, videos, and posts) are provided as general market commentary only and do not constitute investment advice. BDRipTrades, BDelCiel, and Aligned & Wealthy LLC will not accept liability for any loss or damage, including but not limited to, any loss of profit, which may arise directly or indirectly from the use of or reliance on such information.
Accuracy of Information: The content I provide is subject to change at any time without notice and is intended solely for educational and informational purposes. While I strive for accuracy, I do not guarantee the completeness or reliability of any information. I am not responsible for any losses incurred due to reliance on any information shared through my platforms.
Government-Required Risk Disclaimer and Disclosure Statement:
CFTC RULE 4.41 - HYPOTHETICAL OR SIMULATED PERFORMANCE RESULTS HAVE CERTAIN LIMITATIONS. UNLIKE AN ACTUAL PERFORMANCE RECORD, SIMULATED RESULTS DO NOT REPRESENT ACTUAL TRADING. ALSO, SINCE THE TRADES HAVE NOT BEEN EXECUTED, THE RESULTS MAY HAVE UNDER-OR-OVER COMPENSATED FOR THE IMPACT, IF ANY, OF CERTAIN MARKET FACTORS, SUCH AS LACK OF LIQUIDITY. SIMULATED TRADING PROGRAMS IN GENERAL ARE ALSO SUBJECT TO THE FACT THAT THEY ARE DESIGNED WITH THE BENEFIT OF HINDSIGHT. NO REPRESENTATION IS BEING MADE THAT ANY ACCOUNT WILL OR IS LIKELY TO ACHIEVE PROFIT OR LOSSES SIMILAR TO THOSE SHOWN.
Performance results discussed in my content are hypothetical and subject to limitations. There are frequently sharp differences between hypothetical performance results and the actual results subsequently achieved by any particular trading strategy. One of the limitations of hypothetical trading results is that they do not account for real-world financial risk.
Furthermore, past performance of any trading system or strategy does not guarantee future results.
General Trading Disclaimer:
Trading in futures, forex, and other leveraged products involves substantial risk and is not appropriate for all investors.
Do not trade with money you cannot afford to lose.
I do not provide buy/sell signals, financial advice, or investment recommendations.
Any decisions you make based on my content are solely your responsibility.
By engaging with my content, including live streams, videos, educational materials, and any communication through my platforms, you acknowledge and accept that all trading decisions you make are at your own risk. BDRipTrades, BDelCiel, and Aligned & Wealthy LLC cannot and will not be held responsible for any trading losses you may incur.

Journey to 53k: Mitigating my losses during London SessionTrading Ideas shared here, with a reversal trade after market decided to manipulate lower to that 50% Bullish FVG level outlined by ICT.
Forex, Crypto and Futures Trading Risk Disclosure:
The National Futures Association (NFA) and Commodity Futures Trading Commission (CFTC), the regulatory agencies for the forex and futures markets in the United States, require that customers be informed about potential risks in trading these markets. If you do not fully understand the risks, please seek advice from an independent financial advisor before engaging in trading.
Trading forex and futures on margin carries a high level of risk and may not be suitable for all investors. The high degree of leverage can work against you as well as for you. Before deciding to trade, you should carefully consider your investment objectives, level of experience, and risk appetite.
There is a possibility of losing some or all of your initial investment, and therefore, you should not invest money that you cannot afford to lose. Be aware of the risks associated with leveraged trading and seek professional advice if necessary.
BDRipTrades Market Opinions (also applies to BDelCiel and Aligned & Wealthy LLC):
Any opinions, news, research, analysis, prices, or other information contained in my content (including live streams, videos, and posts) are provided as general market commentary only and do not constitute investment advice. BDRipTrades, BDelCiel, and Aligned & Wealthy LLC will not accept liability for any loss or damage, including but not limited to, any loss of profit, which may arise directly or indirectly from the use of or reliance on such information.
Accuracy of Information: The content I provide is subject to change at any time without notice and is intended solely for educational and informational purposes. While I strive for accuracy, I do not guarantee the completeness or reliability of any information. I am not responsible for any losses incurred due to reliance on any information shared through my platforms.
Government-Required Risk Disclaimer and Disclosure Statement:
CFTC RULE 4.41 - HYPOTHETICAL OR SIMULATED PERFORMANCE RESULTS HAVE CERTAIN LIMITATIONS. UNLIKE AN ACTUAL PERFORMANCE RECORD, SIMULATED RESULTS DO NOT REPRESENT ACTUAL TRADING. ALSO, SINCE THE TRADES HAVE NOT BEEN EXECUTED, THE RESULTS MAY HAVE UNDER-OR-OVER COMPENSATED FOR THE IMPACT, IF ANY, OF CERTAIN MARKET FACTORS, SUCH AS LACK OF LIQUIDITY. SIMULATED TRADING PROGRAMS IN GENERAL ARE ALSO SUBJECT TO THE FACT THAT THEY ARE DESIGNED WITH THE BENEFIT OF HINDSIGHT. NO REPRESENTATION IS BEING MADE THAT ANY ACCOUNT WILL OR IS LIKELY TO ACHIEVE PROFIT OR LOSSES SIMILAR TO THOSE SHOWN.
Performance results discussed in my content are hypothetical and subject to limitations. There are frequently sharp differences between hypothetical performance results and the actual results subsequently achieved by any particular trading strategy. One of the limitations of hypothetical trading results is that they do not account for real-world financial risk.
Furthermore, past performance of any trading system or strategy does not guarantee future results.
General Trading Disclaimer:
Trading in futures, forex, and other leveraged products involves substantial risk and is not appropriate for all investors.
Do not trade with money you cannot afford to lose.
I do not provide buy/sell signals, financial advice, or investment recommendations.
Any decisions you make based on my content are solely your responsibility.
By engaging with my content, including live streams, videos, educational materials, and any communication through my platforms, you acknowledge and accept that all trading decisions you make are at your own risk. BDRipTrades, BDelCiel, and Aligned & Wealthy LLC cannot and will not be held responsible for any trading losses you may incur.

Journey to 53K: MNQ London Buy IdeaLondon Trade Idea reversal after tapping the FVG pointed out by ICT twice.
Forex, Crypto and Futures Trading Risk Disclosure:
The National Futures Association (NFA) and Commodity Futures Trading Commission (CFTC), the regulatory agencies for the forex and futures markets in the United States, require that customers be informed about potential risks in trading these markets. If you do not fully understand the risks, please seek advice from an independent financial advisor before engaging in trading.
Trading forex and futures on margin carries a high level of risk and may not be suitable for all investors. The high degree of leverage can work against you as well as for you. Before deciding to trade, you should carefully consider your investment objectives, level of experience, and risk appetite.
There is a possibility of losing some or all of your initial investment, and therefore, you should not invest money that you cannot afford to lose. Be aware of the risks associated with leveraged trading and seek professional advice if necessary.
BDRipTrades Market Opinions (also applies to BDelCiel and Aligned & Wealthy LLC):
Any opinions, news, research, analysis, prices, or other information contained in my content (including live streams, videos, and posts) are provided as general market commentary only and do not constitute investment advice. BDRipTrades, BDelCiel, and Aligned & Wealthy LLC will not accept liability for any loss or damage, including but not limited to, any loss of profit, which may arise directly or indirectly from the use of or reliance on such information.
Accuracy of Information: The content I provide is subject to change at any time without notice and is intended solely for educational and informational purposes. While I strive for accuracy, I do not guarantee the completeness or reliability of any information. I am not responsible for any losses incurred due to reliance on any information shared through my platforms.
Government-Required Risk Disclaimer and Disclosure Statement:
CFTC RULE 4.41 - HYPOTHETICAL OR SIMULATED PERFORMANCE RESULTS HAVE CERTAIN LIMITATIONS. UNLIKE AN ACTUAL PERFORMANCE RECORD, SIMULATED RESULTS DO NOT REPRESENT ACTUAL TRADING. ALSO, SINCE THE TRADES HAVE NOT BEEN EXECUTED, THE RESULTS MAY HAVE UNDER-OR-OVER COMPENSATED FOR THE IMPACT, IF ANY, OF CERTAIN MARKET FACTORS, SUCH AS LACK OF LIQUIDITY. SIMULATED TRADING PROGRAMS IN GENERAL ARE ALSO SUBJECT TO THE FACT THAT THEY ARE DESIGNED WITH THE BENEFIT OF HINDSIGHT. NO REPRESENTATION IS BEING MADE THAT ANY ACCOUNT WILL OR IS LIKELY TO ACHIEVE PROFIT OR LOSSES SIMILAR TO THOSE SHOWN.
Performance results discussed in my content are hypothetical and subject to limitations. There are frequently sharp differences between hypothetical performance results and the actual results subsequently achieved by any particular trading strategy. One of the limitations of hypothetical trading results is that they do not account for real-world financial risk.
Furthermore, past performance of any trading system or strategy does not guarantee future results.
General Trading Disclaimer:
Trading in futures, forex, and other leveraged products involves substantial risk and is not appropriate for all investors.
Do not trade with money you cannot afford to lose.
I do not provide buy/sell signals, financial advice, or investment recommendations.
Any decisions you make based on my content are solely your responsibility.
By engaging with my content, including live streams, videos, educational materials, and any communication through my platforms, you acknowledge and accept that all trading decisions you make are at your own risk. BDRipTrades, BDelCiel, and Aligned & Wealthy LLC cannot and will not be held responsible for any trading losses you may incur.

Journey to 53k: 50 point trade on MNQ with my ideasQuick Idea, I am on the run today. Have alot going on! But I wanted to catch another one. Got stopped out at 51 points I believe. But I am content with the trade.
Give a like if you enjoy me sharing these ideas!
Forex, Crypto and Futures Trading Risk Disclosure:
The National Futures Association (NFA) and Commodity Futures Trading Commission (CFTC), the regulatory agencies for the forex and futures markets in the United States, require that customers be informed about potential risks in trading these markets. If you do not fully understand the risks, please seek advice from an independent financial advisor before engaging in trading.
Trading forex and futures on margin carries a high level of risk and may not be suitable for all investors. The high degree of leverage can work against you as well as for you. Before deciding to trade, you should carefully consider your investment objectives, level of experience, and risk appetite.
There is a possibility of losing some or all of your initial investment, and therefore, you should not invest money that you cannot afford to lose. Be aware of the risks associated with leveraged trading and seek professional advice if necessary.
BDRipTrades Market Opinions (also applies to BDelCiel and Aligned & Wealthy LLC):
Any opinions, news, research, analysis, prices, or other information contained in my content (including live streams, videos, and posts) are provided as general market commentary only and do not constitute investment advice. BDRipTrades, BDelCiel, and Aligned & Wealthy LLC will not accept liability for any loss or damage, including but not limited to, any loss of profit, which may arise directly or indirectly from the use of or reliance on such information.
Accuracy of Information: The content I provide is subject to change at any time without notice and is intended solely for educational and informational purposes. While I strive for accuracy, I do not guarantee the completeness or reliability of any information. I am not responsible for any losses incurred due to reliance on any information shared through my platforms.
Government-Required Risk Disclaimer and Disclosure Statement:
CFTC RULE 4.41 - HYPOTHETICAL OR SIMULATED PERFORMANCE RESULTS HAVE CERTAIN LIMITATIONS. UNLIKE AN ACTUAL PERFORMANCE RECORD, SIMULATED RESULTS DO NOT REPRESENT ACTUAL TRADING. ALSO, SINCE THE TRADES HAVE NOT BEEN EXECUTED, THE RESULTS MAY HAVE UNDER-OR-OVER COMPENSATED FOR THE IMPACT, IF ANY, OF CERTAIN MARKET FACTORS, SUCH AS LACK OF LIQUIDITY. SIMULATED TRADING PROGRAMS IN GENERAL ARE ALSO SUBJECT TO THE FACT THAT THEY ARE DESIGNED WITH THE BENEFIT OF HINDSIGHT. NO REPRESENTATION IS BEING MADE THAT ANY ACCOUNT WILL OR IS LIKELY TO ACHIEVE PROFIT OR LOSSES SIMILAR TO THOSE SHOWN.
Performance results discussed in my content are hypothetical and subject to limitations. There are frequently sharp differences between hypothetical performance results and the actual results subsequently achieved by any particular trading strategy. One of the limitations of hypothetical trading results is that they do not account for real-world financial risk.
Furthermore, past performance of any trading system or strategy does not guarantee future results.
General Trading Disclaimer:
Trading in futures, forex, and other leveraged products involves substantial risk and is not appropriate for all investors.
Do not trade with money you cannot afford to lose.
I do not provide buy/sell signals, financial advice, or investment recommendations.
Any decisions you make based on my content are solely your responsibility.
By engaging with my content, including live streams, videos, educational materials, and any communication through my platforms, you acknowledge and accept that all trading decisions you make are at your own risk. BDRipTrades, BDelCiel, and Aligned & Wealthy LLC cannot and will not be held responsible for any trading losses you may incur.

Journey to 53k: Trade Idea Execution 2.4.25Will we see lower prices from here? SL is already at BE and in profits in case price reverses against us.
drop a like and a comment if you like this type of content!
Forex, Crypto and Futures Trading Risk Disclosure:
The National Futures Association (NFA) and Commodity Futures Trading Commission (CFTC), the regulatory agencies for the forex and futures markets in the United States, require that customers be informed about potential risks in trading these markets. If you do not fully understand the risks, please seek advice from an independent financial advisor before engaging in trading.
Trading forex and futures on margin carries a high level of risk and may not be suitable for all investors. The high degree of leverage can work against you as well as for you. Before deciding to trade, you should carefully consider your investment objectives, level of experience, and risk appetite.
There is a possibility of losing some or all of your initial investment, and therefore, you should not invest money that you cannot afford to lose. Be aware of the risks associated with leveraged trading and seek professional advice if necessary.
BDRipTrades Market Opinions (also applies to BDelCiel and Aligned & Wealthy LLC):
Any opinions, news, research, analysis, prices, or other information contained in my content (including live streams, videos, and posts) are provided as general market commentary only and do not constitute investment advice. BDRipTrades, BDelCiel, and Aligned & Wealthy LLC will not accept liability for any loss or damage, including but not limited to, any loss of profit, which may arise directly or indirectly from the use of or reliance on such information.
Accuracy of Information: The content I provide is subject to change at any time without notice and is intended solely for educational and informational purposes. While I strive for accuracy, I do not guarantee the completeness or reliability of any information. I am not responsible for any losses incurred due to reliance on any information shared through my platforms.
Government-Required Risk Disclaimer and Disclosure Statement:
CFTC RULE 4.41 - HYPOTHETICAL OR SIMULATED PERFORMANCE RESULTS HAVE CERTAIN LIMITATIONS. UNLIKE AN ACTUAL PERFORMANCE RECORD, SIMULATED RESULTS DO NOT REPRESENT ACTUAL TRADING. ALSO, SINCE THE TRADES HAVE NOT BEEN EXECUTED, THE RESULTS MAY HAVE UNDER-OR-OVER COMPENSATED FOR THE IMPACT, IF ANY, OF CERTAIN MARKET FACTORS, SUCH AS LACK OF LIQUIDITY. SIMULATED TRADING PROGRAMS IN GENERAL ARE ALSO SUBJECT TO THE FACT THAT THEY ARE DESIGNED WITH THE BENEFIT OF HINDSIGHT. NO REPRESENTATION IS BEING MADE THAT ANY ACCOUNT WILL OR IS LIKELY TO ACHIEVE PROFIT OR LOSSES SIMILAR TO THOSE SHOWN.
Performance results discussed in my content are hypothetical and subject to limitations. There are frequently sharp differences between hypothetical performance results and the actual results subsequently achieved by any particular trading strategy. One of the limitations of hypothetical trading results is that they do not account for real-world financial risk.
Furthermore, past performance of any trading system or strategy does not guarantee future results.
General Trading Disclaimer:
Trading in futures, forex, and other leveraged products involves substantial risk and is not appropriate for all investors.
Do not trade with money you cannot afford to lose.
I do not provide buy/sell signals, financial advice, or investment recommendations.
Any decisions you make based on my content are solely your responsibility.
By engaging with my content, including live streams, videos, educational materials, and any communication through my platforms, you acknowledge and accept that all trading decisions you make are at your own risk. BDRipTrades, BDelCiel, and Aligned & Wealthy LLC cannot and will not be held responsible for any trading losses you may incur.

Journey to 53K: 2.3.25 My Live executions with ICT NQ CommentaryTook some L's today but I accept because I do not want to repeat last week over again.
We also have to get ready for work and make some breakfast for my sisters so we are calling it today. May tomorrow and the other days this week bring me more blessings. but we will see. I am really working on not feeling rushed.
Forex, Crypto and Futures Trading Risk Disclosure:
The National Futures Association (NFA) and Commodity Futures Trading Commission (CFTC), the regulatory agencies for the forex and futures markets in the United States, require that customers be informed about potential risks in trading these markets. If you do not fully understand the risks, please seek advice from an independent financial advisor before engaging in trading.
Trading forex and futures on margin carries a high level of risk and may not be suitable for all investors. The high degree of leverage can work against you as well as for you. Before deciding to trade, you should carefully consider your investment objectives, level of experience, and risk appetite.
There is a possibility of losing some or all of your initial investment, and therefore, you should not invest money that you cannot afford to lose. Be aware of the risks associated with leveraged trading and seek professional advice if necessary.
BDRipTrades Market Opinions (also applies to BDelCiel and Aligned & Wealthy LLC):
Any opinions, news, research, analysis, prices, or other information contained in my content (including live streams, videos, and posts) are provided as general market commentary only and do not constitute investment advice. BDRipTrades, BDelCiel, and Aligned & Wealthy LLC will not accept liability for any loss or damage, including but not limited to, any loss of profit, which may arise directly or indirectly from the use of or reliance on such information.
Accuracy of Information: The content I provide is subject to change at any time without notice and is intended solely for educational and informational purposes. While I strive for accuracy, I do not guarantee the completeness or reliability of any information. I am not responsible for any losses incurred due to reliance on any information shared through my platforms.
Government-Required Risk Disclaimer and Disclosure Statement:
CFTC RULE 4.41 - HYPOTHETICAL OR SIMULATED PERFORMANCE RESULTS HAVE CERTAIN LIMITATIONS. UNLIKE AN ACTUAL PERFORMANCE RECORD, SIMULATED RESULTS DO NOT REPRESENT ACTUAL TRADING. ALSO, SINCE THE TRADES HAVE NOT BEEN EXECUTED, THE RESULTS MAY HAVE UNDER-OR-OVER COMPENSATED FOR THE IMPACT, IF ANY, OF CERTAIN MARKET FACTORS, SUCH AS LACK OF LIQUIDITY. SIMULATED TRADING PROGRAMS IN GENERAL ARE ALSO SUBJECT TO THE FACT THAT THEY ARE DESIGNED WITH THE BENEFIT OF HINDSIGHT. NO REPRESENTATION IS BEING MADE THAT ANY ACCOUNT WILL OR IS LIKELY TO ACHIEVE PROFIT OR LOSSES SIMILAR TO THOSE SHOWN.
Performance results discussed in my content are hypothetical and subject to limitations. There are frequently sharp differences between hypothetical performance results and the actual results subsequently achieved by any particular trading strategy. One of the limitations of hypothetical trading results is that they do not account for real-world financial risk.
Furthermore, past performance of any trading system or strategy does not guarantee future results.
General Trading Disclaimer:
Trading in futures, forex, and other leveraged products involves substantial risk and is not appropriate for all investors.
Do not trade with money you cannot afford to lose.
I do not provide buy/sell signals, financial advice, or investment recommendations.
Any decisions you make based on my content are solely your responsibility.
By engaging with my content, including live streams, videos, educational materials, and any communication through my platforms, you acknowledge and accept that all trading decisions you make are at your own risk. BDRipTrades, BDelCiel, and Aligned & Wealthy LLC cannot and will not be held responsible for any trading losses you may incur.

Re-entry to trade Part 2. Continuation here to the first part.
Forex, Crypto and Futures Trading Risk Disclosure:
The National Futures Association (NFA) and Commodity Futures Trading Commission (CFTC), the regulatory agencies for the forex and futures markets in the United States, require that customers be informed about potential risks in trading these markets. If you do not fully understand the risks, please seek advice from an independent financial advisor before engaging in trading.
Trading forex and futures on margin carries a high level of risk and may not be suitable for all investors. The high degree of leverage can work against you as well as for you. Before deciding to trade, you should carefully consider your investment objectives, level of experience, and risk appetite.
There is a possibility of losing some or all of your initial investment, and therefore, you should not invest money that you cannot afford to lose. Be aware of the risks associated with leveraged trading and seek professional advice if necessary.
BDRipTrades Market Opinions (also applies to BDelCiel and Aligned & Wealthy LLC):
Any opinions, news, research, analysis, prices, or other information contained in my content (including live streams, videos, and posts) are provided as general market commentary only and do not constitute investment advice. BDRipTrades, BDelCiel, and Aligned & Wealthy LLC will not accept liability for any loss or damage, including but not limited to, any loss of profit, which may arise directly or indirectly from the use of or reliance on such information.
Accuracy of Information: The content I provide is subject to change at any time without notice and is intended solely for educational and informational purposes. While I strive for accuracy, I do not guarantee the completeness or reliability of any information. I am not responsible for any losses incurred due to reliance on any information shared through my platforms.
Government-Required Risk Disclaimer and Disclosure Statement:
CFTC RULE 4.41 - HYPOTHETICAL OR SIMULATED PERFORMANCE RESULTS HAVE CERTAIN LIMITATIONS. UNLIKE AN ACTUAL PERFORMANCE RECORD, SIMULATED RESULTS DO NOT REPRESENT ACTUAL TRADING. ALSO, SINCE THE TRADES HAVE NOT BEEN EXECUTED, THE RESULTS MAY HAVE UNDER-OR-OVER COMPENSATED FOR THE IMPACT, IF ANY, OF CERTAIN MARKET FACTORS, SUCH AS LACK OF LIQUIDITY. SIMULATED TRADING PROGRAMS IN GENERAL ARE ALSO SUBJECT TO THE FACT THAT THEY ARE DESIGNED WITH THE BENEFIT OF HINDSIGHT. NO REPRESENTATION IS BEING MADE THAT ANY ACCOUNT WILL OR IS LIKELY TO ACHIEVE PROFIT OR LOSSES SIMILAR TO THOSE SHOWN.
Performance results discussed in my content are hypothetical and subject to limitations. There are frequently sharp differences between hypothetical performance results and the actual results subsequently achieved by any particular trading strategy. One of the limitations of hypothetical trading results is that they do not account for real-world financial risk.
Furthermore, past performance of any trading system or strategy does not guarantee future results.
General Trading Disclaimer:
Trading in futures, forex, and other leveraged products involves substantial risk and is not appropriate for all investors.
Do not trade with money you cannot afford to lose.
I do not provide buy/sell signals, financial advice, or investment recommendations.
Any decisions you make based on my content are solely your responsibility.
By engaging with my content, including live streams, videos, educational materials, and any communication through my platforms, you acknowledge and accept that all trading decisions you make are at your own risk. BDRipTrades, BDelCiel, and Aligned & Wealthy LLC cannot and will not be held responsible for any trading losses you may incur.

RE-ENTRY After STOPOUTShowing a re-entry execution here.
Forex, Crypto and Futures Trading Risk Disclosure:
The National Futures Association (NFA) and Commodity Futures Trading Commission (CFTC), the regulatory agencies for the forex and futures markets in the United States, require that customers be informed about potential risks in trading these markets. If you do not fully understand the risks, please seek advice from an independent financial advisor before engaging in trading.
Trading forex and futures on margin carries a high level of risk and may not be suitable for all investors. The high degree of leverage can work against you as well as for you. Before deciding to trade, you should carefully consider your investment objectives, level of experience, and risk appetite.
There is a possibility of losing some or all of your initial investment, and therefore, you should not invest money that you cannot afford to lose. Be aware of the risks associated with leveraged trading and seek professional advice if necessary.
BDRipTrades Market Opinions (also applies to BDelCiel and Aligned & Wealthy LLC):
Any opinions, news, research, analysis, prices, or other information contained in my content (including live streams, videos, and posts) are provided as general market commentary only and do not constitute investment advice. BDRipTrades, BDelCiel, and Aligned & Wealthy LLC will not accept liability for any loss or damage, including but not limited to, any loss of profit, which may arise directly or indirectly from the use of or reliance on such information.
Accuracy of Information: The content I provide is subject to change at any time without notice and is intended solely for educational and informational purposes. While I strive for accuracy, I do not guarantee the completeness or reliability of any information. I am not responsible for any losses incurred due to reliance on any information shared through my platforms.
Government-Required Risk Disclaimer and Disclosure Statement:
CFTC RULE 4.41 - HYPOTHETICAL OR SIMULATED PERFORMANCE RESULTS HAVE CERTAIN LIMITATIONS. UNLIKE AN ACTUAL PERFORMANCE RECORD, SIMULATED RESULTS DO NOT REPRESENT ACTUAL TRADING. ALSO, SINCE THE TRADES HAVE NOT BEEN EXECUTED, THE RESULTS MAY HAVE UNDER-OR-OVER COMPENSATED FOR THE IMPACT, IF ANY, OF CERTAIN MARKET FACTORS, SUCH AS LACK OF LIQUIDITY. SIMULATED TRADING PROGRAMS IN GENERAL ARE ALSO SUBJECT TO THE FACT THAT THEY ARE DESIGNED WITH THE BENEFIT OF HINDSIGHT. NO REPRESENTATION IS BEING MADE THAT ANY ACCOUNT WILL OR IS LIKELY TO ACHIEVE PROFIT OR LOSSES SIMILAR TO THOSE SHOWN.
Performance results discussed in my content are hypothetical and subject to limitations. There are frequently sharp differences between hypothetical performance results and the actual results subsequently achieved by any particular trading strategy. One of the limitations of hypothetical trading results is that they do not account for real-world financial risk.
Furthermore, past performance of any trading system or strategy does not guarantee future results.
General Trading Disclaimer:
Trading in futures, forex, and other leveraged products involves substantial risk and is not appropriate for all investors.
Do not trade with money you cannot afford to lose.
I do not provide buy/sell signals, financial advice, or investment recommendations.
Any decisions you make based on my content are solely your responsibility.
By engaging with my content, including live streams, videos, educational materials, and any communication through my platforms, you acknowledge and accept that all trading decisions you make are at your own risk. BDRipTrades, BDelCiel, and Aligned & Wealthy LLC cannot and will not be held responsible for any trading losses you may incur.

Mark up a chart and watch me execute an idea Practice account trade since its Sunday -- we had a tough trading week last week almost blowing the account. So we want to enter the week slowly as we wait to see what the market intends to target first.
Forex, Crypto and Futures Trading Risk Disclosure:
The National Futures Association (NFA) and Commodity Futures Trading Commission (CFTC), the regulatory agencies for the forex and futures markets in the United States, require that customers be informed about potential risks in trading these markets. If you do not fully understand the risks, please seek advice from an independent financial advisor before engaging in trading.
Trading forex and futures on margin carries a high level of risk and may not be suitable for all investors. The high degree of leverage can work against you as well as for you. Before deciding to trade, you should carefully consider your investment objectives, level of experience, and risk appetite.
There is a possibility of losing some or all of your initial investment, and therefore, you should not invest money that you cannot afford to lose. Be aware of the risks associated with leveraged trading and seek professional advice if necessary.
BDRipTrades Market Opinions (also applies to BDelCiel and Aligned & Wealthy LLC):
Any opinions, news, research, analysis, prices, or other information contained in my content (including live streams, videos, and posts) are provided as general market commentary only and do not constitute investment advice. BDRipTrades, BDelCiel, and Aligned & Wealthy LLC will not accept liability for any loss or damage, including but not limited to, any loss of profit, which may arise directly or indirectly from the use of or reliance on such information.
Accuracy of Information: The content I provide is subject to change at any time without notice and is intended solely for educational and informational purposes. While I strive for accuracy, I do not guarantee the completeness or reliability of any information. I am not responsible for any losses incurred due to reliance on any information shared through my platforms.
Government-Required Risk Disclaimer and Disclosure Statement:
CFTC RULE 4.41 - HYPOTHETICAL OR SIMULATED PERFORMANCE RESULTS HAVE CERTAIN LIMITATIONS. UNLIKE AN ACTUAL PERFORMANCE RECORD, SIMULATED RESULTS DO NOT REPRESENT ACTUAL TRADING. ALSO, SINCE THE TRADES HAVE NOT BEEN EXECUTED, THE RESULTS MAY HAVE UNDER-OR-OVER COMPENSATED FOR THE IMPACT, IF ANY, OF CERTAIN MARKET FACTORS, SUCH AS LACK OF LIQUIDITY. SIMULATED TRADING PROGRAMS IN GENERAL ARE ALSO SUBJECT TO THE FACT THAT THEY ARE DESIGNED WITH THE BENEFIT OF HINDSIGHT. NO REPRESENTATION IS BEING MADE THAT ANY ACCOUNT WILL OR IS LIKELY TO ACHIEVE PROFIT OR LOSSES SIMILAR TO THOSE SHOWN.
Performance results discussed in my content are hypothetical and subject to limitations. There are frequently sharp differences between hypothetical performance results and the actual results subsequently achieved by any particular trading strategy. One of the limitations of hypothetical trading results is that they do not account for real-world financial risk.
Furthermore, past performance of any trading system or strategy does not guarantee future results.
General Trading Disclaimer:
Trading in futures, forex, and other leveraged products involves substantial risk and is not appropriate for all investors.
Do not trade with money you cannot afford to lose.
I do not provide buy/sell signals, financial advice, or investment recommendations.
Any decisions you make based on my content are solely your responsibility.
By engaging with my content, including live streams, videos, educational materials, and any communication through my platforms, you acknowledge and accept that all trading decisions you make are at your own risk. BDRipTrades, BDelCiel, and Aligned & Wealthy LLC cannot and will not be held responsible for any trading losses you may incur.

Nvidia's Largest Single-Day Decline and Its ImplicationsNvidia Experienced Its Largest Single-Day Decline on 27th Jan, tumbled 17%, erasing USD589B from its market capitalisation, it was the biggest in the US stock market history.
What will be the implications?
Last month, we discussed how the Nasdaq reached and responded well to the upper band of its parallel channel.
Nvidia being one of the largest market cap stocks in Nasdaq. What will be Nasdaq’s performance like for the rest of the year?
Let’s explore how we can include fundamental analysis to make sense of the situation.
Micro E-Mini Nasdaq-100 Index Futures & Options
Ticker: MNQ
Minimum fluctuation:
0.25 index points = $0.50
Disclaimer:
• What presented here is not a recommendation, please consult your licensed broker.
• Our mission is to create lateral thinking skills for every investor and trader, knowing when to take a calculated risk with market uncertainty and a bolder risk when opportunity arises.
CME Real-time Market Data help identify trading set-ups in real-time and express my market views. If you have futures in your trading portfolio, you can check out on CME Group data plans available that suit your trading needs www.tradingview.com

JOURNEY TO 53K: MNQ NY AM TRADEMy live trades with MNQ today -- fair share of wins and losses. Ended the day Up. This is only the AM session. PM Session is on my phone, will be shared on other platforms-- not here.
I was utilizing IFVG and bearish FVGs for that final bearish trade. We could've taken profit at the lows when they were taken and IDEALLY that is what we should have done instead of letting it hit our SL.

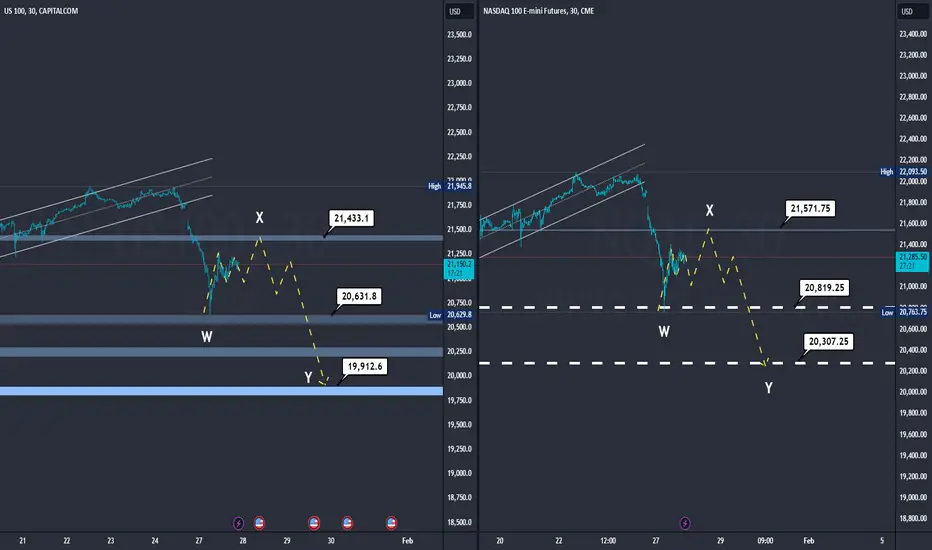
bloodbathNASDAQ (Left)
Elliott Wave Pattern: A possible Elliott Wave pattern is seen with an impulse and correction structure. Wave X appears to be a resistance point where the price has bounced down.
Key Zones:
Resistance: 21,433.1 (point X)
Support: 20,150.6 (point W)
Zone of Interest: 19,912.6 (point Y)
Analysis: The price has touched the resistance at 21,433.1 and has pulled back. If the price breaks this level, it could signal a continuation of the bullish movement. However, if the price fails to overcome this resistance and falls again, it could look for support at 20,150.6 or even lower at 19,912.6.
NQ (Right)
Elliott Wave Pattern: Similar to the NASDAQ, a wave pattern is observed with an impulse and correction structure. Point X again acts as resistance.
Key Zones:
Resistance: 21,571.75 (point X)
Support: 20,819.25 (point W)
Zone of Interest: 20,307.25 (point Y)
Analysis: The price has touched the resistance at 21,571.75 and has turned down. If the price breaks this resistance, it could indicate a strong bullish movement. If not, the price could look for the support at 20,819.25 or continue to move down towards 20,307.25.
Trading Idea on TradingView
Trading Strategy:
NASDAQ:
Long Entry: If price breaks and closes above 21,433.1 with significant volume, it could be a signal to go long, looking for an initial target at the next resistance.
Short Entry: If price fails to break 21,433.1 and shows signs of reversal, a short entry could be considered with a target towards 20,150.6 or 19,912.6.
NQ:
Long Entry: A close above 21,571.75 with volume confirmation would be a signal for a long position, targeting the next resistance.
Short Entry: If price fails to break 21,571.75 and starts to decline, a short entry could be viable with targets at 20,819.25 or 20,307.25.
Risk Management:
Stop Loss: For long entries, place a stop loss below the last significant support. For short entries, above the last resistance.
Take Profit: Adjust according to the identified support and resistance levels.
Asia Killzone 24.1.25After price reacted at h15 Bisi, after taken the Sellside Liquidity at 1min.
Typical Po3

Quick Trade Idea with some Mental NotesSharing my personal trading journey and emotions here with you guys. I've been working on passing this 53K challenge and have been getting stuck mentally these past few days but best believe we are working through it. I am also a big believer that we are learning deeply very fundamental information these days through our losses and mitigation of these losses.
🚨 Risk Disclaimer and Disclosure
Trading futures and other leveraged instruments involves significant risk and is not suitable for all investors. This video is for educational and entertainment purposes only and should not be considered financial advice. Any trades or strategies discussed are based on my personal analysis and approach. Results are not guaranteed, and past performance is not indicative of future results. Always consult a licensed financial advisor and do your own research before trading.
You are responsible for your own trades and financial decisions. By watching this video, you acknowledge that trading carries risk, and you should never trade with money you cannot afford to lose.

MNQH Continued Bullish Run On Friday price made a nice Bullish run that took out the PDH from the previous two days and price closed above the D LV and D SIBI. Currently we have price wicking off the D LV and has traded higher cutting through the MT level of the -OB. If price can stay above that MT level then I can see price going higher and taking out the PDH from Fri Jan 17 2025 at 21680.00 and then eventually target the PDHs from January 6th and 7th.
So lets continue to watch and see if price has truly switched to being Bullish after taking SSL, and finding support off the D BISI CE level.
