MOEX
Daily MOEX Russia stock market Index forecast analysis22-Jul
Price trend forecast timing analysis based on pretiming algorithm of Supply-Demand(S&D) strength.
Investing position: In Falling section of high risk & low profit
S&D strength Trend: In the midst of a downward trend of strong downward momentum price flow marked by temporary rises and strong falls.
Today's S&D strength Flow: Supply-Demand(S&D) strength flow appropriate to the current trend.
View forecasts shape of candlestick 10 days in the future: www.pretiming.com
Forecast D+1 Candlestick Color : RED Candlestick
%D+1 Range forecast: 0.3% (HIGH) ~ -0.6% (LOW), -0.2% (CLOSE)
%AVG in case of rising: 0.7% (HIGH) ~ -0.3% (LOW), 0.4% (CLOSE)
%AVG in case of falling: 0.2% (HIGH) ~ -0.8% (LOW), -0.5% (CLOSE)
Long futures USDRUB, 1D, June, 4. Close position on June, 8.Trend analysis with ADX and oscillator analysis with MACD of the MOEX futures price on USDRUB indicates the position to buy the pair on June, 4 and close the position on June, 8. ADX analysis shows D+ (green) > D- (red) meaning the bullish trend supported by the MACD analysis, where MACD fast (blue) crossed MACD signal (orange) from below.
On June, 8, D+ (green) can cross D- (red) from above. The situation D+ < D- suggests selling the asset.
Also, MACD fast (blue) can cross MACD signal (orange) from above signalling the trend change.
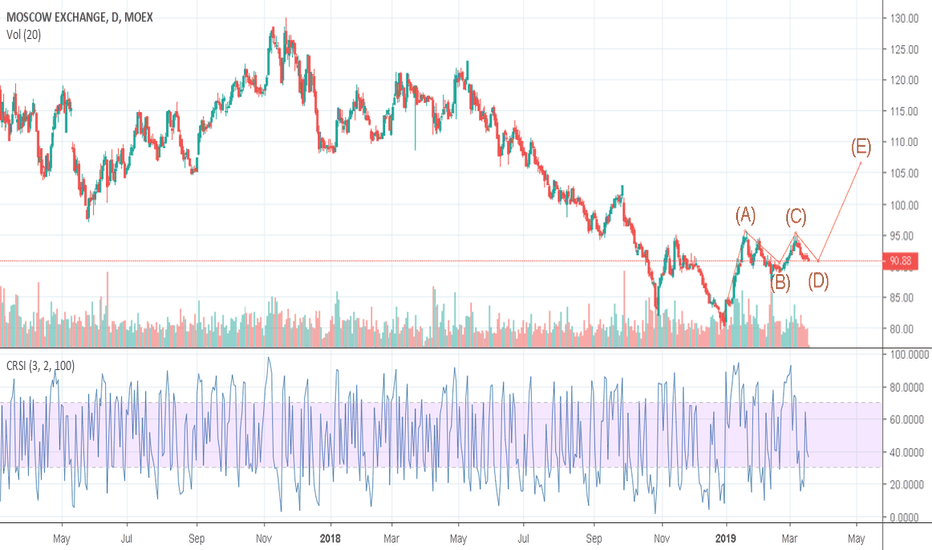
MOSCOW STOCK EXCHANGE (MOEX) DAILY TIMEFRAME SHORTThis market is clearly bearish as shown by the lower highs and lower lows, with ranging tendencies as the price consolidates between the 94.71 resistance level and the 80.25 support level. Traders should look for potential sell entries close the 94.71 zone. The price could potentially form a triple top formation on the 4 hour timeframe. Keep your charts clean and save your soul from clutter.
Annual MOEX Index PlanMany analysts agree with the relationship between this index and crude oil, honestly I am not a specialist in the subject but I will give myself the task of investigating more about this.
For now this is what my chart indicates.
This is an idea purely for study purposes, the intention of making it public is to have it open to comments or points of reference for other users.


