IFCI Giving a Strong BreakOutIFCI Ltd. operates as a non-banking finance company, which engages financing activities that cover various projects. It supports projects such as airports, roads, telecom, power, real estate, manufacturing, services sector and such other allied industries.The company was founded on July 1, 1948 and is headquartered in New Delhi, India.
Stop-Loss: 65
Target: 85
Consider exiting half your position after a 10-12% gain and hold the rest to capture the trend.
Disclaimer: This information is for educational purposes only and should not be construed as financial advice. Always conduct your own research or consult with a professional advisor before making any investment decisions.
Momentumbreakout

ENGINERSIN giving a good BreakoutEngineers India Ltd. engages in providing engineering, technical, and consultancy services. The firm operates through the following segments: Consultancy & Engineering Projects and Turnkey Projects. The company was founded on March 15, 1965 and is headquartered in New Delhi, India.
Stop-Loss: 268
Target: 350
Consider exiting half your position after a 10-12% gain and hold the rest to capture the trend.
Disclaimer: This information is for educational purposes only and should not be construed as financial advice. Always conduct your own research or consult with a professional advisor before making any investment decisions.

BPCL: Gearing up fly high - Know Why!Daily Time Frame:
Key Points:
Breakout Confirmation: The stock has decisively moved past its 4 years long resistance, confirming the breakout.
Volume Surge: Accompanied by high trading volume, indicating strong market interest.
Target Potential: Eyeing a 50% upward move based on technical analysis.
Why This Matters:
Momentum: Breakouts like this often lead to sustained trends.
Opportunity: Ideal for traders looking for growth stocks with strong technical setups.
- Above 620 it will start to shoot and also EMAs have confirmed the bullish trend continuation.
- If you have liked my chart reading and analysis, don't forget to leave a comment and boost the post.
- Wish you all a profitable trading journey. Cheers!
Disclaimer: This is NOT a buy/sell recomendation. This post is meant for learning purposes only. Please, do you due diligence before investing.
Thanks & Regards

EMAMI LTD Have Broken & Sustaining at 6 Years High
Zandu Balm Mal.... Kaam pe Chal ...
Company is almost debt free.
Company has delivered good profit growth of 19.2% CAGR over last 5 years
Company has a good return on equity (ROE) track record: 3 Years ROE 33.1%
Consolidated Net Sales at ₹ 881 crore grew by 8%
Revenue from Operations at ₹ 891 crore grew by 7%
Domestic Business grew by 8% (Volume growth of 6.4%)
International Business grew by 8% (Constant currency growth of 9%)
Gross Margins at 65.8% improved by 270 bps
EBIDTA at ₹ 211 crore grew by 6% despite 39% higher investments in A&P
PAT at ₹ 149 crore grew by 3%

TRIL Showing Again Bullish Mood at All Time High ZoneCompany has reduced debt.
Company has delivered good profit growth of 57.2% CAGR over last 5 years
Most preferred Indian Brand, known for manufacturing High Voltage Transformers viz. 220 kV 400 kV, 765
kV, 1200 kV indigenously
❑ Expertise in designing and manufacturing transformers from 5kV up to 1,200kV voltage class
transformers and from 0.5MVA to 500MVA capacity; thereby having presence across the value chain
❑ Manufactures entire range of transformers viz. Power, Distribution, Furnace, Rectifier Transformers &
Shunt Reactors, creating a unique positioning for itself in the transformer industry
❑ Supported by backward integrated manufacturing facilities housed in Gujarat
❑ International presence in 25+ countries
New Order Received during the year ₹ 2,050 crore
Order from Solar Power Plants:
❑ Received order for Solar Power Plants for 4 nos. 250 MVA 2x33 kV/400 kV from a reputed EPC Company
❑ Received order for 8 nos. 315 MVA 2x33/400 kV from a Maharatna PSU
Order from Private Sector Industry:
❑ Received maiden order for 400 kV Single Phase Generator transformers of 6 nos. 210 MVA from a steel plant
Order from Metro Projects/ Railways:
❑ Received order for Delhi Metro (DMRC) and Chennai Metro Projects
Order from Central Power Utility:
❑ Received order for 72 nos. Transformers & Reactors from a leading Central Power Utility in India
❑ Received order for 2 nos. 250 MVA ICT from one of the PPP model Company
❑ Received order of 4 nos. 60 MVA Traction Power Transformer (Scott Connected)
❑ Received an order of 220 MVA EAF transformer for Exports to be used in steel melting application, it
is second biggest rating in the world. Unit to be export in Q1FY25.
Other Achievements:
❑ Successfully tested the most stringent Dynamic Short Circuit test on multiple transformers of various voltage
ratings. With this company has crossed a commendable milestone of successful Dynamic short circuit test on
a record 150 plus transformers in last two decades.
❑ Technology for 765 kV class shunt reactors has been fully absorbed
Q4FY24 revenue ₹ 500 crore; FY24 revenue ₹ 1,273 crore
❑ Q4FY24 EBIDTA ₹ 65 crore; FY24 EBIDTA ₹ 129 crore
❑ Q4FY24 EBIDTA margin 12.9%; FY24 EBIDTA margin 10.0%
❑ Revenue improvement due to faster execution of major orders, better production planning, improved
receivables, internal control systems, etc.
❑ Export Contribution as a % of Revenue 11%
❑ Average monthly collection from customers during H2FY24 was Rs.144 crore which indicates stringent
internal controls systems in place.
❑ Tailwind to continue & company expects much higher profit margins in years to come.
“

A positive view - Let's Bear up Let's go back in while, price seems to be rejecting at resistance level back in 2018.
we see a huge fall after 2018 falling as far as 79%, price is rejected at support which was formed back in 2014-2015.
Moral of the story : we check history to forecast present!!
Some Ethics :
1. resistance breakout after long span of time (3 years)
2. target identified as the previous range between S\R levels
3. 346-357 was the resistance range since 2018 may act as strong support in upcoming event
4. I used super-trend to check if price continuation persist on same level
Marking multiple levels based on previous rejection and price retest
1. 628.05 - 659.90 as resistance range
2. 515.85 - 551 as support range
3. recent rejection from 446, price hits target of 515 which was it's previous support (acting resistance level)
4. With the rejection on resistance we also see a shooting star formation of approx. 4% with which we consider a fall with size of candle.
5. But, in last session we saw a momentum, price peaked up but did not resist at resistance and fell by 4.7%
If we consider previous S\R levels on basis of fall and rise, we can assume that it may fall by more 3-4% and we may see short covering at this level @ 483 and may see upper levels of 515 to 551.
Personal views only, please do your own research ->
Let's see if movement goes along

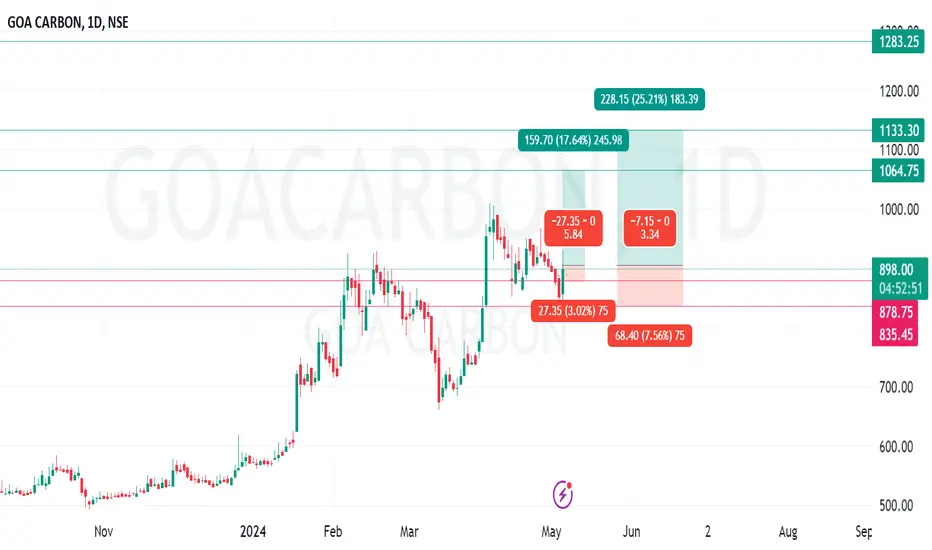
#GOACARBON
Company has reduced debt.
Company has a good return on equity (ROE) track record: 3 Years ROE 35.2%
Extensive experience, reputed clientele and established t rack record of operations
in the CPC segment
GCL is a part of Dempo Group, which was established in 1941. The group has diversified
operations with a presence in Iron Ore mining and exports, Construction, Publishing, Ship
Building, Travel and Trade, among others. GCL has more than five decades of track record in
the production of CPC and hence has an established market position amongst the leading
producers of CPC in India. The chairman of the company, Mr. Shrinivas Dempo has an
extensive experience of over three decades in the industry. GCL caters to reputed
companies among the Aluminium Industry, Graphite Industry and Steel Industry which includes
Hindalco Industries Limited (HIL), Vedanta Aluminium Limited (VAL), The Kerala Minerals and
Metals Limited (KMML), Steel Authority of India Ltd (SAIL) to name a few. GCL has also
healthy relations developed over a decade with the various global raw material suppliers
such as Kuwait Petroleum Corporation, Oxbow Carbon & Minerals LLC, Mitsubishi Corporation
Limited among others.
Acuité believes that the established position in the industry and healthy relations with both
customers as well as suppliers will help the company to maintain a stable business profile in
the CPC segment.
Improvement in business risk profile
The business risk profile of the company witnessed improvement reflected by growth in
revenues during FY2023 and 9MFY2024. The revenue from operations of GCL improved to Rs.
1364.36 Cr. in FY2023 against Rs. 766.12 Cr. in FY2022. Further, the revenues
during 9MFY2024 stood in similar range at Rs. 606.42 Cr. The surge in the demand of
aluminium while tightening of its supply marked by geo-political issues and consequent
sanctions on Russia, which contributes almost 6 percent of the global aluminium supply, has
resulted in an implicit effect on the pricing of CPC. The average selling price of the CPC
during FY20-21 stood at around Rs. 22,000 per metric tonne which grew to Rs. 42,000 per metric
tonne in FY21-22, while as on 9MFY23 the average selling price stood as high as Rs.77,000 per
metric tonne.
Acuité believes that GCL’s operating performance is susceptible to the changes in pricing of
CPC and the same will remain critical for its future growth.
#GODREJAGRO
Company has been maintaining a healthy dividend payout of 51.6%
Debtor days have improved from 37.4 to 22.4 days.
Company's working capital requirements have reduced from 58.6 days to 46.1 days
Strengths:
Diversified business presence: The company’s focus on diversification into newer segments such as palm oil, crop protection, dairy and poultry over the past 7-8 fiscals in order to lower its concentration in the animal feed business (revenue contribution down to around 49% for the first nine months of fiscal 2024 from 80% in fiscal 2012) supports its overall business risk profile and provides cushion against slowdown in any business segment.
In the first nine months of fiscal 2024, overall revenue saw modest growth of 2% year-on-year, largely on account of healthy volume growth in most of the business segments, apart from the business under the subsidiary, Astec Lifesciences, which faced competitive pressures for its key enterprise products. The volume growth was offset by negative or modest expansion in realisations, especially in the palm oil, poultry and animal feed segments, leading to a muted revenue growth.
Operating margin, however, improved on a year-on-year basis, to 7.7% for the first nine months of fiscal 2024, as against 5.7% for fiscal 2023, backed by lower input prices in dairy and poultry segments and higher operating levels in the animal feed and crop protection segments. The improvement in operating margin was the highest in crop protection segment, supported by strong volumes and realisations in the in-licensed product portfolio, apart from the dairy segment where operating margin improved substantially, on the back of lower milk procurement prices and operating efficiency, from operating losses seen last year. On the other hand, operating margin declined in the Astec Lifesciences segment, as it faced continued price erosion and subdued demand for its key enterprise product, despite robust performance by its contract manufacturing segment.
Dominant position in the domestic animal feed and palm oil segments: GAL enjoys a dominant position in the domestic organised animal feed industry with presence across various sub-categories such as cattle, broiler, layer, fish, shrimp and other feeds. The company's efforts are driven by research and development to achieve cost leadership and competitiveness, which have supported its volume growth. The segment continued to see traction across sub-segments, especially in cattle feed and aqua feed, during the first nine months of fiscal 2024.
Being the second largest consumer of palm oil in the world, India’s demand for domestic palm oil is expected to remain robust. The segment registered compounded annual growth rate of 16% over the eight fiscals through 2023, with healthy operating margin of above 19% over the period. Strong volume growth expected over the medium term, along with the longer shelf-life volumes coming from company’s newly set up oil refinery, would help keep operating margins healthy.
Strong financial risk profile: Financial risk profile remains strong as reflected in gearing of 0.48 time as on December 31, 2023 and interest coverage of 7.55 times in the first nine months of fiscal 2023, versus 0.44 times and 5.62 times, respectively, as on December 31, 2022. Debt levels declined slightly to Rs 1,203 crore as on December 31, 2023 from Rs 1,321 crore as on March 31, 2023. Debt levels are expected to remain range-bound over the medium term on the back of strong cash accruals from the business, despite the capital expenditure (capex) plan and working capital requirements, because of which the overall financial risk profile would remain comfortable.
Strong financial flexibility from being part of the Godrej group: GAL enjoys strong financial flexibility being part of the Godrej group and has the ability to raise debt at competitive rates and on short notice. It is able to directly derive implicit benefits being part of the Godrej group and without a formal arrangement of support with the parent, group companies or promoters.

#COALINDIA
Company is almost debt free.
Stock is providing a good dividend yield of 5.11%.
Company has a good return on equity (ROE) track record: 3 Years ROE 51.8%
Company has been maintaining a healthy dividend payout of 51.8%
New Projects 9MFY24
1 Environmental Clearance : EC has been obtained for 14 Proposals (Incremental EC Capacity of 9.85 MTY).
2 Forest Clearance : 1 proposal of wild life clearance (121.58 Ha) has been secured.
3 CIL has approved 5 Coal Mining Projects with a total capacity of 60.04 MTY and incremental capacity of 33.24 MTY.
Solar Power Generation
Aim to set up 3GW capacity of solar power projects to become net-zero by FY 25-26. CIL intends to add another 2 GW of renewable energy, aiming for a total installed capacity
of 5 GW.CIL is also participating in PAN-India Solar tenders of GUVNL, SECI etc to achieve the target of 5 GW. CIL has entered in an MOU with Rajasthan Rajya Vidyut Utpadan Nigam Ltd to develop Solar Power Project at Solar Park in Rajasthan.
Strategic Focus
The company aims to produce 1BT of coal by FY 2025-26.

UNI - FollowupCRYPTOCAP:UNI
A follow-through on the trendline pointed out before to the range mentioned before.
But most importantly, look at that sexy momentum volume

ABNB (Long) - end of the choppiness? Looking at my past track record, I am becoming somewhat of a fanless guru hahah - I better knock on some wood; otherwise the market goods give me a losing streak like I have never seen. However, it is nice to see how these age-old rules coupled with some patience work. Anyways, enough of bragging and lets get to the trade
Fundamentals
The market is disgustingly overbought , so this trade is on only if the NASDAQ:ABNB earnings deliver
Overall, right now, I would only purchase stocks that have already posted blockbuster earnings, otherwise I am in expectations of a pullback that should last at least a couple of weeks (c. 2-4)
Considering how ridiculous are some valuations getting in the market, ABNB is actually priced quiet reasonably, almost conservatively
The company is pretty much printing money with a net profit margin of 58% (up from 20% a year ago) ,which is, honestly, incredible, hence the P/E of 'only' 18
The earnings have grown by 253% yoy, and the revenue is steadily marching higher
The firm is not bending under a pile of debt with a Debt/Equity ratio of 0.2 - so, no interest burdens
Technicals
Given that Airbnb is a famous and popular brand, it is almost shocking how badly the stock has been performing since the IPO, having moved basically nowhere
However, the chart has been putting in the work to build us a nicer a picture (an accumulating base) and we are nearing something that could potentially be a marvellous breakout, which is not incidentally coinciding with upcoming earnings
Throughout this whole period, the stock has been gradually being accumulated with almost no major distribution periods (check the indicator)
Indicators like MACD and Stochastics showing strong momentum
Trade
This part is a bit tricky - if the earnings disappoint, then the trade is probably off because the setup goes to sh**; if the stock shows strong earnings than we can probably expect a major pop, which means we will have to be chasing
But if you backtest strong earnings , you can see that it is worth chasing even a major earnings pop - the price tends to carry on performing strongly (e.g. NASDAQ:ARM , NYSE:PLTR etc. - from some of the recent examples)
'Meeting estimates' results that would barely move the stock is probably good, but I would wait a bit for more stock price action
If the stock pops, but there is no follow through - is usually a bad signal and should be watched out for
Follow me for more analysis & Feel free to ask any questions you have, I am happy to help
If you like my content, Please leave a like, comment or a donation , it motivates me to keep producing ideas, thank you :)

$CAKE - SET FOR 10X GROWTHCAKE has broken out of the weekly downward trend, with a big growth opportunity ahead in the next period!
Potential 10x
Targets:
4,8 $
9,8 $
25,9 $
BINANCE:CAKEUSDT
CRYPTOCAP:TOTAL2
! Not an advice - DYOR !

$FIL - PREPARES FOR A 7X LEAPFilecoin could be one of the winners of the next bull-run!
Potential 7x growth in the coming months
Targets:
9,8 $
21,2 $
53,5 $
BINANCE:FILUSDT
CRYPTOCAP:TOTAL2
! Not an advice - DYOR !

First Wave BioPharma $40 PT Upside potentialBefore the close of the year the Bio Pharma Sector started running wild. It doesn't surprise me why i'm drawn to this company with all the catalysts coming out. Recently with a PT 40 From Roth MKM.
The more you read about the news that comes from this company between CEO investor relations, Merger Deal with Immunogen and entering their phase 3 trial there is so much Upside potential.
Although short term there's a lot of turbulence in the 5.00-5.38 range if it can break and hold strong this stock can get there pretty quick.
Currently holding a Long position.
Trade Responsible,
#TradeTheWave 🏄🏽♂️🌊

AUDUSD Yearly Trendline BrokenHi Traders!
AUDUSD has broken its yearly trendline resistance as the bulls have taken over.
Here are the details:
The yearly trendline is now broken. Since the break and close above the 20 EMA, the price action has looked very bullish. Our plan is to buy the market dips by looking for an entry near the trendline resistance and an exit near the mid-year range resistance zone.
Preferred Direction: Buy
Entry Level: 0.66532
Stop Level: 0.65089
Target Level: 0.69418
Technical Indicators: 20 EMA
Please make sure to click on the like/boost button 🚀 as your support greatly helps.
Trade safely and responsibly.
BluetonaFX

Bullishness on USD pairs. USD/JPY looks good for long setup.Setup looking good for momentum outbreak. Once near term resistance level 137.826 being broken, likely to surge towards 146.69 level base on 1:1 wave.
Duration towards short term.
DYODD!

Infy - Retest, Basing, Momentum- Restest of 1st Trendline
- 0.5 retracement of the first wave
- Strong Momentum
- Enter Between 1500-1520, SL- 1420, T1- 1670, T2- 1820
- Major Resistance - Related to the event, Breakdown from base & Gap Down

APEUSDT SHORT This is not a financial advice
Conditions:
1. Fibonacci levels:✅
2. Bollinger bands:✅
3.Momentum:✅
4.Price action:✅
5.Volume:✅
6.1hr tf:✅
7.4hr tf:✅
8.1d tf:✅

Marathon Digital Symmetrical Breakout?Mara reached a new high and fell as expected. It started trading into a wide falling wedge out of a bullish uptrend. I would think other than Bullish if it was knifing down.
Found consolidation level at 17-17.60 area after double bottom bounce at 16.50ish and looking for a possible break to the upside out of a bullish symmetrical triangle.
With bit coin holding 30,000 level.
We could see it retest and/or reclaim $20 soon.
Trade Responsible,
#TradeTheWave 🏄🏽♂️🌊

LMT Looks BULLISHWith earnings coming up lockheed martin remains bullish and seems to have broke toward the upside out of consolidation. My immediate PT was for it to close gap at least around 475 area.
If LMT has a great earnings this can possibly test next resistance at 480 as its still trading and trending up.
Trade Responsible,
#TradeTheWave 🏄🏽♂️🌊

ENVX - Army Swiss Knife X FactorA Couple things to note is Enovix has been on a steady rise and has had bullish catalyst released. It's on the hook to hit the next leg. Lame pun for the Hook showing on the chart pattern
"The advanced silicon battery company said the deal is for it to produce commercial cells for use within U.S. Army soldier's central power source, called the Conformal Wearable Battery.
Enovix said the agreement moves the program toward full volume production. The cells will be used to build pre-production CWB packs." - MarketBeat
This launched the stock price to $19 ON JULY 6TH.
It helps that spy has been pumping making new highs. I feel it will rise in the next few weeks with spy being on an extreme bull run and ENVX following a similar pattern.
ENVX, RSI on close to oversold, Williams showing the stock is curling. ENVX is currently aligned with SPY and have the same exact pattern It may run up with SPY so long as it remains bullish.
Expect it to touch at least $25 but theres a lot of turbulance up there as thats where it's been consolidating in the past. General consensus PT is $38. Others have placed as high as $100.
has an average rating of buy and price targets ranging from $15 to $100, according to analysts polled by Capital IQ.
Trade Responsible,
#TradeTheWave

Virgin Galactic - SPCE outlook showing signs of strengthLooking a the SPCE chart from a birds eye view it shows the company is overdue for a run. For months it's been trading sideways. It almost looks like it's break out of an inverse head and shoulders pattern. Until recently a spike caused by bullish news sending the stock from around 4.04 to 6.50.
On the run up it rejected the 6.50 price and came back mid day to the 4.50 level. The Fixed range volume profile showed from 4.04 to 6.50 on the initial the point of control was shifted to 6.50 where most volume was traded at the top. It showed a new level of support based on the visible range volume profile after it was rejected in the 4.81 - 4.63 range which to me was a buy zone. Even if it drops a little bit im okay with the risk to reward ratio with calls out to July 7th.
I wanted to get in it but I wasn't going to buy in at the top. The visible range volume profile showed me that most the volume came from these price levels. The fixed So I took the trade and look for a momentum run up in anticipation of the commercial flight between june 27th and june 30th.
The blue horizontal lines represent my take profit levels with the first retesting the 6.50 level. If price moves agressive I'm looking for it to close gaps from the prior months. The closer to launch date I can see it running up because people don't want to miss the run and a lot of buying pressure should be coming in up to these dates. Not to mention there's another flight shortly after in July I believe if there are no delays.
We will see how this plays out. My calls don't expire until July 7th after the first flight if there are no delays.
Thanks for taking the time out to read this.
Trade responsible,
Jay
#TradeTheWave

USDCAD IS BOOMING POINTSignal Title: Breakout Signal
Currency Pair: USD/CAD
Signal Type: Buy
Entry Point: Break above resistance at 1.3535 AND RETEST
Take Profit: Targeting-1, 1.3555, TARGET-2 1.3645
Stop Loss: Set stop loss at below swing low
Timeframe: 4-hour chart
Rationale: The USD/CAD pair has been consolidating within a bullish pattern, suggesting a potential breakout. A break above the resistance level at 1.3535 would confirm the bullish momentum and present a buying opportunity.
Risk/Reward Ratio: 1:5 (Stop Loss: 50 pips, Take Profit: 250 pips)
Additional Notes: Monitor economic news releases and adjust stop loss levels accordingly to manage risk.
