BTC Momentum Gone? USD + VIX say so Hi
The question these days is how much momentum do we have left in the current BTC bull run, I would love to see a leg down so we gather enough momentum to open a weekly candle above 25k. As things stand right now, there is not much to the downside for both USD and VIX and this indicates that there is not much momentum for liquidity for risk-class assets such as BTC left. On the flip side both USD and VIX have a lot of room to the upside which is going to pull money out of risk-class assets and if that happens the TA on the BTC graphs wont do much good as the market is going to react accordingly. I will be closely monitoring this myself.
Comment and Share!
Momentumstrategy

BUY ISMT LTD AT 65-70. TARGET 140ismt very strong momentum. a decent buy in the range of 65-70.
target 140 in few months

Propelling the Coin: How Momentum at 80 Can Keep Stable Coins?In my view, once the momentum reaches 80, it often provides an upward push to the coin, helping to maintain it in a positive stage for a time, even though there have been expectations of a correction and speculation that the capitalization of stable coins is a bearish signal.

PANW - MyMI Option PlaysWe purchased CALLS for PANW going into yesterday's morning session around the $144 Price Levels as we noticed that PANW broke out of it's Longer-Term Downward Channel. After further analysis, we acknowledge the potential for $165-$168 while showing the potential momentum of breaking through the Expected Resistance around the $152-$153.
We expect to hold this as long as the stock continues to hold the current Blue Trend and for risk management, we would close out our trade and take those profits to purchase our long-term hold in the stock as it is still 28% off of it's $213.63 ATH and some headroom to move forward to the upside.
Will keep you guys updated and thanks for following us at MyMI!

GE: Strength Ahead of Earnings ReportThis old company struggled to reinvent after the banking debacle destroyed its consumer financing division. Older companies CAN reinvent and start a new life.
I'm showing the Weekly Chart first so you can see the support zone below and the strong resistance above, where the stock may head sideways for a time.
Around $67 is the high of a completed short-term bottom that provides strong support for the current price action.
The stock entered the strong resistance level of the Trading Range highs of 2021 - 2022 with what I call a "pre-earnings" run.
On the daily chart:
GE had a strong momentum run ahead of its earnings report. This was a pre-earnings run, which tend to develop 2-4 weeks ahead of the earnings release. The company is reporting Tuesday this week.
The strong reversal candle on Friday after 2 down days is also an indication that the report will be good.

$CAD - Patience $CAD - Interesting...
At this current moment of time we are in a range but - Pattern forming of Flag a break to downside of these ranges to confirm taking CAD towards 1.32/1.31 areas. Good R/R -However, if we break above the TL above 200 EMA would be your target.
Follow your own trade plan.
Trade Journal

100% target hit on $21621) Cup and handle
2) Ascending triangle
3) Price broke neckline
Entry on 12 Aug 2022
Currently sitting on almost 100% gain.

Aggressive Stuff 🔥If you want to check the aggression level of this crypto you can back test OR just look 4th Jan candle it's 20+ % up , crazy things like this happens only in cryptos, people who had traded yesterday with flow of trend they are joying in Heaven right now 😇

The Momentum of MomentumUtilizing oscillators to confirm trend continuations and reversals is a momentum traders’ bread and butter. You most likely have the RSI or MACD saved to your favorites, but have you ever considered analyzing the momentum of an oscillator itself? You would be surprised at what insights the momentum of an oscillator can show you. In this article, we will look at how the momentum of an oscillator can help parse out false signals and give you an edge in your decision-making.
Below is the BTC/USDT 15-minute chart, the True Momentum Oscillator (TMO), and a 50-day EMA. We have highlighted what appears to be a short-term double top, with a weakening oscillator momentum that failed to reach or exceed the previous level. The price consistently bounced around the 50-period EMA and had cleanly broken through with a retrace imminent. Whether you aim to trade the break of the EMA or the retrace and rejection, this appears to be set up for a potential short trade.
Now we take the momentum of the TMO and its signal line and plot those lines (purple and white). Another layer to this story suddenly unfolds. We can now see from the new momentum lines that this move to the downside weakened almost as soon as it began. There is now a clear divergence between the oscillator and its momentum lines. What seemed to be a solid short setup now has upside potential. We must now question our next move.
A few bars later, the price broke above the 50-EMA and quickly touched it one last time and is followed by a robust move to the upside. In the current market, it is easy to lean short. Eager traders might have taken the short only to be burned by the strong move against the desired trade. Adding the layer of the momentum of our oscillator helped us read between the noise. We had a better idea of where the next chapter could take us, or at the very least, we could avoid a risky trade.
This is just one example of how the momentum of oscillators can be another valuable tool in our technical analysis tool belt. This momentum offers a unique visual aid for making quick decisions when trading.

GBP /CAD TRADING IDEA Hello, traders
We have a bullish wave and a correction pattern
We expect another bullish impulse wave

Nifty last reading session of the yearFew days back we discussed important levels of nifty and what the moves nifty may give. Levels we discussed acted beautifully, also only 20 points was required to achived target.Keeping in mind since tomorrow will be the last trading session of the year traders should be extra careful. Tomorrow if 18155 level holds we could see targets of 18350 and if 18155 level is unable to hold nifty could reach around 18000-17900. Overall my view for Tomorrow will be bearish sentiment all because new years is round the corner then people tend to use more money around this time. Technicals is all bullish bdw.

Cumulative Returns Since Inception
"Control your draw-downs and your profit will take care by itself"


BPCL - Head & Shoulder pattern - 15% ROIAll details are given on chart. If you like the analyses please do share it with your friends, like and follow me for more such interesting charts.
Disc - Am not a SEBI registered. Please do your own analyses before taking position. This post is only for educational purposes and not a trading recommendation

GBPCAD long (EOD Strat)The CAD is bucking the trend as I have two Aussie trades which show the AUD strengthening. Whereas this trade idea is suggesting the CAD goes lower. Is oil on the way down too?
Nothing to do until we get triggered.


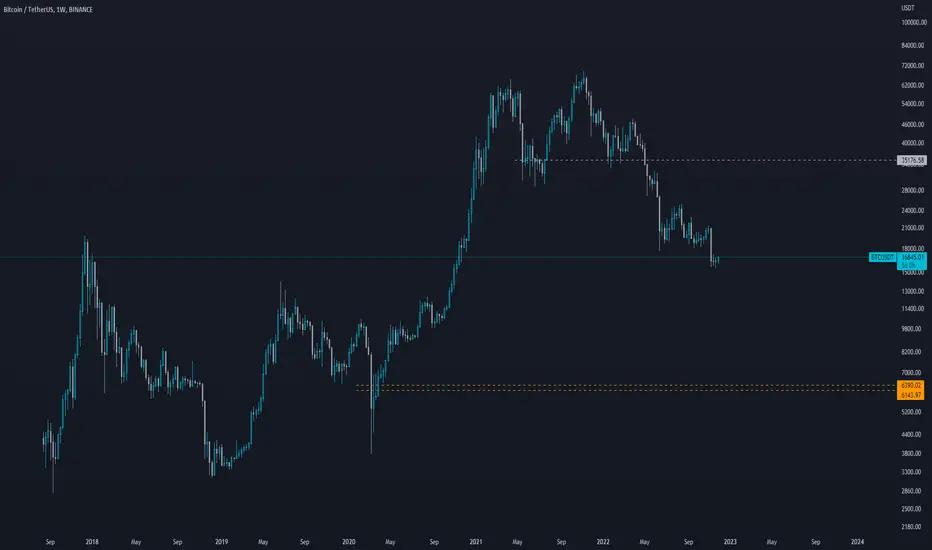
BTC Bottom TheoryTheory that im currently working with would dictate that we take out these previous lows before flipping momentum. Meaning there is significant amount of pain to come. I think if the casual traders in general had a better idea of what they were doing, than the market would find equilibrium easier. As it stands, there are too many easy targets out there with the ICT and "smart money concept" traders misunderstanding price action that the market just gobbles them up. Be careful out there folks, and good luck traders. I would say not to get truely macro long until this 7k level is swatted at the very least by a wick. Ideally these lows are taken out.
Bullish momentum weakening on Nas100usd. Possible shorts.The market has been rallying for about a weak now but less and less buyer's are committing to their positions as volumes drop when premium prices are advertised.
4031.6 is the last line of defense as liquidity is available 4042.6

EURGBP short set up© RBC
Euro area economics: Previewing next week’s key euro area inflation release
The November euro area ‘flash’ HICP estimate is published on Wednesday, with country-level data for Germany and Spain released on Tuesday, and data for France and Italy in advance on Wednesday morning.
Next week’s euro area HICP release is likely to be particularly significant, given market expectations that this month’s release could see the first drop in the y/y rate of HICP inflation since June 2021 (notwithstanding the marginal decline, only visible at 3 decimal places, seen in April). Market pricing currently points to a print of a little over 10.4% y/y, which would represent a 0.2% decline from the 10.6% y/y recorded in October.
Even if only small, a decline in the y/y rate of inflation would feed into the narrative that inflation in the euro area, as in the US (where CPI inflation is now down 1.4% from its June peak), has peaked and is now on a downward trajectory. Indeed a decline in the y/y rate could be viewed by the market as a validation of the current trajectory implied by market pricing, which sees headline inflation declining steadily throughout next year to end 2023 at just 2.8%. Conversely, another significant increase in inflation is likely to be interpreted as a sign that inflation is proving more persistent in the euro area than in the US.
---
Technical Analysis
EURGBP is notoriously choppy so taking the TP 1 and getting the rest of the position to break even is key. Lower inflation expectations will lead to a softening of the ECB's rate hike cycle and the euro can fall. That said the US dollar is also currently in a downtrend, so the EURUSD will likely keep the single currency supported against a lot of other currency crosses. For all of the talk of how badly the UK is doing since Brexit and due to the Pandemic, I see the war in Ukraine adding more pressure to Europe than the UK and economically the UK can do better. The OECD has the UK GDP growth since the 2019 dip above Germany and France, so that would help the technicals keep moving lower.

USDJPY bearsUSD/JPY: curve inversion taking over?
While the FOMC Minutes showed that a substantial majority of FOMC members
thought it would likely soon be appropriate to reduce the pace of rate hikes, they
also pointed to various members believing the terminal rate was somewhat higher
than previously expected. This rhetoric echoed that of Chair Jerome Powell in his
post-meeting press conference as well as other FOMC members since the
meeting. The Fed staff also saw the possibility of recession over the next year as
almost as likely as a baseline forecast. USD/JPY declined on this rhetoric and we
note that the US 2-10sY spread has dipped further and to -80bp as the risk of US
recession is seen as growing. While the US-Japan short-term rates differential
remains the strongest driver of USD/JPY according to our FAST FX model of the
exchange rate, the US-Japan box yield spread is beginning to have a larger impact
as the UST curve further inverts. With the market pricing in a Fed Funds terminal
rate of around 5%, there is significant risk of this pricing being forced to move
higher and take the USD/JPY along with it, however, especially if inflation remains
sticky to the upside. With the US on holiday for Thanksgiving, USD/JPY may
quieten down a little. Investors will be wary of the Tokyo CPI data on Friday and
any upside surprise in the data given its strong correlation with the nationwide
inflation data. Further modest acceleration in Tokyo inflation is expected, which will
place equally modest pressure on the BoJ to relinquish its YCC.
©Crédit Agricole Securities (USA)
As traders, we need to be aware of the lows from 15th November. A break through there and we have a much larger drop.

EURUSD bullsGerman PMI figures outperformed expectations, reaching 46.7, strengthening MoM by a value of 1.6 indexed. Whilst this is still firmly in contractionary territory for the German economy and the number of new orders remains heavily depressed, It was still a kernel of good news for Germany and the wider Eurozone. By the same token, Eurozone manufacturing PMI figures also exceeded expectations and suggested that the worst of the energy supply shock had subsided, the worst energy costs being seen in August and showing a slight decline as European nations reacted. This optimism was undoubtedly partly responsible for EUR/USD’s strong rally yesterday, EUR gaining 1% against the greenback in a days trading. ©Caxton
EURUSD is trending higher on the H1, so find a fundamental narrative that fits the price action :)

Nifty Analysis: A Bullish Scenario 🚀Hi 👋
There are always two potentially predominant scenarios possible in the stock market – Bullish and Bearish . Most people involved in the stock market like to read and appreciate the positive side of the market, that is bullish . This is because they always ‘Buy’ and never sell. They don't even sell to take profit 😉
This idea is representing the bullish scenario of the market. I have used minimal tools – Support and Resistance ; Fib Time Zones; Fib Extensions and a self-developed technique to weigh weaker and stronger sides (bulls & bears) of the market.
Let is discuss them one by one 👇
🚀 Fib Time Zones
Fib zones are helpful in analyzing market cycles but in my experience fib zones have always been a hit and miss experiment, as there is no concrete way in which fib zones can perfectly match the market cycles. Theoretically we match previous highs to project the next peek or we match previous lows to project the next trough in a market cycle.
On this chart I matched the highs of Feb 2021 and Oct 2021 and found that it perfectly projected June 2022 low (marked by Fib zone 3). If this projection is correct and continues then there could be a high (I am saying ‘high’ because we are discussing bullish scenario) near Mid Feb 2023 (Marked as Fib zone 4). This may hold true as long as market trades and sustains above all-time highs.
🚀 Support and Resistance
When I say all-time highs (ATH), it means 18600 ( ish ) levels. Normally these levels stand as strong resistance, because sellers get active taking profits or shorting near those levels. As of now those levels have not been tested by Nifty (spot).
Secondly, there was 18100 level which acted as strong resistance in Apr 2022 and Sep 2022. However, the reaction in Sep was much less compared to the reaction in Apr , which is good for bulls. In Nov, market breakout of this resistance and also tested it once in the later half of Nov.
The test was held, means buyers had an upper hand, and previous resistance (18100) acted as support. Eventually, market resumed the trend established from Jun 2022 lows.
I would personally like to see the market break and sustain above ATH (18600 or so) for it to achieve our projected targets.
🚀 Fib Extension
Fib extension is an effective tool to project markets next move or targets. There are different methods used by different traders or investors or mentioned by different authors in their writeups. Most popular ones being 1:1 extension, 1:2 extension and the ones that conform to the Elliot wave principles.
Measured move:
If I measure the move from Jun low to Sep high and project it for a 1:1 target, it gives us 19650 as the target. This can be taken as a medium-term bullish target for the market.
Elliot:
According to Elliot , 3rd wave can not be the smallest. If I take move from Jun to Sep 2022 as wave1 and late Sep correction as wave 2 then wave3 should be larger than wave1, that means beyond 19650.
Wave3 extension can go up to (1.618 x wave1) or higher. If I take 1.618 extension then wave 3 targets for 21450 (quite ambitious though). We can take it as a longer-term target for investors.
Cup & Handle
Thirdly, if you look carefully there is a cup and handle continuation pattern. This can be made by joining Apr high, Jun low, Sep high and Sep low. The blue Support and Resistance line shown on the chart would be the neckline for this pattern (and is breached positively). The target for this pattern comes out to be = 18114 + 15183 = 21045.
This gives us a zone from 21000 to 21500 as a target for long term investors.
Will the market hit the long-term target on Mid-Feb 2023 Fib zone? Or will it hit the short-term target 19650 at that time? This question should remain open for discussion in the comment section.
🚀 (Bravo) Momentum Technique
There is nothing much fancy in this technique than the Price and Time based analysis. I analyze price waves through the lens of time to measure momentum of the market.
Technical charts are drawn by taking Time on X-axis and Price on Y-axis and this helps in tracking the price moves. I take help of these price moves in identifying bullish and bearish trends.
As a general rule of thumb if the price is taking less time recovering a bearish move then there is bullish momentum. This means bulls are still stronger than bears. The opposite is also true. If price is taking more time to recover a corrective wave then bulls might soon lose ground.
To make it simple, I have drawn red and green rectangles. The red rectangles encase bearish waves and the green ones encase bullish waves. There are two important things that you need to observe – height and width of the rectangles.
Normally height of two adjacent rectangles ( bearish and bullish recovery waves) would be the same. So, it the width that is more important. The width represents the number of days the market takes to complete a wave.
As long as the width of green rectangles is less than red ones, the momentum would be bullish . Normally we see bullish momentum in an uptrend, so there are greater chances that the trend would stay on the upside.
The opposite is true in case of downtrend.
You can see in the chart that although the market was making lower lows from Oct2021 to Jun2022, the width of green rectangles is less compared to red ones. Or you can say that market had been taking lesser number of sessions to recover a down move. This means that bulls were more active and were interested in accumulation at the lower levels (see number of sessions/bars under each rectangle ).
This signals a positive momentum in an uptrend and hence higher chances of the trend to resume.
This method is useful for investors as well as traders. Investors can apply it on higher timeframes and traders on a lower-timeframes, for analyzing, confirming and riding trends.
I hope you learnt something new from this post.
Now do me a favor and hit 🚀 so that I can push myself to write more.
Your thoughts are welcomed in the comment section 👇
Have a great life 👍
📢 Disclaimer: The views are personal and for educational purpose only. It should not be considered as an investment or trading advice. Please apply your own due diligence before investing your hard earned money.

Momentum Buy at specific price 415-426Momentum Buy #MAXHEALTH (Max healthcare ) at specific price 415-426 range .
expected target 550-600.
stock breaking out of consolidation zone as well as maintaining its monthly momentum
