"MDLZ Heist LIVE! Quick Profit Grab Before Reversal!"🚨 MONDELEZ HEIST ALERT: Bullish Loot Zone! (Swing/Day Trade Plan) 🚨
Thief Trading Strategy | High-Risk, High-Reward Play
🌟 Greetings, Market Pirates! 🌟
Hola! Oi! Bonjour! Hallo! Marhaba!
To all Money Makers & Strategic Robbers 🤑💸—this is your blueprint to plunder "MONDELEZ INTERNATIONAL, INC" with precision.
🔎 THIEF TRADING ANALYSIS (Technical + Fundamental)
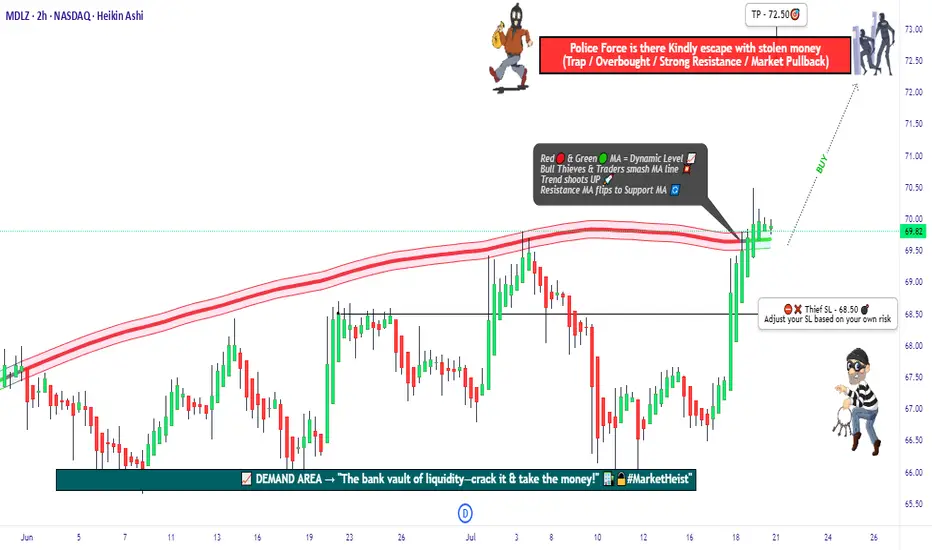
The Vault is Open! Bullish momentum detected, but caution—this is a high-risk police barricade zone (resistance level).
Overbought? Consolidation? Reversal? Yes. Bears lurk here, but we’re stealing profits before the trap snaps.
🎯 Target: 72.50 (or escape earlier if momentum fades).
🚨 Scalpers: Long-only! Use trailing stops to protect gains.
📈 ENTRY: How to Swipe the Loot
"Buy the Dip" Strategy: Optimal entries on pullbacks (15m/30m timeframe).
DCA/Layering Tactics: Spread limit orders for better risk control.
Aggressive Robbers: Enter now. Patient Thieves: Wait for retests.
🛑 STOP LOSS: Survival Rules
SL at 68.50 (nearest swing low wick on 2H chart).
Adjust based on risk/lot size—protect your capital!
⚡ CRITICAL ALERTS
📰 News Volatility: Avoid new trades during major releases. Lock profits with trailing stops!
📊 Fundamental Drivers: Check COT reports, macro trends, and sector sentiment Klick the 🔗.
⚠️ Reminder: This is NOT financial advice. DYOR and manage risk!
💥 BOOST THE HEIST!
Like 👍 + Boost 🔄 to fuel our next market robbery plan. Together, we trade smarter, steal bigger, and profit faster!
🚀 Stay tuned—more heists coming soon! 🤑🔥
Mondelez
Mondelez at the Edge: Can Bulls Hold the Line?A Pivotal Moment for Mondelez – Will the Bulls Step Up?
Mondelez International (NASDAQ: MDLZ) is trading at $58.05, clawing back some ground but still down 26.1% from its all-time high of $78.59. The stock has been oscillating near a critical resistance level at $58.40, testing the patience of both bulls and bears. Technical indicators suggest a market at a crossroads: the 50-day MA sits at $57.63, while the RSI hovers at 52.97, keeping the stock in neutral momentum. Meanwhile, Money Flow Index (MFI) remains weak at 38.09, signaling a lack of strong accumulation.
Adding to the tension, the last few sessions have flashed sell-heavy VSA patterns, with a significant increase in selling volume on January 31st. This raises an important question: Is Mondelez on the brink of a breakdown, or will buyers defend the $57 zone and push for a breakout above $58.40?
The answer may come from broader market forces. Inflation remains a key macro factor, and any shifts in consumer sentiment could dictate the next leg for Mondelez. Traders should watch for confirmation: if bulls fail to reclaim ground above $58.40, the path downward toward $56.50 support may accelerate. But if the stock finds strength, a breakout could set sights on the next resistance near $59.86 and beyond.
One thing is certain—this is a defining moment for MDLZ. Are you ready for what’s next?
MDLZ Roadmap: Tracing the Footsteps of Market Makers
Mondelez (NASDAQ: MDLZ) has been dancing on the edge of key price levels, with a series of Volume Spread Analysis (VSA) patterns defining its trajectory. The past few sessions reveal a battle between buyers and sellers, but the roadmap is becoming clearer. Let’s break it down.
January 27 – Sell Volumes Max: This pattern signaled an aggressive sell-off, closing at $58.37 from an opening of $58.595. Given the magnitude of the sell pressure, it was crucial to watch the next sessions for validation.
January 28 – Buy Volumes Max: A reversal attempt came in with increased buy volumes, pushing the stock up to $56.88 from a low of $56.68. This bounce hinted at possible accumulation, but the lack of follow-through kept the market on edge.
January 29 – Sell Volumes: Sellers regained control, pushing MDLZ to $57.13, marking another bearish shift. This played into the broader downtrend, reinforcing that buyers weren’t ready to step in just yet.
January 30 – VSA Sell Patterns Dominate: The day saw a series of manipulation-based sell patterns, with MDLZ closing at $57.695. These patterns typically indicate smart money positioning for further downside.
January 31 – Sell Volumes Max Returns: Another spike in sell volumes appeared, reinforcing the previous direction and closing at $58.00. This was a strong confirmation that the previous bearish signals were working.
Key Takeaways: The main direction has remained bearish, and each sell-based VSA pattern has been validated by subsequent price action. Bulls attempted a fightback on January 28, but weak follow-through suggested it was merely a liquidity grab. Until we see a buy pattern confirming with sustained upward movement, the path of least resistance remains downward.
MDLZ traders should keep an eye on support zones near $56.50, as breaking this could trigger further downside momentum. Will buyers finally step in, or are we looking at another leg lower? Stay tuned.
Technical & Price Action Analysis: Key Levels to Watch
Mondelez (NASDAQ: MDLZ) is moving in a tight range, and key levels are setting up for potential breakout or breakdown plays. Whether you’re scalping the swings or positioning for a bigger move, here’s what matters right now.
Support Levels: If buyers want to step up, they’ll need to hold $56.51 and $55.72—otherwise, expect them to flip into resistance, making the path even harder for bulls.
Resistance Levels: The first roadblock for upside sits at $58.40, followed by $59.86 and $60.71. If these levels don’t hold sellers back, expect them to become the next battle zone for bulls trying to break through.
Powerful Support Levels: The real lifeline sits way higher at $65.27 and $69.65—far from current prices, but if the stock ever reclaims these zones, the trend structure could shift bullish again.
Powerful Resistance Levels: The ultimate ceiling remains $75.68, but let’s be real—MDLZ has a long way to go before challenging that zone again.
If support fails, those same levels will be a brick wall on the next bounce attempt. Traders should be watching price reactions closely—levels don’t break without a fight, and smart money is always one step ahead.
Trading Strategies Based on Rays: Optimistic & Pessimistic Scenarios
The "Rays from the Beginning of Movement" method provides a dynamic approach to market structure, using Fibonacci-based rays to map out price movements. Unlike static support and resistance, these rays adapt in real time, helping traders react to the market instead of predicting exact levels.
Each price interaction with a ray indicates one of two scenarios:
Reversal – A bounce off a ray signals a potential turn in trend.
Continuation – A breakout or clean movement along the ray suggests an extension toward the next key zone.
Trade entries are only valid after price interacts with a ray and confirms movement in the expected direction. The first ray hit acts as the initial target, with subsequent rays marking extended take-profit levels.
Optimistic Scenario: Bulls Take Control
If price holds $58.40 resistance and breaks above, we look toward $59.86 as the next target.
If momentum continues, $60.71 becomes the secondary take-profit zone.
If buyers manage to push beyond $66.07, we could see a structural shift towards the powerful resistance zone at $69.22.
Pessimistic Scenario: Bears Regain Control
A rejection at $58.40 or a break below $56.51 signals downside pressure.
If sellers dominate, the next key level is $55.72.
A further breakdown could push MDLZ toward the $54.72 absolute low, a must-hold zone for bulls.
Dynamic Moving Averages as Confirmation
Moving averages (MAs) will play a key role in defining momentum:
50 MA at $57.63 – A flip above this level supports bullish continuation.
100 MA at $57.45 – A break below signals a short-term bearish trend shift.
200 MA at $57.33 – The ultimate line in the sand; a loss here opens the door for deeper declines.
Potential Trade Setups Based on Ray Interactions
Long on Break Above $58.40 → Target $59.86, Stop Below $58.00
Short on Rejection from $58.40 → Target $56.51, Stop Above $58.70
Long on Bounce from $56.51 → Target $58.40, Stop Below $56.00
Short on Breakdown Below $56.51 → Target $55.72, Stop Above $56.80
As always, these setups work in confluence with the VSA rays already mapped out. Each move from ray to ray defines a structured trade, and positioning should only occur after confirmation of movement.
Let’s Talk: Your Thoughts & Custom Analysis Requests
Trading is all about levels and reactions, and now it’s your turn—drop your questions in the comments! Let’s discuss how MDLZ moves next, and whether the price will respect these mapped-out levels.
Hit Boost and save this idea so you can check back later—watch how the market moves exactly along the rays. That’s the key to profitable trading: knowing where price action matters before it happens.
By the way, my private indicator automatically plots all rays and key levels, but it’s only available in Private Access. If you’re interested in using it—send me a message.
Need an analysis for a different asset? No problem! I can chart any market—some setups I post for free, while others we can arrange privately. If you have a specific request, let me know in the comments and hit Boost—I’ll do my best to include it in upcoming ideas.
And of course, follow me here on TradingView so you don’t miss future updates. Let’s trade smart! 🚀

MDLZ $72.00 - Don't Miss Out on This 18%NASDAQ:MDLZ announced it would like to buy NYSE:HSY which led to a drop to $60. The sell-off came with a high volume and an oversold RSI. The buyers were able to buy the stop up to $61.44 getting it into the support zone. The sell-off did also respect the current bearish channel we're in. From this point on we could see a little bounce or the start of a new bullish phase inside this huge sideways channel.
Our first target would be the resistance at $64.22. If we bounce from this we could see another leg down which is why we should take profit here and move the stop-loss to break-even. If the stock decides to use its momentum for more we could target the area at $73.00. We exit this trade if the stock closes on the daily chart with a candle below the support zone of $60.67.
Resistance / Target Zones:
$64.22
$73.00
Support Zone:
$60.67
Let me know what you think!

Food & Beverage Titans: Macro Fib SchematicsThe biggest food and beverage companies in the world consist of Nestle, Coca Cola, Pepsi, Unilever, Mondelez, Kraft Heinz, Tyson, and Hormel. These are the main ones but there are other ones as well. I have linked the rest in my other idea below. While it does not cover every single company in the group, it highlights the Main Titans of the sector.
I have shown their main products showing why they are the Titans dominating grocery stores. Especially thing like Pepsi and Coca Cola. Just for example, people do not know that they own many other brands and companies themselves.

Last cycle of Mondelez International ( Neowave Forecast)Hi Everyone
This another trading form US Stocks, This is an medium term forecast of Mondelez International. Currently its medium term bullish cycle is just started but it is the last leg. Therefore do not hold, wait or average if invalidation level is broke.
Thank You

Seeing a possible blow off on Mondelez. MDLZMondelez is in an upgoing zigzag. Just confirmed through passing the most recent high. I like to draw channels to guide my Fib projections and other things, never mind in this case that we are overbought - every single is situational. That is why trading is more than a science, but an artform.
We are not in the business of getting every prediction right, no one ever does and that is not the aim of the game. The Fibonacci targets are highlighted in green with invalidation in red. Confirmation level, where relevant, is a pink dotted, finite line. Fibonacci goals, it is prudent to suggest, are nothing more than mere fractally evident and therefore statistically likely levels that the market will go to. Having said that, the market will always do what it wants and always has a mind of its own. Therefore, none of this is financial advice, so do your own research and rely only on your own analysis. Trading is a true one man sport. Good luck out there and stay safe.
