$XMR (Monero) Swing Long Update +66% #MONERO #XMRSince our first call of $XMR back in March, we are currently up 66% in profits and we have hit our 2nd target! XMR is currently not following the rest of the crypto market having its own little bull run.
Monero

Nice weather up here! (MONERO/XMR) This is just a thank you to everyone who has been following me the last couple months through this Monero breakout... 🍾
We could definitely see a drop to retest 275 or even lower, however the overall positive trend since the end of Feb is bullish all around.
Definitely a bit of a celebration for me with how much passion I have for Monero, privacy tokens, and personal liberty in general. 🎉
♠️🤫🐿

Monero Price Analysis — April 20Unlike other cryptos, Monero has maintained a steady upward trajectory since its slump to the $132 low in late February. The privacy cryptocurrency has exhibited significant resilience by remaining unmoving during broader market bearish runs but following bullish waves.
That said, XMR tapped its highest level since November 21 on Monday after hitting the $270 mark but recorded a sharp correction to the $250 mark shortly afterward. However, the bearish correction appears to have run its course, as the cryptocurrency rebounded above the $260 mark in the early session on Wednesday.
I expect a retest of the $270 top, where my two-month-long channel top resides, over the coming hours, which should prompt a leg up towards $290.
Meanwhile, my resistance levels are at $270, $280, and $290, and my support levels are at $250, $240, and $230.
Total Market Capitalization: $1.92 trillion
Monero Market Capitalization: $4.7 billion
Monero Dominance: 0.24%
Market Rank: #32

Monero (XMR) back into the rainbow 🌈Monero still showing bullish signs. I wouldn't expect another all-out pump, albeit we can never be sure.
However, what I'm personally expecting as of now, is for Monero to bounce around inside this rainbow of parallel channels that I created way back during the big dip on the 2/24/22.
As long as Monero continues within this rainbow (which it has been doing now for almost 2 solid months), we are in good shape.
♠️🤫🐿

#Monero adds 90% From Q1 2022 Lows, Will #XMR Rally to $300?
Past Performance of Monero
Monero is stable in the previous 24 hours but up eight percent versus the USDT in the previous trading week. Technically, buyers are in control, adding roughly 90 percent from Q1 2022 lows. #XMR remains bullish above April 18 lows and the support line marked by the flexible 20-day moving average from the daily chart.
Monero Technical Analysis
Overall, #Monero buyers have the upper hand reading from the candlestick arrangement in the daily chart. Even though the uptrend's momentum appears to be slowing down, the inability of sellers to completely unwind the gains of April 18 and break below the $230 signal strength. As a result, traders may find entries on dips above $230 with an immediate target at $300. On another approach, risk-averse buyers can wait for a clean break above $270 before trading with the primary trend. If sellers press lower, losses below April 18 lows and, most importantly, the middle BB may entail a bear breakout, possibly driving XMR towards $185.
What to Expect from XMR?
Monero is firm to the upside, finding support above the middle BB. Based on the formation in the daily chart, XMR may float higher to $300 provided buyers sustain prices above spot rates.
Resistance level to watch out for: $270
Support level to watch out for: $230
Disclaimer: Opinions expressed are not investment advice. Do your research.


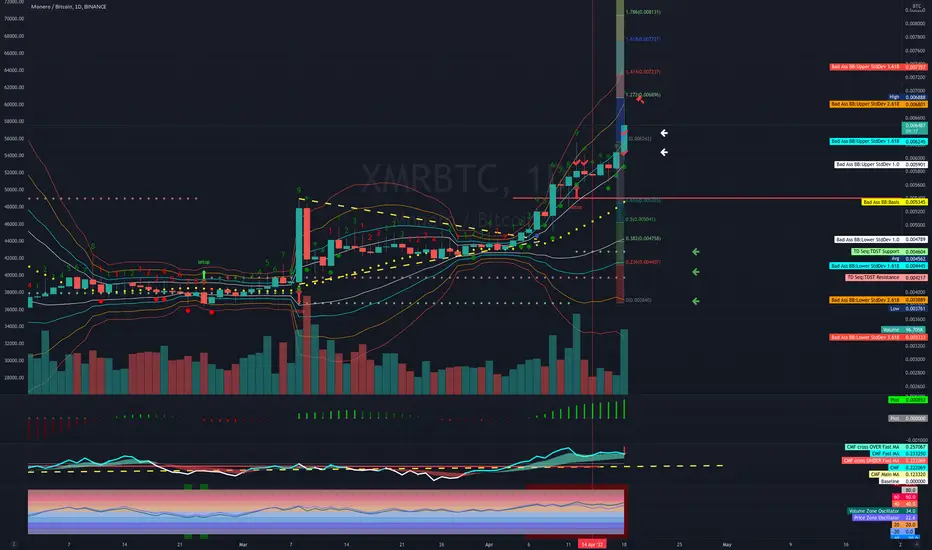
XMR Monero all the way up 12 Hour Chart
Tuesday 19th April
XMR BTC ripped up to the 1.272 Fib extension of 0.006896
Looking very positive but very overbought now
Watch for a pullback
Upper sell targets have been hit
Money flow looks like it is reversing, but this is a very positive move for privacy coins.
Maybe the Canadians and Russians have created new demand for these coins?
On the 12 hour we are on a TD 7 green count.

Monero all the way up!Tuesday 19th April
XMR BTC ripped up to the 1.272 Fib extension of 0.006896
Looking very positive but very overbought now
Watch for a pullback
Upper sell targets have been hit
Money flow looks like it is reversing, but this is a very positive move for privacy coins.
Maybe the Canadians and Russians have created new demand for these coins?
Golden Pocket Retracement to $380 for Monero! 🚀🚀🚀Hey Traders,
As you can see, the Weekly Candles of XMR (Xonero) reveal a Falling Wedge pattern via the bodies. After a large downtrend, the 0.618 level from the peak to the trough is the most common retracement zone (AKA the Golden Pocket). The price breakout out of the falling wedge is also set near $400 (based on the first impulse-up move within the pattern). The ABCDE Elliot wave is not that accurate so it is just for show... Tp at $380
Another reason why XMR recently pumped is that an exchange had someone's balance on paper, not actually in reserves. So someone with a very large amount needed to withdraw so the exchange bought the XMR all at once in order for the person to move it. This was a coordinated move by the Monero community to test the exchange's reserves which ultimately proved correct.
Safe Trading,
-Pulkanator

The beginning of the Monero rainbow... (XMR)This is a video that details where the path of this rainbow began.
It also just goes over how that whole ROYGBIV parallel channel thing can help anyone out in terms of indications, alerts, etc.

MONERO OVER THE RAINBOW!It never, ever gets old when you find out-- you were right .
XMR and here we ARE!
It's all happening, ladies and gentleman.
Daddy's buying a new pair of shoes. Still a chance to get in at a good spot here right above 250 with a SL of somewhere underneath 244... just sayin.

Monero XMR inverted head and shouldersMonero is showing another head and shoulders formation in the chart -- she's looking towards the sky...
"Sir.... we were cleared for style="color:#FFFF00">take off over an f'ing week ago, standing by at mandatory hold M-69-420 awaiting departure clearance." ... 🛫
🤞🏼 - 🙏
♠️🤫🐿

XMR vs BTC & NASDAQXMR, Monero seems to be decoupling from general crypto / NASDAQ trend since halfway March.
The desire for more privacy in currency gives this largest privacy coin in market cap a different trajectory different from the rest of crypto.

Monero breakout! (XMR) poised for a run!I realize that it is floppy Friday, (...and tax day for us stupid Americans) .
However, Monero has been continually making positive moves throughout this entire last bearish 10-14 days we've had with BTC and the rest of the crypto-verse.
I have been following Monero more closely than any other coin/token/currency that I chart.
I've been mining XMR using cheap CPUs since 2018, and have been heavily invested since fall of 2017.
I personally just sold all of my Ethereum and threw it into XMR. if anything... I'd be on the lookout
♠️🤫🐿

XMRUSD More rise ahead or pull-back to lows?Monero (XMRUSD) has been very strong since the February 25 Double Bottom as it almost reached the early January High. In doing so, it broke above the Lower Highs trend-line of the May 07 All Time High (ATH) and the 1D MA200 (orange trend-line). It is possible that within this month, it will form a 1D Golden Cross (when the 1D MA50 (blue) crosses above the 1D MA200).
The last time the price broke above such a long-term Lower Highs trend-line and formed a 1D Golden Cross after, was in early 2019 when Monero and the whole market was starting to recover from the 2018 Bear Cycle. The difference is that in 2019 it peaked just below the 0.5 Fibonacci retracement level after forming the Golden Cross, while now it has already come very close to the 0.5 Fib without having formed the Golden Cross. The question is, are we too soon or too late on the fractal?
The RSI on the 1W time-frame seems to support that we are too soon and there is still room to rise, despite having almost reached the 0.5 Fib already. Basically it looks quite a lot like the Golden Cross of May 2020, when the market was recovering from the March COVID flash crash. In both cases, the price always tested the 1D MA50 before rising any further and that is what we are expecting to happen here before a new rally to the 0.618 Fib at $307.00.
--------------------------------------------------------------------------------------------------------
Please like, subscribe and share your ideas and charts with the community!
--------------------------------------------------------------------------------------------------------

Monero (XMR) insanely undervalued!Throughout the last 7 weeks since the beginning of the geo-political turmoil, XMR has continued a steady, albeit slow, predictable rise through all manner of chop coming from BTC and ETH.
You can even see large parabolic downshifts in which -within a matter of hours, or a couple days- Monero returns to the exact same trend, as if nothing had ever taken place.
I am currently working on a video about this overall positive Monero trend going on; with that being said, Monero is incredibly undervalued right now.
♠️🤫🐿

XMRUSDT 🏹see and watch :)
The general trend is going on in an uptrend channel and in that uptrend channel a smaller downtrend channel is broken and we will probably have one of the two moves in question ...

$XMR (Monero) Swing Long Update +53% #MONERO #XMRWe have hit our first target for the $XMR swing with a 53% Profit! The trend is your friend, follow it. Congratulations to those who entered this long position!
We will hit our 2nd Target in time!

$XMR XMR/BTC Time to finally say "GM" to the Sweet Prince?I absolutely love everything about Monero. The absolute, undisputed king of privacy coins, the untraceable, fungible supermoney to back Bitcoin.
A dead God once told me that Monero is what Bitcoin should've been.
Together they (us) will win.
Monero is money
Bitcoin is gold
With that psychotic rant out of the way, Monero looks like it is primed for pumpin g. This is a retest of 20 October 2021 micro bottom, January-April 2021 cycle bottom, and eternal resistance of the early years 2014-2016 for resistance/support switch.
Possibility of higher low forming on the weekly.
XMR/USD has tapped ath, now crawling back. Normie catapults on.
Word of warning: Monero can be paper traded on exchanges at will. Should the eternal R/S fail, bail. Also, Monero is hated by the governments as it represent freedom from authoritarian control.
-DDD

Monero vs Tether Is Green For 7 Weeks...We have 7 weeks of bullish action for XMRUSDT (Monero vs Tether).
EMA50 was conquered after mid-March and we have everything bullish.
Bullish RSI, MACD trending up and the long-term downtrend that started in May 2021 is now gone...
Please check the XMRBTC trade idea...
We are looking for similar Altcoins to get through the storm.
Namaste.

Monero - shortShould dump.
First target on the screen, I assume - the move down is the wave B of a larger corrective structure.
Trade safe

XMR Additional ChartThe additional Bad Ass Bollinger Band 8 day chart for Part 4
Price volume oscillator.
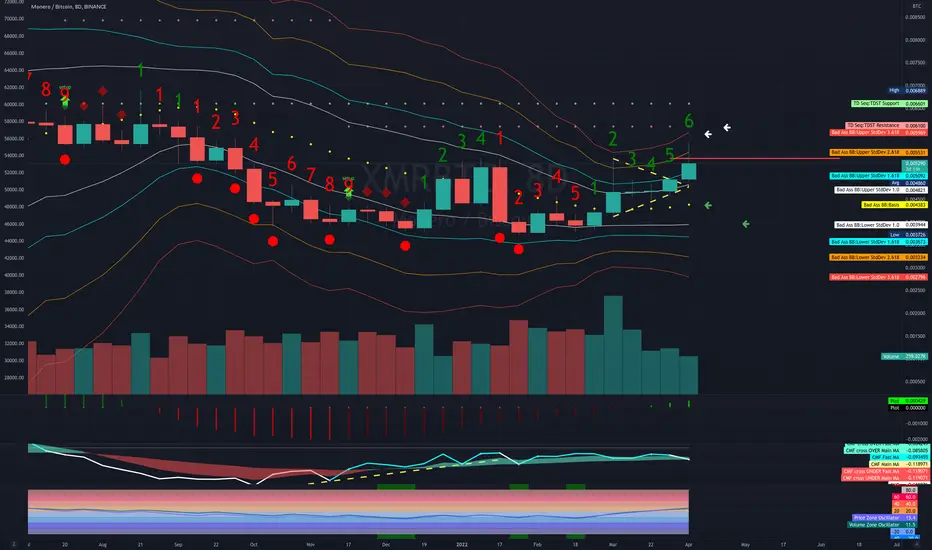
XMR - Monero / BTC Showing Signs of Life - Part 4-2The additional Bad Ass Bollinger Band 8 day chart for Part 4
Price volume oscillator.
