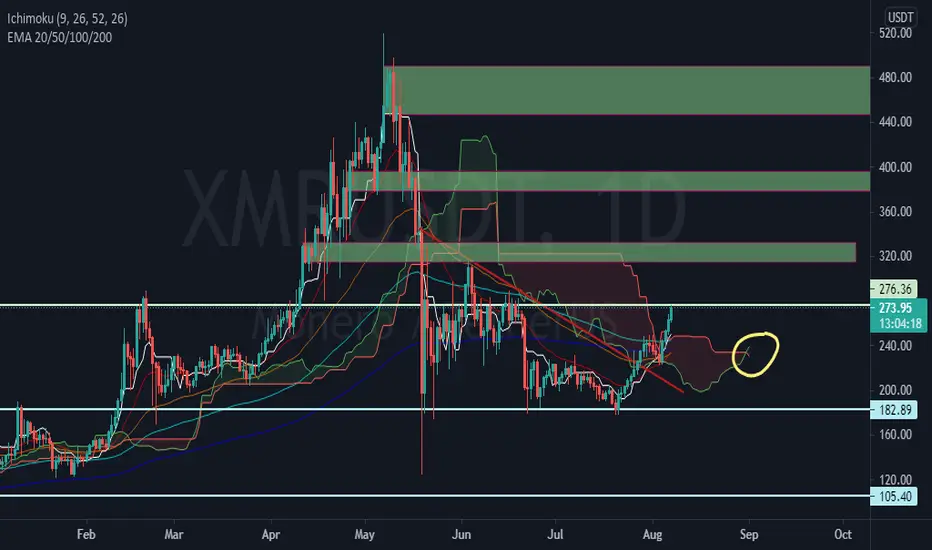
MONERO XMR LONG POSITIONSEE CHART
BULLISH MULTI CONFIRMATION
Potential bullflag
Potential bullish divergence formation
Multiple retest,
Trendlines
Potential cup and handle
rays are the tp.
Monerousdt

XMRUSDT Daily TimeframeSNIPER STRATEGY (new version)
It works ALMOST ON ANY CHART.
It produces Weak, Medium and Strong signals based on consisting elements.
NOT ALL TARGETS CAN BE ACHIEVED, let's make that clear.
TARGETS OR ENTRY PRICES ARE STRONG SUPPORT AND RESISTANCE LEVELS SO THEY CAN ACT LIKE PIVOT POINTS AND REVERSE THE WAVE (or act like a mirror that can reflects light) BASED ON STRENGTH OF THAT LEVEL.
ENTRY PRICE BLACK COLOR
MOST PROBABLE SCENARIOS TARGETS GREEN COLOR
LEAST PROBABLE SCENARIOS TARGETS RED COLOR
DO NOT USE THIS STROTEGY FOR LEVERAGED TRADING.
It will not give you the whole wave like any other strategy out there but it will give you a huge part of the wave.
The BEST TIMEFRAMES for this strategy are Daily, Weekly and Monthly however it can work on any timeframe.
Consider those points and you will have a huge advantage in the market.
There is a lot more about this strategy.
It can predict possible target and also give you almost exact buy or sell time on the spot.
I am developing it even more so stay tuned and start to follow me for more signals and forecasts.
START BELIEVING AND GOOD LUCK
HADIMOZAYAN

XMRUSDT Long Trade IdeaXMRUSDT Long Trade Setup after we saw a breakout from the Bullish Correction Pattern


Don't Sleep on FIROFIRO has some novel ideas for the implementation of privacy into crypto currency, some of which rival the privacy features of Monero. I think FIRO could potentially outperform Monero over the course of the next 3 years. Let's keep our eye on this one and look back at it in a year or two, maybe three.

Monero sell the breakdown.XRMUSD - Intraday - We look to Buy a break of 237.1 (stop at 230.9)
Daily signals are bullish.
Short term bias is bullish.
A break of bespoke resistance at 237.0, and the move higher is already underway.
We can see no technical reason for a change of trend.
Our profit targets will be 254.2 and 258.2
Resistance: 237.0 / 245.0 / 250.0
Support: 229.0 / 225.0 / 220.0

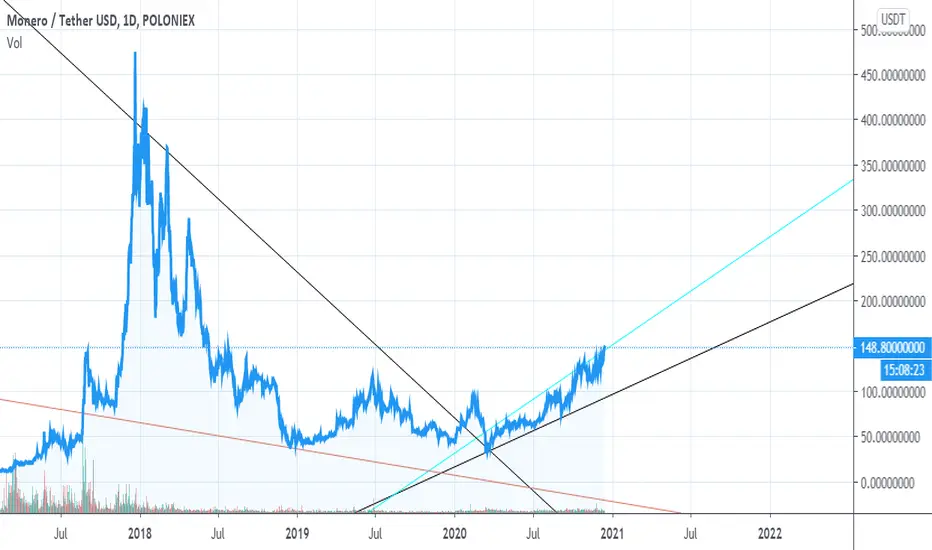
Monero and ETH - The TrendlineA new trendline can be drawn due to the recent bull rise in price, this includes the start of the initial bullrun, the middle of the bear market, and to right now. A common theme between ETH and Monero
A triangle can be drawn from the start of the initial bullrun to the trendline, and also another triangle can be drawn from the start of this bullrun to the trendline
Following this triangle the climb above started a ravenous bullrun in the initial scenario, is this going to occur again?
I am just observing and maybe have my charts skewed by the log scale but it does seem like a long term trendline
any feedback / personal observations would be nice
Bix

XMRUSDT Might Be at the beginning of an Uptrend @monero
Welcome back Traders, Investors, and Community!
Hi Traders, XMRUSDT has broken above the major Resistance, however the market is ranging now and I guess we would have a retracement at around 199.27 before we start a new uptrend. The price also may go back all the way down to retest the Resistance before it goes up.
⬆️Buy now or Buy at 199.27
⭕️SL @ 182.99
✅TP1 @ 222.66
✅TP2 @ 244.05
✅TP3 @ 274.92
We will have more FREE forecasts in TradingView soon
❤️ Your Support is really appreciated!❤️
Have a Profitable Day

XMR/USDT (BINANCE)Monero went on a bearish stretch, after the appearance of a Harami Pattern (marked on red) the price has began entering a correction phase where right now is going for a breakout possibly to the upper side, the price breaking above the moving average shows signs of a possible reversal happening, staying above that pink EMA200 indicates that prices has found support and demand. MACD shows momemtum to the upper side as the price keeps climbing. Stochastic still below overbought levels. Strongly suggest watching those 5min candles and 15min candles to get the most accurate information to confirm the breakout.


Monero 300$Everything is in Graph. Privacy is future, they can delist what they want, Monero not gives a shit. XMR already replaced BTC in the Darknet.
Buy zones for XMR are simples :
- if price fall between 100$ to 150$, you are in the green buy zone.
- TP is 299$
More simple than that i cannot be.
Happy Tr4Ding

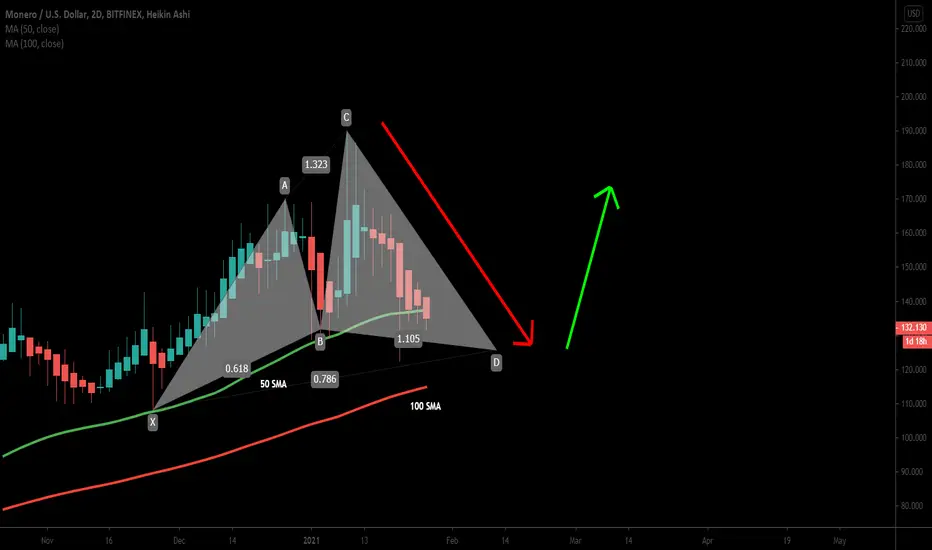
XMR formed Cypher pattern for upto 40.5% bullsih rally
Hi friends, hope you are well, and welcome to the new update on Monero.
On the weekly chart, the price action of the XMR has completed the final leg of bullish Cyhper and entered in the potential reversal zone. The price action is breaking down the 50 simple moving average but we have another good support of 100 SMA below the buying zone.
Possible profit and loss ratio:
This trade has a profit possibility of 40.5%, and the loss possibility is 10%.
Note: Above idea is for educational purpose only. It is advised to diversify and strictly follow the stop loss, and don't get stuck with trade.
For exact buy and sell targets for this trade, and other harmonic trading signals you can join:
www.patreon.com
MONERO DAILY CHART- To look for an opportunity in this currency I would wait for the rectangular area. If the price reaches this area, we will look for signs of a possible turnaround, such as an engulfing candle or a double bottom pattern.
- This area is a good investment opportunity, as we can have a great bullish run if the price goes for its historical highs. If the price turns in this area, we can also cover very easily with a stop losse in break even.

XMRUSDT completed Gartley move | Upto 11% expectedHi friends hope you are well and welcome to the new update on the Monero coin.
On the 4-hour chart, the price action of XMR coin has completed the final leg of bullish Gartley and entered in potential reversal zone.
Buying and sell ranges:
The buying zone starts from 0.618 to 0.786 Fibonacci levels, and the sell zone can be the Fibonacci projection between 0.382 to 0.786 .
Stop loss:
The maximum extent of the potential reversal zone at 0.786 Fib level can be used as stop loss.
Possible profit and loss ratio:
As per the above targets, this trade has a profit possibility of 11%, and the loss possibility is 3%.
Note: Above idea is for educational purpose only. It is advised to diversify and strictly follow the stop loss, and don't get stuck with trade.

XMR-4h. The price moves up to $175.Confidence, anonymity and anarchy are the concepts that characterize XMR .
The voltage of the whole crypto world does not affect this coin at all. Keeping the bottom trend line on December 21, buyers continued their clear growth trend. It seems that she was chosen to hedge losses. It is the last two 4-hour candles that have abnormally high volumes. This nature of the price movement should end with a test of $175.
_________________________
We create both short-term ideas (for a local understanding of the market situation) and medium-term forecasts of price movements.
Subscribe to us and get daily concise analytics!

XMRUSDT completing Gartley | A good long opportunity aheadOn the small time period 1 hour chart , the price action of Monero (XMR) is completing final leg of Gartley and soon it will be entered in potential reversal zone.
Buying And Sell Targets:
The buying and sell targets as per Fibonacci sequence of Gartley formation should be as below:
Potential reversal or buying zone: $154.74 to $154
Fibonacci projection or sell zone: $155.32 to $156.73
Stop Loss:
The potential reversal zone area that is up to $154 can be used as stop loss in case of complete candlestick closes below this level.
Possible profit and loss ratio:
As per above targets this trade has a profit possibility of 1.70% and as per the above-mentioned stop loss, the loss possibility is 0.48%.
Note: Above idea is for educational purpose only. It is advised to diversify and strictly follow the stop loss, and don't get stuck with trade.


XMRUSDT - own gameThe asset has its own game.
Pressing the level 140.
Global trend up.
Need consolidation under level.
And should expect a breakthrough up.
You will learn the best place where we can trade this instrument at low risk.
Write in the comments all your questions and instruments analysis of which you want to see.
Friends, push the like button, write a comment, and share with your mates - that would be the best THANK YOU.
P.S. I personally will open entry if the price will show it according to my strategy.
Always make your analysis before a trade

Monero breakings highs, aimed for $170!XMR is in 4h cup and handle bullish pattern, as you can see in this 4h chart,
XMR is in continues strong uptrend and has a strong potential to see another strong spike up to $170, before seeing a small correction.
If XMR daily candle closes above $132, it will be a clear daily bull signal.
MACD is giving a daily bull signal.
RSI is breaking previous highs.
Good luck!
Tibor

Daily close above 120 dollar for Monero is a clear long till 155All about the daily close, clearly making higherhighs and higher lows.

XMR MONERO BREAKOUT - EASY TARGET 70 XMRUSD XMRUSDT XMRBTCXMR MONERO BREAKOUT - EASY TARGET TP1 70
IF 70 BROKEN THEN TP2 82
