B3/USDT BREAKOUT ALERTB3 is showing strong bullish momentum with a confirmed breakout above resistance, signaling a potential trend shift.
📈 Breakout Level:
$0.00388 – Key resistance flipped into support on high volume ✅
🔑 Key Levels to Watch:
Immediate Support: $0.00388(former resistance)
Next Resistance: $0.0050 – psychological & technical barrier
📊 Volume Surge:
+150% volume increase = strong buyer interest
RSI approaching overbought – watch for consolidation or retest
🔁 Retest Zone:
If price pulls back, look for a bounce around $0.003187 to confirm continuation
🚀 Bias: Bullish above $0.0033
Keep an eye on market sentiment and BTC correlation
BINANCE:B3USDT.P
Moneymanagement

Protect Capital First, Trade SecondIn the world of trading, mastering technical analysis or finding winning strategies is only part of the equation. One of the most overlooked but essential skills is money management. Even the best trading strategy can fail without a solid risk management plan.
Here’s a simple but powerful money management framework that helps you stay disciplined, protect your capital, and survive long enough to grow.
✅1. Risk Only 2% Per Trade
The 2% rule means you risk no more than 2% of your total capital on a single trade.
-Example: If your trading account has $10,000, your maximum loss per trade should not exceed $200.
-This protects you from large losses and gives you enough room to survive a losing streak without major damage.
A disciplined approach to risk keeps your emotions under control and prevents you from blowing your account.
✅2. Limit to 5 Trades at a Time
Keeping your number of open trades under control is essential to avoid overexposure and panic management.
-A maximum of 5 open trades allows you to monitor each position carefully.
-It also keeps your total account risk within acceptable limits (2% × 5 trades = 10% total exposure).
-This rule encourages you to be selective, focusing only on the highest quality setups.
Less is more. Focus on better trades, not more trades.
✅3. Use Minimum 1:2 or 1:3 Risk-Reward Ratio
Every trade must be worth the risk. The Risk-Reward Ratio (RRR) defines how much you stand to gain compared to how much you’re willing to lose.
-Minimum RRR: 1:2 or 1:3
Risk $100 to make $200 or $300
-This allows you to be profitable even with a win rate below 50%.
Example:
If you take 10 trades risking $100 per trade:
4 wins at $300 = $1,200
6 losses at $100 = $600
→ Net profit = $600, even with only 40% accuracy.
A poor RRR forces you to win frequently just to break even. A strong RRR gives you room for error and long-term consistency.
✅4. Stop and Review After 30% Drawdown
Drawdowns are a part of trading, but a 30% drawdown from your account's peak is a red alert.
When you hit this level:
-Stop trading immediately.
-Conduct a full review of your past trades:
-Were your losses due to poor strategy or poor execution?
-Did you follow your stop-loss and risk rules?
-Were there changes in the market that invalidated your setups?
You must identify the problem before you continue trading. Without review, you risk repeating the same mistakes and losing more.
This is not failure; it’s a checkpoint to reset and rebuild your edge.
Final Thoughts: Survive First, Thrive Later
In trading, capital protection is the first priority. Profits come after you've mastered control over risk. No trader wins all the time, but the ones who respect risk management survive the longest.
Here’s your survival framework:
📉 Risk max 2% per trade
🧠 Limit to 5 trades
⚖️ Maintain minimum 1:2 or 1:3 RRR
🛑 Pause and review after 30% drawdown
🧘 Avoid revenge trading and burnout
Follow these principles and you won't just trade, you'll trade with discipline, confidence, and longevity.
Cheers
Hexa
$BNB Chart Showing Bullish Flag Pattern and Price Will Hit +$750CRYPTOCAP:BNB Previously Chart showing Bullish Inverse Head and Shoulder Pattern and Gain Profit of Range. It's a Reversal Pattern .
Now Chart Showing a Bullish Flag Pattern and it's Continuation Pattern. Time to Bullish for BNB Coin for FOMC 10th July Thursday 2025.
The upsloping 20-day EMA and the RSI just above the midpoint indicate a slight edge to the bulls. If the $665 resistance falls, the BNBUSD pair could rise to $675 and then to $698.
Sellers are likely to pose a solid challenge at $698 because a break above it could propel the pair to $732. I'm guess BNB Price Breakout of ATH and $888 Mystery will Happen.
This optimistic view will be negated in the near term if the price turns down and breaks below the moving averages. The pair may then drop to $636.
NEWSBTC: BNB Price Gears Up for Upside Break — Will Bulls Deliver?
BNB price is gaining pace above the $650 support zone. The price is now showing positive signs and might aim for more gains in the near term.
BNB price is attempting to recover from the $620 support zone.
The price is now trading above $655 and the 100-hourly simple moving average.
There is a key contracting triangle forming with resistance at $662 on the hourly chart of the BNB/USD pair (data source from Binance).
The pair must stay above the $655 level to start another increase in the near term.
BNB Price Eyes More Gains
After forming a base above the $620 level, BNB price started a fresh increase. There was a move above the $645 and $650 resistance levels, like Ethereum and Bitcoin.
The price even surged above the $660 level. A high was formed at $666 before there was a downside correction. The price dipped below the 50% Fib retracement level of the upward move from the $650 swing low to the $666 swing high.
The price is now trading above $655 and the 100-hourly simple moving average. On the upside, the price could face resistance near the $662 level. There is also a key contracting triangle forming with resistance at $662 on the hourly chart of the BNB/USD pair.
The next resistance sits near the $665 level. A clear move above the $665 zone could send the price higher. In the stated case, BNB price could test $672. A close above the $672 resistance might set the pace for a larger move toward the $680 resistance. Any more gains might call for a test of the $700 level in the near term.
Another Decline? If BNB fails to clear the $662 resistance, it could start another decline.
Initial support on the downside is near the $655 level and the 61.8% Fib retracement level of the upward move from the $650 swing low to the $666 swing high. The next major support is near the $650 level.
The main support sits at $644. If there is a downside break below the $644 support, the price could drop toward the $632 support. Any more losses could initiate a larger decline toward the $620 level.
Technical Indicators
Hourly MACD – The MACD for BNB/USD is gaining pace in the bullish zone.
Hourly RSI (Relative Strength Index) – The RSI for BNB/USD is currently above the 50 level.
Major Support Levels – $655 and $650.
Major Resistance Levels – $662 and $665.
#Write2Earn #BinanceSquareFamily #BinanceTurns8 #BNB #SUBROOFFICIAL
Disclaimer: This article is for informational purposes only and does not constitute financial advice. Always conduct your own research before making any investment decisions. Digital asset prices are subject to high market risk and price volatility. The value of your investment may go down or up, and you may not get back the amount invested. You are solely responsible for your investment decisions and Binance is not available for any losses you may incur. Past performance is not a reliable predictor of future performance. You should only invest in products you are familiar with and where you understand the risks. You should carefully consider your investment experience, financial situation, investment objectives and risk tolerance and consult an independent financial adviser prior to making any investment.

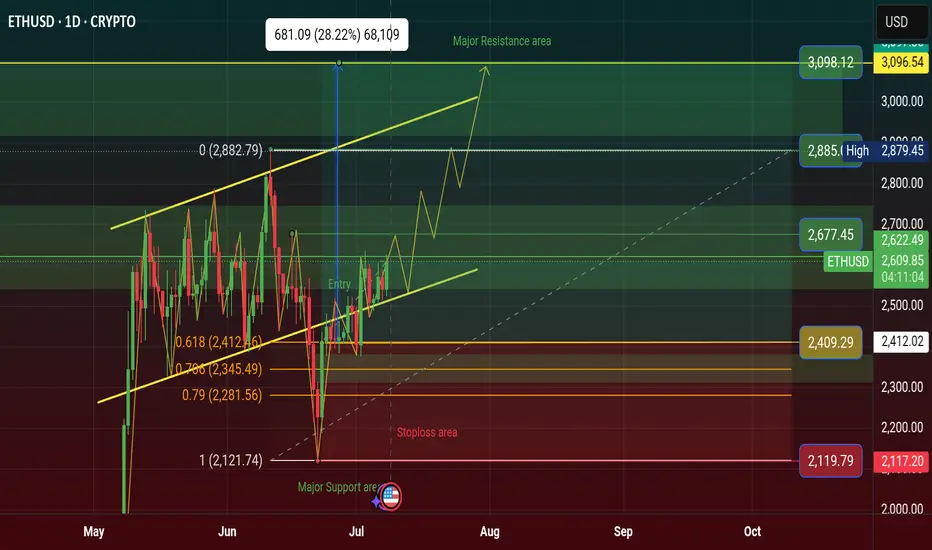
$ETH Price Will Rising $3098 in Q3, Bullish Flag Inverse AngleCRYPTOCAP:ETH price will Rising $3098 in Q3 in 2025, Price Showing a Bullish Flag Inverse Angle. it's a Reversal Pattern and Manipulation Price. See more on Chart.
Crypto News: An Ethereum address holding 900 ETH started moving coins Monday after spending nearly 10 years dormant.
The holder received these genesis coins in 2015 when ETH traded below 50 cents.
These pre-mined tokens were distributed to early Ethereum contributors before mining began.
Their current value reaches 2.2 million with ETH trading around 2,529 per coin.
This represents potential gains exceeding 5,000% from the original sub-dollar entry price.
The move follows similar whale activity, including a 27.6 million Ethereum sale in April.
Last week saw a Bitcoin whale move 8 billion after 14 years of hodling.
ETH remains 48% below its 2021 all-time high of 4,878 despite recent stability.
The holder technically isn't a whale, which requires a minimum of 10,000 ETH at current prices.
#Write2Earn #BinanceSquareFamily #ETH #SUBROOFFICIAL
Disclaimer: This article is for informational purposes only and does not constitute financial advice. Always conduct your own research before making any investment decisions. Digital asset prices are subject to high market risk and price volatility. The value of your investment may go down or up, and you may not get back the amount invested.
$SOL Price Will Hit $228 Q3, Inverse Head and Shoulder Pattern✨ CRYPTOCAP:SOL Price Will Hit $228 in Q3 of 2025 | Solana Chart Showing Inverse Head and Shoulder Pattern. It's a Bullish Reversal Pattern.
‣ Solana price is hovering below key resistance; a breakout above $159 and it's going to $228.
ETF Buzz Grows, but Price Action Still Caught in Limbo Here is why this could be the catalyst that sends price to all time highs Do THIS before that happens.
‣ Solana ETF Buzz Grows, but Price Action Still Caught in Limbo
🔸BlockNews The SEC has asked SOL ETF applicants to revise and refile submissions by end of July, fueling speculation of an ETF approval before October. Solana’s daily active addresses just hit a record 15.39 million, pointing to rising demand and user engagement on the network.
#Write2Earn #NFPWatch #BinanceSquareFamily #TrumpTariffs #SUBROOFFICIAL
Disclaimer: This article is for informational purposes only and does not constitute financial advice. Always conduct your own research before making any investment decisions. Digital asset prices are subject to high market risk and price volatility.

$LOT Price Showing Symmetrical Triangle Pattern & Breakout aboveASX:LOT is a League of Traders Trading Competition Platform. LOT is an Native token of this platform.
Every Trading Player Have LOT point and they convert to LOT token and get on there wallet. Who Join LOT Trading League for LOT point? The main competition is top level and get free price.
💡 TOKEN OVERVIEW ( ASX:LOT )
Market capitalization: 3.89 M USD
Fully diluted market cap : 25.90 M USD
Trading volume 24h: 2.89 M USD
All time high: 0.044869 USD
Circulating supply: 150.00 M
Max supply: 1.00 B
Total supply: 1.00 B
A new Native token Release on Binance Alpha and when it's release on Binance Coin than we will see more pumping this Native Token Price.
ASX:LOT price now at $0.026186 and this year 2025 I'm Prediction the price will be happened $0.45-$0.75 hit. If Biggest Tournament will start this year on this Platform. Than Possible to worldwide Tournament make more Pumping price. Because of the Big investor will become investment on this LOT native Token.
We have to decisions long-term investment this coin. The main thing is that some Coin will be scammed. But League of Traders Platform is the Legit of Cross Chain Trading Competition.
The Crypto Scammer will not Permission listed there token on the Top Exchange of Binance Market. #SUBROOFFICIAL
Disclaimer: This article is for informational purposes only and does not constitute financial advice. Always conduct your own research before making any investment decisions. Digital asset prices are subject to high market risk and price volatility. The value of your investment may go down or up, and you may not get back the amount invested. You are solely responsible for your investment decisions and Binance is not available for any losses you may incur. Past performance is not a reliable predictor of future performance. You should only invest in products you are familiar with and where you understand the risks. You should carefully consider your investment experience, financial situation, investment objectives and risk tolerance and consult an independent financial adviser prior to making any investment.

$BTC Price Showing a Bullish Flag Pattern & Breakout see chart..CRYPTOCAP:BTC Price Breakout of Bullish Flag Pattern. I'm guess it's going to the next Price Zone $115K and if Breakout thank going $122K price zone.
I was telling some coins that was saying Multiple Profit and now coins are driving on the way. There are coin is ETH, BNB, XRP, SOL, TRX, TON, SUI, ADA, ICP, ARB, XLM.
Ric Edelman Urges Up to 40% Crypto Allocation, Predicts Bitcoin Surge to $500K
Top advisor Ric Edelman recommends investors allocate up to 40% to crypto, forecasting Bitcoin could reach $500K with rising institutional demand.
Ric Edelman advises investors to allocate 10% to 40% of their portfolios to crypto, based on their risk tolerance.
Edelman predicts Bitcoin could reach $500,000 if just 1% of global assets shift into the cryptocurrency sector. His endorsement is viewed as a major TradFi signal, given his $300 billion asset management influence in the advisory industry.
Ric Edelman, the founder of Edelman Financial Engines and DACFP, has recommended investors shift a significant portion of their portfolio to cryptocurrency. In a recent whitepaper, Edelman advised allocating between 10% and 40% to crypto, depending on individual risk tolerance.
This guidance marks a break from the conventional 60/40 stock-to-bond portfolio model, which he believes is no longer practical in a rapidly advancing economic environment.
According to Edelman, conservative investors should hold 10% in crypto, moderate investors 25%, and aggressive investors 40%. He cited technological advancements and increased life expectancy as reasons to move away from traditional investment formulas. He emphasized that ignoring crypto means betting against an asset class that has outperformed all others over the past 15 years.
Bitcoin Price Could Hit $500,000 with Minimal Asset Shift
Edelman also presented a bullish projection for Bitcoin, suggesting it could reach $500,000. He explained that a 1% allocation of the $750 trillion in global assets toward Bitcoin would inject $7.5 trillion into the market. Based on current valuations, this inflow could significantly drive the asset’s price. He underlined this estimate as simple arithmetic based on supply and demand trends.
Edelman pointed to growing institutional interest and policy changes as key drivers for crypto’s rise. He highlighted that Tether, a major stablecoin, reported $13 billion in profits last year, surpassing companies like McDonald’s and Ford. He also noted that a pro-crypto political climate, especially following Donald Trump’s reelection, is setting favorable conditions for digital assets.
Disclaimer: This article is for informational purposes only and does not constitute financial advice. Always conduct your own research before making any investment decisions. Digital asset prices are subject to high market risk and price volatility. The value of your investment may go down or up, and you may not get back the amount invested. You are solely responsible for your investment decisions and Binance is not available for any losses you may incur. Past performance is not a reliable predictor of future performance. You should only invest in products you are familiar with and where you understand the risks. You should carefully consider your investment experience, financial situation, investment objectives and risk tolerance and consult an independent financial adviser prior to making any investment.

BTCUSD – Major Decision Point at The Edge📍 By: MJTrading |||
Bitcoin has rallied sharply from ~$98K and is now testing a critical confluence zone — the top of the descending channel and a strong supply area, known as "The Edge."
EMAs are turning up, supporting bullish momentum
⏳ What’s Next?
At this stage, two scenarios emerge:
⚠️ This is a make-or-break zone:
🟩 Breakout above the channel signals trend reversal → next resistance: $111K
🟨 Rejection leads to a move back to the $103K or $100K levels
This setup offers a high-RR opportunity for both breakout traders and mean reversion players.
🧠 Trade the reaction at the edge, not the prediction.
Thanks for your attention...
Share your thoughts...
—
#BTCUSD #Bitcoin #CryptoTrading #TheEdge #BreakoutOrBounce #CryptoSetup #DescendingChannel #SmartMoney #TechnicalAnalysis #PriceAction #SwingTrade #EMA #RiskReward #MJTrading #4hChart #TrendDecision #SupplyZone

Leg Based Continuation Possible Play📈 USD/JPY – 15M Chart (Scalping to Intraday Play)
🕒 June 17, 2025 – Lower Time Frame Setup
Bias: Short-term Bullish Continuation
Structure: Leg-Based Impulse-Pullback-Impulse Model
🔹 Market Structure Insight:
Price recently completed a strong impulsive move (LEG 1) on increasing volume.
After a shallow correction into dynamic support (EMA 60), price is attempting a LEG 2 continuation.
EMAs (15 & 60) have bullish alignment and acted as dynamic support.
✅ Buy #1 – Market Execution
Entry: 144.91 (current or recent execution)
SL: 144.38
TP: 145.25
R:R ≈ 1
🧠 Entry based on continuation after bullish flag breakout
✅ Price held higher low structure + EMA confluence
✅ Buy Limit #2 – Pullback Opportunity
Entry: 144.59 (highlighted zone between EMAs)
SL: 144.37
TP: 145.25
R:R ≈ 3.0
🧠 Designed to catch a retest into the mid-range and volume base
➕ Risk minimized, reward optimized
➕ Matches possible HL (higher low) setup if price dips before pushing
⚠️ Risk Management Notes:
Overlap with prior resistance zone just above TP (145.20–145.40): partial TP or trail advised.
Invalidated if price closes below 144.30 on strong volume (breaks structure).
If LEG 2 matches or exceeds LEG 1 in strength, extended targets above 145.50 possible.

Let the market pull back toward the marked FVG.🚨 EUR/USD Traders – Eyes on This Setup! 💹
The market has been respecting a trendline over the past few days, bouncing off support and climbing steadily. 🧗♂️ While doing so, it’s also been tapping into Fair Value Gaps (FVGs)—a clear sign of smart money interest. 📊
🔥 And guess what? We’ve just seen a breakout above the trendline resistance! This could be the beginning of a strong bullish move. BUT… patience is key! 🕰️
📉 Let the market pull back toward the marked FVG zone. If it does, that could give us a golden buy opportunity with high potential upside! 🚀
🧠 Always remember: Do Your Own Research (DYOR)
📛 Not Financial Advice – Trade Smart!

Skeptic | This Week's Most Profitable Setups: Gold, Forex & SPX!hey, traders, it’s Skeptic ! 😎 Our last watchlist was straight fire, racking up some sweet profits with tons of setups. This week’s looking just as juicy, so stick with me to catch these killer opportunities! 🚖 Welcome to my Weekly Watchlist, where I lay out the markets I’m trading with active triggers—forex pairs, commodities, and CFD indices. No FOMO, no hype, just pure reasoning to keep your trades sharp. Let’s jump in! 📊
DXY (Dollar Index)
Let’s kick off with DXY, ‘cause getting this right makes analyzing other indices and pairs a breeze. After multiple failed attempts to break support at 98.8 , it’s still ranging. This is a monthly support, so confirmation of a break needs to come on a monthly or at least weekly chart. Personally, I’m betting it’ll bounce from here. A break above 99.36 gives early confirmation of a rise, but the real deal is breaking resistance at 100 —then you can short USD pairs like EUR/USD . If 98.8 gives way, look for longs, but this monthly zone is tough, so expect some chop! 😬
EURX
EURX seems to be in a weak upward channel. A break above 1063 could push us to 1071 . On the flip side, breaking the channel’s midline at 1058 might drag us to the floor or even support at 1049 . So, our EURX game plan is clear.
Watchlist Breakdown
Let’s hit the watchlist, starting with XAU/USD (Gold ).
Triggers here are tricky, but I cloned last week’s downward channel and placed it above—this trick often gives us solid setups. If we bounce off the channel’s floor, a break above resistance at 3340 opens a long. For shorts, I don’t have a trigger yet since the market’s already dumped. If we form a 1-hour range, a break below its floor could trigger a short targeting 3249 or the previous channel’s midline.
Now, XAG/USD (Silver)
—no triggers this week. Our long trigger from last week’s analysis at 33.68 smashed it, spiking 8%! 🎉 That’s a lock even Bitcoin traders would drool over, but in Skeptic Lab :)
Next, EUR/USD.
The long trigger is set at a break above resistance at 1.14555 , which lines up with the DXY support break I mentioned. Heads-up: this trade won’t be easy. Reduce risk ‘cause we’re in for a big fight at this level—wild swings and tight stop losses get hunted fast. Stay sharp! 😤
GBP/USD Update
My GBP/USD long got stopped out, so let’s break it down. I went long after a resistance break, with crazy uptrend momentum and RSI hitting overbought (which I see as a long confirmation). Everything looked dope except my stop loss placement. The prior move was so sharp that my stop had to be wide, tanking my R/R. It hit the box ceiling target but then dumped, nailing my stop. Lesson? Either jump in before the main momentum or let the move play out and skip it. Mid-move entries with big stops? Recipe for pain...
SPX 500
Our SPX 500 long trigger from breaking the box ceiling already fired and seems to have pulled back. My target’s 6128.55 , and my open position has a stop loss below 5952.51. If you missed last week’s trade, a new trigger could be a 1-hour resistance break at 6014.20 . If you’re already long, no need to double up.
Final Note
my max risk per trade is 1%, and I suggest you stick to that or lower. I’m cooking up a Money management guide soon, diving deep into why it’s the key to outpacing 90% of traders and boosting your odds of consistent profits. Stay tuned! 🚨 No FOMO, and have an awesome week!
💬 Let’s Talk!
If this watchlist lit a spark, hit that boost—it means a ton! 😊 Got a pair or setup you want me to tackle? Drop it in the comments. Thanks for rolling with me—keep trading smart! ✌️

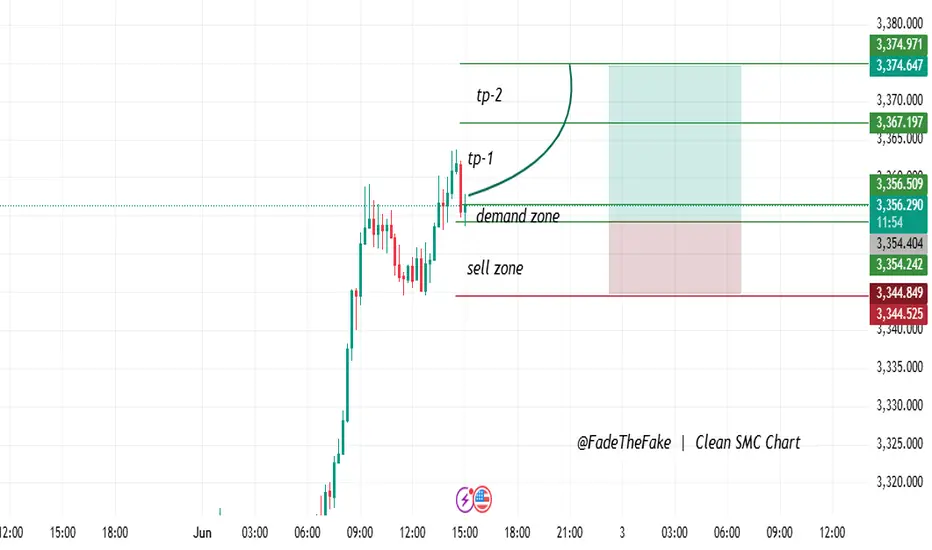
"Demand Zone Play – Targeting Fresh Highs!"Clean Buy Setup | Reaction in Demand Zone
- Price has touched a well-defined demand zone.
- Confirmed bullish reaction with good wick rejections.
- Placed entry just above the zone, stop loss below structural low.
- Targeting more liquidity zones as TP1 and TP2.
Entry: 3356.50
SL: 3344.50
TP1: 3367.20
TP2: 3374.97
This concept draws on a blend of Smart Money Ideas and Demand/Supply Zones
TradeCityPro | Comprehensive Bitcoin Analysis for 2025👋 Welcome to TradeCityPro Channel!
Let's go for the most complete BINANCE:BTCUSDT Bitcoin analysis you can see. In this analysis, we are going to examine the data from monthly to weekly to daily time frames and more in the most complete way possible!
🌐 Monthly Timeframe
In the monthly timeframe, as you can see, Bitcoin is positioned between two curved trendlines and has reacted to these zones multiple times.
The last time the price hit the bottom of this channel, it recorded a low of 16,000, after which the crypto bull run began. The top of this channel also coincided with the 69,000 peak in the previous bull run, allowing us to identify the end of that bull run.
One key point about this channel is that the slope of its trendlines is decreasing, and overall, a weakening trend in Bitcoin is observed, which is logical. This is because every time Bitcoin has made an upward leg, a massive amount of capital has flowed into it, so it naturally moves less in the subsequent leg.
This point might seem negative to newer market participants, as Bitcoin’s bull runs used to happen faster in the past, and the price moved more significantly in percentage terms. For example, the 2017 bull run saw Bitcoin grow by nearly 7,000%, while in the 2019 bull run, it grew by about 1,500%.
However, within this seemingly negative point, there’s a positive aspect: this reduction in volatility indicates Bitcoin’s maturity and that of the broader crypto market. When an asset has a large amount of capital invested in it, its volatility naturally decreases, but this also reduces the risk of investing in that asset.
For instance, gold currently holds the top spot globally with a market cap of 21 trillion dollars, while Bitcoin’s market cap is around 2 trillion dollars. This gap makes Bitcoin appear as a better investment choice at first glance, as its lower market cap suggests greater growth potential.
On the other hand, the risk of investing in Bitcoin is higher because it has less capital invested in it, and large institutions like governments prefer to invest in gold, earning lower returns over time compared to Bitcoin. For these institutions, the most important factor is risk optimization, and gold has proven itself as the lowest-risk asset over centuries.
So, overall, we can conclude that the more capital flows into Bitcoin, the lower its volatility becomes. As volatility decreases, it becomes a safer asset for investment, attracting more interest from large institutions.
Additionally, we should consider that if Bitcoin isn’t destroyed or proven to be a scam, it could become a safe-haven asset like gold in the future. Its supply is well-optimized, and due to the halving mechanism, its issuance is tightly controlled, which gives it an inherently bullish nature like gold.
Note that when I say Bitcoin’s movements are slowing down and more capital inflow reduces its volatility, I don’t mean it will stop moving upward. Rather, it means its cycles will take longer, and its movements will be heavier. For example, gold, despite its high market cap, still moved upward last year.
Currently, Bitcoin has started a new upward leg after rising from the 16,000 zone. It first reached the previous high, then, after reacting to the 0.5 Fibonacci Extension level (which overlapped with the 71,000 zone), it pulled back to the 57,000 zone and has now moved to the 0.618 level near 101,000.
Based on the candles formed in the monthly timeframe, it seems the upward movement is ongoing. If the 0.618 level is broken, the price could see a few more bullish candles. The next Fibonacci level is 0.786, near 165,000, and if the price movement extends a bit longer, this level could also overlap with the top of the curved channel.
In my opinion, the maximum potential for Bitcoin in this bullish cycle is between 160,000 and 180,000. However, keep in mind that this is just my personal view, and I’m not making decisions based solely on this analysis or planning to sell if Bitcoin reaches this range. This is merely a mental target, and if I see Bitcoin reaching this range with strong bullish momentum, there’s a chance it could break through.
In that scenario, if Bitcoin reaches this range without any trend weakness and with high momentum, I’ll update the analysis for you and examine higher targets Bitcoin could reach.
On the other hand, if I see Bitcoin’s momentum weakening and showing trend deterioration before reaching the resistance zone, I’ll adjust my perspective. If the trend reversal triggers I’ll discuss later are activated, I’ll exit the market.
In the RSI oscillator, we have very important zones that can help us assess the trend’s health. A ceiling at 77.65 has formed, which, if reached by RSI, could indicate a momentum-based market top. However, if this level is broken, the bullish scenario I mentioned is highly likely to occur, and the price could move beyond our expected target.
On the other hand, there’s a support floor at 58.90, and I believe the confirmation of the end of Bitcoin’s bull run will come with a break of this level in RSI. If RSI consolidates below this zone, bullish momentum will weaken, and the price will gradually enter a corrective phase.
Regarding volume, I should note that the decreasing volume in this timeframe isn’t reliable data because Bitcoin’s volume is spread across various exchanges, and comparing volume at this scale isn’t accurate or useful.
I have nothing more to say about the monthly timeframe. Let’s move to lower timeframes.
📊 Weekly Timeframe
Let’s dive into the weekly timeframe, where we can observe price movements in greater detail.
As you can see, after being supported at the 16,000 zone, Bitcoin faced a significant resistance at 31,000. Breaking this level kicked off the bullish trend. In the first leg, the price moved from 16,000 to 31,000, and after breaking 31,000 in the second leg, the upward move continued to 72,000.
One of the main reasons for this bullish cycle was the U.S. interest rate. Simultaneously with the breakout of the 31,000 zone, the U.S. Federal Reserve changed its policies and began lowering interest rates. This triggered a massive capital inflow into Bitcoin, initiating its bullish move.
During the corrective phase, the price oscillated between the 72,000 and 55,000 zones for several months. After breaking the 72,000 ceiling, another bullish leg took the price to 105,000.
One of the reasons for this bullish move was Trump’s strong support for crypto during the U.S. election. He frequently mentioned Bitcoin positively in his speeches and considered it part of his policies.
However, after Trump was elected president, he didn’t fully deliver on his promises. The imposition of tariffs not only impacted Bitcoin but also significantly affected the U.S. dollar, major company stocks, and indices like the S&P. As a result, Bitcoin dropped back to near the 72,000 zone.
Additionally, for the past few months, the U.S. Federal Reserve has not changed interest rates due to these tariffs. In all its statements, it has indicated that it’s waiting for the tariffs to be finalized and is in no rush to make decisions regarding monetary policy. Thus, in recent months, the interest rate variable has been effectively neutral, with the most significant fundamental news being the U.S. tariffs against China and Europe.
After Bitcoin’s drop to near 72,000, news of a 90-day agreement between China and the U.S. emerged, stating that tariffs would be lifted for 90 days to allow negotiations. This news was enough to restart the bullish move for Bitcoin and stocks like the S&P. As you can see, Bitcoin has now surpassed the 105,000 ceiling and is currently deciding its next move above this zone.
Looking at RSI, there’s a key support level at 44.75, where every time the price has hit this level, a new bullish leg has started. This level accurately indicated the 55,000 and 72,000 bottoms and has been very reliable.
However, there’s a clear divergence in RSI between the 72,000 and 105,000 peaks. The current peak above 105,000 is higher, but RSI is still forming lower highs, which could strengthen the divergence.
Currently, RSI is near the overbought zone and appears to be rejecting from the 70 level. If RSI is rejected from this zone, the price might fake out the 105,000 breakout and drop below it. If this happens, it would signal a significant trend weakness, greatly increasing the likelihood of a trend reversal.
However, if RSI consolidates above the 70 level and the price makes another bullish leg, we’ll still have divergence, but the trend weakness will be much less severe than in the fake-out scenario. If the price makes another bullish leg, our targets based on Fibonacci are the 130,000 and 160,000 zones.
In any case, if RSI forms a lower high compared to its previous peak and the price enters a corrective phase, I believe the 44.75 level will break, activating the divergence. If this happens, we’ll get a momentum-based confirmation of the bull run’s end, and we’ll then need to wait for a price-based confirmation.
Currently, the price confirmation for a trend reversal would first be a fake-out of the 105,000 breakout, with the main trigger being a break of the 72,000 level. If the price forms a higher high, we’ll need to wait and identify the trend reversal trigger based on market structure and conditions.
Personally, I believe Bitcoin will have another bullish move to the 130,000 zone, and simultaneously, dominance will move upward again. After this move, as Bitcoin consolidates or corrects, dominance will drop, leading to an altcoin season for a few months. After Bitcoin’s consolidation and the end of the altcoin season, the market’s bearish phase will begin, which I’ll discuss further if it occurs.
If you’ve bought Bitcoin at lower levels and are holding, I think you can continue holding, as there’s a high chance of another bullish leg, and we don’t yet have any confirmation of a trend reversal. I suggest continuing to hold until we get a clear reversal signal.
For buying Bitcoin on the spot market in this timeframe, it’s not possible to provide a trigger right now, as we’re at the end of a bullish leg, and the upward trend from 16,000 has been very prolonged. I believe we’ll see at most one more bullish leg, so if you’re skilled at trading, I suggest using this capital to open positions in futures to maximize profits.
Be cautious—I’m saying this only if you have trading skills, not to blindly open positions with all your capital without a trigger. That would only lead to losses.
If you haven’t bought any Bitcoin in this bullish trend yet, you can wait for the potential altcoin season. I suggest starting now to identify good projects so that when Bitcoin dominance shows bearish confirmation, you can buy the altcoins you’ve researched and profit from that market phase.
📈 Daily Timeframe
In the daily timeframe, as you can see, Bitcoin underwent a corrective phase, dropping to the 76,000 zone. After forming a base at this level, a bullish leg to 106,000 was triggered at 87,700.
Currently, the price is above the 106,000 zone but hasn’t consolidated above it yet. The reason I say it hasn’t consolidated is that market volume is decreasing after the breakout. Additionally, when the price breaks through a supply zone like an all-time high, significant momentum is required, but that hasn’t happened, and the price is ranging above this zone without significant movement.
If Bitcoin consolidates above this zone, the bullish move could continue. The targets we can consider are the 116,000 and 130,000 zones.
The RSI oscillator has a critical support at 59.78, which is a very important momentum level. If this level is broken, this bullish leg could end, and the market might enter a corrective phase. Volume is also slightly decreasing and showing some divergence with the trend, which is another sign of trend weakness.
If the price consolidates below 106,000, we’ll get confirmation of a fake-out of this breakout, and the price could move downward again. The lower support zones are 102,600 and 92,300.
If the price forms a lower high and low below 106,000, we can confirm a trend reversal. Breaking the 76,000 level would be the main confirmation of a trend change.
💼 4-Hour Timeframe
In the 4-hour timeframe, Bitcoin entered a corrective phase after reaching the 111,700 zone and has formed a descending triangle between the 106,000–107,000 range and a downward trendline.
The 106,000–107,000 range is a very strong support zone, and the price has tested this level multiple times but keeps forming lower highs compared to 111,700, increasing the likelihood of breaking this support zone.
On RSI, there’s a support level at 35.94, which is a very strong momentum zone. Breaking this level could confirm the entry of bearish momentum, increasing the likelihood of breaking the support zone.
With a break of the support zone and the 35.94 level in RSI, we can enter a short position. If the price forms a lower high and low below this support zone, we can confirm a trend reversal. The next key support zones are 101,600 and 93,700.
For the bullish trend to continue, breaking the downward trendline would confirm an upward move. If the trendline is broken, the price could rise to 111,700. Breaking the 111,700 level would be the main confirmation of the bullish trend’s continuation, activating the trendline breakout as the primary trigger.
🔍 Binance Open Interest is Surging as BTC Regains Bullish Momentum
Tracking what’s happening in the derivatives market has become essential, given the current market structure.
Derivatives volumes are significantly higher than those on spot markets or ETFs, especially on Binance, which ranks just behind the Chicago Mercantile Exchange in terms of volume.
As a result, derivatives activity can have a major impact on Bitcoin’s price, making on-chain data related to derivatives extremely valuable to monitor.
This has clearly been the case since BTC resumed its bullish trend, reflected in the rising Open Interest on Binance. It jumped from $7.5B on April 8th to over $11.2B today. We can also note that the 30-day and 50-day SMAs have just crossed back above the 100-day average. Derivatives activity has clearly helped fuel the price move, even though many short positions were opened along the way.
Seeing Open Interest climb is generally a good sign, as it gives the market momentum and can lead to strong upward moves. However, this kind of push tends to be fragile.
At the moment, we haven’t yet returned to a new Open Interest ATH on Binance, which may suggest that we’re not in a full-blown euphoric phase on derivatives markets just yet.
📊 Minimal Sell Pressure Despite STH & LTH Deposits on Binance
Keeping an eye on STH (Short-Term Holders) and LTH (Long-Term Holders) behavior gives us valuable clues about market sentiment.
In this update, we’re focusing on Bitcoin inflows to Binance from both STHs and LTHs. These flows help us measure selling pressure and get a feel for how price action might unfold.
Let’s start with STHs the group that tends to react quickly and emotionally to market shifts.
🧠 We’ve seen their behavior play out clearly in the past:
During the August 2024 correction, they sent over 12,000 BTC to Binance.
Then again, around late February to early March, during the tariff news-driven panic that pushed BTC below $80K, they dumped over 14,000 BTC.
But here’s the good news: right now, STH inflows are still moderate only about 8,000 BTC has been sent to Binance so far, which is roughly in line with the last correction.
🔍 As for LTHs, the numbers are even calmer.
Currently, just 86 BTC has flowed in from long-term holders—far lower than the 254 BTC seen before the last major top and way below the 626 BTC peak back in 2024.
📊 Bottom line?
Whether we’re looking at STHs or LTHs, there’s no real sign of strong selling pressure at the moment. Still, it’s worth watching in the context of ongoing demand—which remains relatively healthy for now.
Coinbase Premium Signals Strong Institutional Demand
There’s no doubt institutions are stepping in and no, it’s not just because of ETFs.
💡 Why not ETFs?
Because spot Bitcoin ETFs aren’t exclusive to institutions. Retail investors can access them just as easily, and in terms of raw volume, ETFs still don’t come close to the spot or futures markets.
That said, the inflows are still impressive: the 30-day average daily inflow is now over $330 million, and that trend is holding strong.
🚀 The Real Signal? The Coinbase Premium Gap
This metric tracks the price difference between Coinbase Pro (favored by U.S. professional/institutional investors) and Binance. Right now, the 30-day moving average of the premium gap is 55 a clear sign of heightened U.S. investor activity, which strongly points to institutional participation.
💰 Futures Activity Surges as Spot Demand Fades on Binance
Futures volume on Binance has been rising, while spot volume has dropped significantly in recent days even as Bitcoin broke into price discovery. This shift in volume composition is worth watching closely, as it provides important clues about the market’s internal strength.
Volume isn’t just a number—it reflects the type of demand driving the market. When demand comes from spot markets, it often suggests long-term conviction. In contrast, demand driven by futures markets tends to reflect short-term speculation, which can introduce instability.
Since May 5, we’ve seen futures activity increase modestly, while spot volumes have clearly declined. This suggests that the current price action may be fueled more by leverage and short-term bets than by solid, long-term buying.
Without strong spot support, trends powered by derivatives are more fragile and prone to sharp reversals. This environment calls for increased caution, especially for those considering new entries or leveraged positions.
⚡️ BTC Gains Bullish Momentum as Binance Open Interest Rises
Tracking what’s happening in the derivatives market has become essential, given the current market structure.
Derivatives volumes are significantly higher than those on spot markets or ETFs, especially on Binance, which ranks just behind the Chicago Mercantile Exchange in terms of volume.
As a result, derivatives activity can have a major impact on Bitcoin’s price, making on-chain data related to derivatives extremely valuable to monitor.
This has clearly been the case since BTC resumed its bullish trend, reflected in the rising Open Interest on Binance. It jumped from $7.5B on April 8th to over $11.2B today. We can also note that the 30-day and 50-day SMAs have just crossed back above the 100-day average. Derivatives activity has clearly helped fuel the price move, even though many short positions were opened along the way.
Seeing Open Interest climb is generally a good sign, as it gives the market momentum and can lead to strong upward moves. However, this kind of push tends to be fragile.
At the moment, we haven’t yet returned to a new Open Interest ATH on Binance, which may suggest that we’re not in a full-blown euphoric phase on derivatives markets just yet.
🔄 Bitcoin Heatmap Analysis
Let’s move on to the Bitcoin heatmap analysis, which was missing from this analysis and completes the most comprehensive data for these days. I hope it’s useful for you.
In the 6-month timeframe, Bitcoin has had a good upward trend but experienced a rejection after hitting orders in the 110,000–113,000 range. It’s currently in the 104,000 zone, with the most important support zone at 92,000, which is likely to hold.
In the monthly timeframe, we’ve broken through the 106,000 zone, which was a strong support level based on orders, but there isn’t a strong support zone immediately below. The next support level is 100,000–102,000, which could be a solid level, while the 110,000–112,000 zone is currently the most valid resistance level for Bitcoin.
In the weekly timeframe, a similar event has occurred. We’ve been rejected from the significant 110,000 resistance zone and are heading for further downside, but at a slow pace. In this timeframe, no specific support orders have been registered yet, and it will take some time for traders to place their buy orders on exchanges. However, even if we bounce from this level, we shouldn’t underestimate the 110,000 resistance.
📝 Final Thoughts
This is the most comprehensive Bitcoin analysis for the community.
We’ve done our best to collect the data comprehensively in this post for your awareness and present it to you in this analysis, hoping it has been useful for you!
Our team has worked on this analysis for several days, so we’d be thrilled if you boost, comment, and share the analysis with your friends.

Artavion Analysts Forecast Bitcoin to Reach $100,000 by End of MThe analytical company Artavion has released an updated forecast for the price of Bitcoin (BTC) by the end of May 2025. According to the experts, amid sustained institutional demand and limited supply following the recent halving, the price of the leading cryptocurrency could reach $100,000 in the coming days.
Key Growth Drivers
Analysts highlight several factors contributing to Bitcoin's price growth:
📈 Institutional Demand: Ongoing accumulation by investment funds and banks through spot ETFs approved in the U.S. and Asia.
⛏ Reduced Supply: The April halving has decreased miner rewards, limiting daily BTC issuance.
🇺🇸 Fed Policy Easing: Expectations of interest rate cuts are increasing demand for alternative assets, including crypto.
💼 Market Confidence: Growth in long-term holders and increasing BTC withdrawals from exchanges indicate a “HODLing” trend among investors.
Company Comment
"We are witnessing stable accumulation and a capital shift into digital assets. If markets avoid major shocks, Bitcoin has every chance to consolidate above $95,000 and briefly test the psychological barrier of $100,000," said Alexey Gurov, senior strategist at Artavion.
Potential Risks
Despite the optimistic outlook, analysts point out several risks that could impact the forecast:
📉 Unexpected macroeconomic data (e.g., rising inflation, stronger U.S. dollar);
⚠️ Regulatory actions from the SEC or other global bodies;
🌍 Escalation of geopolitical tensions, which could trigger risk-off sentiment.
Conclusion
Considering the current market environment and macroeconomic expectations, Artavion maintains a positive short-term outlook for Bitcoin through the end of May, while cautioning investors to remain aware of the sector’s inherent volatility and risk.

$ARB time to fly $1 this bull run 2025 and it's Last Wave...AMEX:ARB Time to Fly and Touching $1 this Quarter. I guess it will be happened and gain bonuses $1+ and $2+ if big investor entry on this token.
My Magic Indicator Say ARB Price have touch Yellow line. Previous Day, Bounce back to above Yellow Line and It's Bull Run 2025 for ARB .
From News: ARB Eyes Trend Reversal With Breakout Signal Above $0.45 This Week
Arbitrum is trading at $0.41 inside a falling wedge and a breakout above $0.45 might confirm a wide shift from its yearlong downward trend.
Arbitrum has formed a falling wedge with lower highs and higher lows now compressing price at $0.41.
If the price moves above $0.45 with strong volume this could confirm a new bullish pattern for $ARB.
The wedge has been forming since 2024 and a breakout may signal the start of a strong trend reversal.
The descending wedge pattern forming on the Arbitrum chart spans nearly one year, beginning from its 2024 highs near $2.50. Several failed rallies marked by red arrows define the top boundary, while green arrows at the base represent support retests. This structure has now tightened into a narrow apex where breakout probability increases significantly.
#Write2Earn #BinanceSquareFamily #Binance #BTC☀ #SUBROOFFICIAL
Disclaimer: This article is for informational purposes only and does not constitute financial advice. Always conduct your own research before making any investment decisions. Digital asset prices are subject to high market risk and price volatility. The value of your investment may go down or up, and you may not get back the amount invested. You are solely responsible for your investment decisions and Binance is not available for any losses you may incur. Past performance is not a reliable predictor of future performance. You should only invest in products you are familiar with and where you understand the risks. You should carefully consider your investment experience, financial situation, investment objectives and risk tolerance and consult an independent financial adviser prior to making any investment.

$BNB Surprised $678 Price Mega Big pumping & Touch to $700+ ✨ CRYPTOCAP:BNB Surprised $678 Price Mega Big pumping & Trying to $700+ Milestone again.
💫 From Breaking News:
• BNB Eyes $700 as CZ Pushes 90% Binance Chain Fee Cut
•Bhutan Partners with Binance Pay and DK Bank to Launch the World’s First National Crypto-Based Tourism Payment System
BNB price surged over 10%, hitting $642.92 after CZ’s 90% BSC gas fee cut proposal.
RSI reached 78.42, confirming strong bullish momentum and overbought conditions.
BNB may test $700 if Binance validators approve the proposed BEP-336 transaction model.
On May 9, Binance Coin (BNB) climbed to $642.92, rising over 10% in 24 hours. The price rally followed a proposal from Binance founder Changpeng Zhao (CZ) to cut gas fees on Binance Smart Chain (BSC) by 90%.
#Write2Earn #bnb #BinanceSquareFamily #MarketRebound #SUBROOFFICIAL
Disclaimer: This article is for informational purposes only and does not constitute financial advice. Always conduct your own research before making any investment decisions. Digital asset prices are subject to high market risk and price volatility. The value of your investment may go down or up, and you may not get back the amount invested.

$ETH Surprised $2.4K Price Mega Big pumping & touch to $3K ✨ CRYPTOCAP:ETH Surprised $2.4K Price Mega Big pumping & Trying to $3K Milestone again.
💫 From Breaking News:
• Ethereum Foundation Invests $32.65M in Ecosystem Growth
• Ethereum To Expand Network Capacity with Gas Limit Increase
Ethereum blockchain is preparing for a major upgrade that could make its network faster, cheaper, and more efficient. Developers have proposed raising the gas limit by 66% in a new development, from 36 million to 60 million units.
This change aims to improve the number of transactions the network can handle per block. This is to help users and developers enjoy smoother and more affordable activity on the blockchain.
Developer Says Testing Success Leads to Mainnet Rollout
Ethereum core developer Parithosh Jayanthi recently confirmed that the upgrade had passed early tests and is now ready for broader use. The new gas limit was successfully tested on the Sepolia and Holesky testnets. According to Jayanthi, the final rollout to Ethereum’s mainnet will begin shortly.
This is the second time Ethereum has raised its gas limit in 2025. The first increase happened in February, when the limit increased from 30 million to 36 million. These changes came after there hadn’t been any gas increase on the network since 2021.
#Write2Earn #ETH #BinanceSquareFamily #MarketRebound #SUBROOFFICIAL
Disclaimer: This article is for informational purposes only and does not constitute financial advice. Always conduct your own research before making any investment decisions. Digital asset prices are subject to high market risk and price volatility. The value of your investment may go down or up, and you may not get back the amount invested.

$BTC Finally $100K Surprised and Take Profit Done✨ CRYPTOCAP:BTC Surprise Finally Touch $100K Milestone again, All Take Profit and bonus Done.
💫 From Breaking News:
• Arizona Bitcoin Bill: Crucial SB 1373 Advances for State Bitcoin Reserve
• New Hampshire Becomes First to Approve Bitcoin Reserve—Will Other States Follow?
First introduced in January, HB 302, gives officials the ability to allocate state funds to both precious metals, and specific digital assets with a market capitalization of over $500 billion. That means Bitcoin, which, as of this writing, has a market cap of roughly $1.9 trillion per TradingView, is a prime candidate.
The newly enacted law states that any digital assets obtained must be kept using high security custody protocols. This can be done directly in a state managed multisignature wallet, via a qualified financial institution custody, or by investment in U.S. regulated exchange traded products (ETPs). Dennis Porter, CEO and Co-Founder of Satoshi Action, said:
“Satoshi Action drafted the model, New Hampshire engraved it into law, and now every treasurer nationwide can follow that roadmap. HB 302 proves you can protect taxpayer money, diversify reserves, and future-proof state treasuries all while embracing the most secure monetary network on Earth. New Hampshire didn’t just pass a bill; it sparked a movement.”
#Write2Earn #BTC #BinanceSquareFamily #MarketRebound #SUBROOFFICIAL
Disclaimer: This article is for informational purposes only and does not constitute financial advice. Always conduct your own research before making any investment decisions. Digital asset prices are subject to high market risk and price volatility. The value of your investment may go down or up, and you may not get back the amount invested.

Visa-Ripple Partnership Could Spark a Significan from Trenovia GThe financial world is undergoing a period of active transformation, and one of the most talked-about developments is the potential partnership between Visa and Ripple. According to a new analytical report by Trenovia Group, such a strategic collaboration could act as a catalyst for a substantial rise in Visa's stock value in the coming months.
Key Growth Drivers
Trenovia Group analysts emphasize that integrating Ripple’s technologies into Visa’s ecosystem would dramatically enhance the speed and reduce the cost of international transactions. RippleNet, built on blockchain technology, offers unique advantages: near-instant settlements, greater transparency, and lower fees compared to traditional interbank systems.
Partnering with Ripple would provide Visa with a powerful technological upgrade, reinforcing its dominance in the payment solutions market, particularly in cross-border transfers.
Expected Market Reaction
According to Trenovia Group, even the announcement of such a partnership could trigger a strong positive reaction from investors. In an increasingly competitive payments landscape, adopting blockchain innovations would be seen as a forward-looking move, enhancing Visa’s market appeal.
Technical analysis also points to favorable conditions: Visa shares are maintaining solid support around $260, and the formation of a "bullish flag" pattern suggests the potential for a breakout following positive news.
Strategic Importance of the Alliance
Trenovia Group highlights the long-term strategic benefits of this union. As digital currencies and decentralized payment systems gain traction, the integration of blockchain-based solutions would ensure Visa’s adaptability to evolving market and regulatory demands.
Meanwhile, Ripple would gain access to Visa’s vast global client network, boosting its position as a leader in the corporate cross-border payments sector.
Conclusion
According to Trenovia Group’s forecast, the Visa-Ripple partnership could provide a powerful boost to Visa’s stock. Upon successful integration of RippleNet technologies, analysts project a 15–25% rise in Visa's share price within the first six months after the announcement.
For investors, this could represent a rare opportunity to invest in the expansion of the world’s leading payment platform during a crucial phase of digital transformation.

This is my point of view regarding the S&P 500This is my point of view regarding the S&P 500. Will it play out exactly like this? Probably not, but as a general picture, I think there will be similarities.

THE REALITY!You cant beat the Index fund in Long term growth....Compare your portfolio with Major Indices
Warren buffet Quote - You can't Beat S&P500 Index

$BTC FINALLY BULL RALLY ON CHART NOW & 2nd TAKE PROFIT DONEJUST IN NEWS : BTC Bear Market To Last 90 Days, Analyst Predicts, as Trade War Fears and Whale Activity Impact Prices
Bitcoin has entered a bear market, with its price dropping over 20% from its all-time high. Market analyst Timothy Peterson expects the downturn to last 90 days, arguing that this decline is weaker than most past bear markets. He noted that out of the 10 previous downturns, only four—2018, 2021, 2022, and 2024—have been worse in terms of duration. Peterson does not see BTC sinking far below $50,000 but says a slide in the next 30 days could be followed by a 20-40% rally after April 15. He believes this could trigger renewed buying interest and push Bitcoin higher.
Investor sentiment has been affected by global trade war concerns following tariffs imposed by U.S. President Donald Trump and retaliatory measures from multiple trading partners. The uncertainty has led to a decline in speculative investments. The Glassnode Hot Supply metric, which tracks BTC held for a week or less, has fallen from 5.9% in November 2024 to 2.3% by March 20, signaling reduced short-term trading activity. A CryptoQuant report also suggests that most retail investors are already in the market, countering expectations that a surge of new traders would drive prices up.
Ether has also struggled, losing over 51% in three months since peaking above $4,100 on December 16, 2024. Analysts say ETH must reclaim the $2,200 range to gain upward momentum. “If price can generate a strong enough reaction here, then #ETH will be able to reclaim the $2,196-$3,900 Macro Range (black),” wrote crypto analyst Rekt Capital in a March 19 X post. Despite positive regulatory developments, such as the U.S. Securities and Exchange Commission dropping its lawsuit against Ripple, ETH has yet to see significant gains.
Market uncertainty remains high, with some analysts expecting economic pressures to last until at least April 2025. Despite short-term volatility, long-term projections remain optimistic. VanEck has predicted a $6,000 cycle top for ETH and a $180,000 peak for BTC in 2025.
Disclaimer: This article is for informational purposes only and does not constitute financial advice. Always conduct your own research before making any investment decisions.

$ETH PRICE RIDE TO $3K ON THIS BULL RUN 2025As of March 16, 2025, here are the latest developments in the Ethereum ecosystem:
Market Performance
Ethereum (ETH) is currently trading around $1,900, reflecting a 7.71% decrease over the past 24 hours.
Security Concerns
The FBI has accused North Korean-backed hackers, known as the Lazarus Group or TraderTraitor, of executing a $1.5 billion theft from Bybit, a Dubai-based cryptocurrency exchange. This heist, primarily involving Ethereum, is considered the largest in crypto history. The stolen assets are being laundered across multiple blockchains, raising significant security concerns within the crypto community.
Network Upgrades
The Ethereum community is anticipating the activation of the Pectra upgrade on the mainnet. This upgrade is expected to enhance network performance and could potentially drive ETH prices toward the $5,000 mark. However, the exact timeline for Pectra's implementation remains uncertain.
Competitive Landscape
Ethereum faces increasing competition from other layer-one blockchains. Notably, Solana (SOL) is reportedly forming a bullish setup that could lead to a substantial price surge, potentially impacting Ethereum's market dominance.
Investment Opportunities
For those interested in Ethereum investments, platforms like ICOminer offer cloud mining services with stable daily returns and principal refund guarantees. This presents an alternative avenue for earning passive income through Ethereum.
Privacy and Decentralization
Recent research has highlighted privacy issues within Ethereum's peer-to-peer network, revealing that validators can be deanonymized, which poses risks to decentralization. Additionally, studies indicate an oligopolistic trend in Ethereum's block-building auctions, suggesting increased centralization.
These developments underscore the dynamic nature of the Ethereum ecosystem, encompassing market fluctuations, security challenges, technological advancements, and competitive pressures.
Disclaimer: This article is for informational purposes only and does not constitute financial advice. Always conduct your own research before making any investment decisions.
