$XAU TAKE PROFIT 4 DONE & Price Serged 9.79% ~ $3005 ATH NOW TVC:XAU TAKE PROFIT 3 DONE & Price Serged 9.77% ~ $2,963 ATH NOW
Disclaimer: This article is for informational purposes only and does not constitute financial advice. Always conduct your own research before making any investment decisions. Digital asset prices are subject to high market risk and price volatility. The value of your investment may go down or up, and you may not get back the amount invested. You are solely responsible for your investment decisions and Binance is not available for any losses you may incur. Past performance is not a reliable predictor of future performance. You should only invest in products you are familiar with and where you understand the risks. You should carefully consider your investment experience, financial situation, investment objectives and risk tolerance and consult an independent financial adviser prior to making any investment.
Moneymanagement

$Pi Price Showing Rising Wedge Pattern NASDAQ:PI Previous Post Hit the Stoploss and Now Time to Big Pump

$BTC Price Showing Head and Shoulder Pattern On Chart, CPI DATACRYPTOCAP:BTC Price Showing Head and Shoulder Pattern On Chart, CPI DATA, $95K Soon as Possible?
Bitcoin high-entry buyers are driving sell pressure, price may ‘floor’ at $70K
Bitcoin's “top buyers” are selling heavily, with onchain analytics firm Glassnode calling it a “moderate capitulation event.”
Bitcoin buyers who purchased around when it hit a $109,000 all-time peak in January are now panic-selling as the cryptocurrency declines, says onchain analytics firm Glassnode, which isn’t ruling out that Bitcoin could slide to $70,000.
Glassnode said in a March 11 markets report that a recent sell-off by top buyers has driven “intense loss realization and a moderate capitulation event.”
Short-term holders fled as Bitcoin dropped from peak
The surge in buyers paying higher prices for Bitcoin
BTC $82,482 in recent months is reflected in the short-term holder realized price — the average purchase price for those holding Bitcoin for less than 155 days.
In October, the short-term realized price was $62,000. At the time of publication, it’s $91,362 — up about 47% in five months, according to Bitbo data.
Meanwhile, Bitcoin is trading at $81,930 at the time of publication, according to CoinMarketCap. This leaves the average short-term holder with an unrealized loss of roughly 10.6%.
Related: Bitcoin slides another 3% — Is BTC price headed for $69K next?
On the same day, BitMEX co-founder Arthur Hayes said that Bitcoin may retest the $78,000 price level and, if that fails, may head to $75,000 next.
Glassnode explained that a similar sell-off Bitcoin pattern was seen in August when Bitcoin fell from $68,000 to around $49,000 amid fears of a recession, poor employment data in the United States, and sluggish growth among leading tech stocks.
#BTC☀ #BinanceAlphaAlert #BinanceSquareFamily #Write2Earn #SUBROOFFICIAL
Disclaimer: This article is for informational purposes only and does not constitute financial advice. Always conduct your own research before making any investment decisions.

DISASTER Recipe for trading destruction (5 Points)🏊♂️ Do You Ever Try Swimming Upstream?
Unless you’re doing it for exercise and the strain…
You’ll know it’s exhausting.
And if you go against the direction of the waves, you’ll get nowhere very slowly—until you either reach the destination or give up.
Well, I find that trading against the trend is just as bad.
When you trade against the trend – your EGO starts to talk.
Your opinions start to enhance, and your irrational mind begins to take over.
I feel I need to explain why it’s so dangerous to go against the trend.
Let’s dive in.
🚫 Never Force a Trend
The worst thing you can do is bottom or top pick a market.
What makes you feel that you know the market is about to turn?
❓ Do you have inside information?
❓ Do you have a stronger intuition?
❓ Did you do some crazy future analysis?
And what’s the point?
Let the market reach its bottom or top, turn around – move a bit in the new direction until you have confirmation.
And then POUNCE.
You only need 30% of the trend and then close for a profit.
⏳ Patience Pays Off
The market moves in cycles.
📈 Sometimes it’s a roaring bull.
📉 Other times it’s a sulking bear.
🐢 And other times, it’s a bladdy tortoise – going sideways to Timbuktu.
The best thing to do is wait for the market to move from an unfavourable environment into a favourable time for your system and strategy.
🔄 Reassess and wait.
There’s no rush in trading.
🔄 Adjust and Act
The markets are always evolving.
You need to continuously adapt and act on:
📌 New markets to add
📌 Old markets to rid of
📌 Strategy tweaks to improve your win rate
📌 System considerations to boost winners and cut losses
Flexibility within your trading strategy is key.
🌊 Flow with Momentum
Ever noticed how surfers ride waves?
They don’t fight the ocean; they flow with it.
Traders should do the same with market momentum.
📈 When the market is going up – Go up with it.
📉 When the market is going down – Go down with it. (I mean short and sell, of course!)
➡️ When the market is moving sideways – Observe, report, and wait for better conditions.
Align your trades with the sentiment.
Going against the current market mood can be disastrous.
❌ Never Predict
Everything you see in the charts and fundamentals is based on past data.
So, it’s IMPOSSIBLE to predict with certainty where a market will go.
This is why you need risk management rules and stop losses with EVERY trade.
You can’t predict, BUT you can probability predict.
And that’s the difference between knowing and potential.
🎯 Recap: Trade Smart!
📌 Never Force a Trend: Be patient and wait for the right market conditions.
📌 Patience Pays Off: Let the market cycle play out before jumping in.
📌 Adjust and Act: Regularly review and tweak your strategy with new information.
📌 Flow with Momentum: Align your trades with the current market sentiment.
📌 Never Predict: React to market conditions rather than trying to predict them.
💡 Remember: The best traders ride the waves – not fight them.

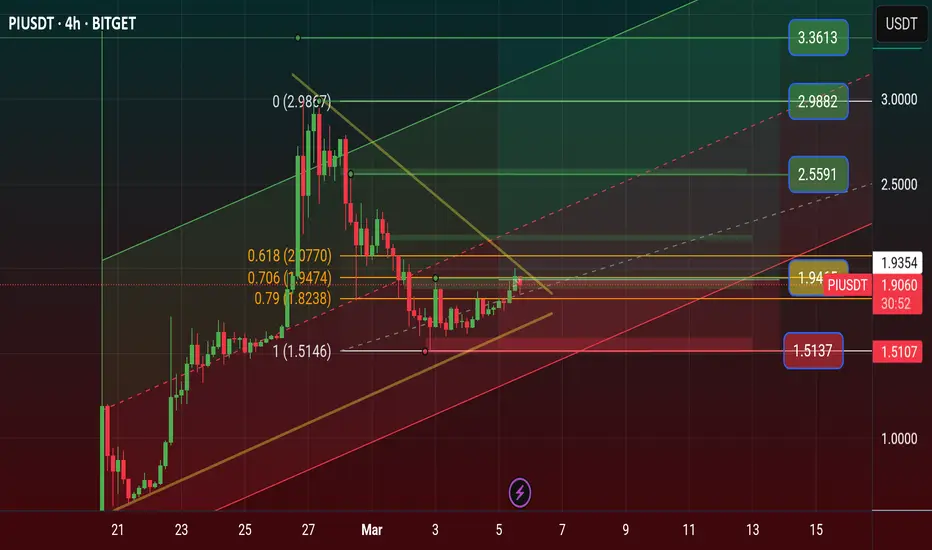
$PIUSDT Price Road to $11 Price Prediction 2025 Pi Network News: Can Pi Coin Price Hit $11? Key Levels Revealed, Pi Already Get place 11 of the Market.
Pi Network has gained 6.8% in the past 24 hours, outperforming major cryptocurrencies like Bitcoin (+7.5%), Ethereum (+8.9%), XRP (+11.1%), BNB (+9.8%), and Solana (+7.8%). But that’s not the real surprise.
Since its mainnet launch, PI's price has skyrocketed by an incredible 1,775.77%, while the overall crypto market has dropped by 11% in the same period. That’s a staggering contrast - and a sign that something big is happening.
With PI breaking key resistance levels and speculation about a major exchange listing growing, investors are wondering: How much higher can PI go? Could we see a breakout past $2? Let’s dive in.
💗 Why Is PI’s Price Rising?
Since February 20, PI has gained an incredible 1,775.75%, with a 7.5% jump in just the last 24 hours. This steady rise shows that Pi Network is moving independently of the broader market, maintaining strong momentum.
Key Reasons Behind PI’s Price Rally
Several factors are driving PI’s price increase:
Mainnet Migration Deadline Approaching
Pi Network is reaching its final deadline for users to migrate their holdings. According to a recent blog post from the team, March 17 is the last day to complete the migration. This deadline may be increasing buying pressure as investors prepare for the next phase.
🧡 Potential Binance Listing
Speculation around a Binance listing is another major factor. In a recent Binance community poll, over two-thirds of participants supported listing PI. If Binance or other major exchanges list it, the price could see a significant boost.
US Election Impact on Crypto
Donald Trump’s return to office is bringing a more crypto-friendly stance from the US government, which could benefit projects like Pi Network.
💝 Can PI Break $2.2?
Experts believe that if PI moves past the $2.2 resistance level with strong volume, it could rally toward $11. However, if it fails to break through, selling pressure could push it down to $1.5 Stoploss price area
To maintain its bullish trend, PI needs to hold support above $1.7. The price is currently just 1.11% below the key $2.2 level, making the next few days crucial in determining its next move.
🩷 Never Miss a Beat in the Crypto World!
Stay ahead with breaking news, expert analysis, and real-time updates on the latest trends in Bitcoin, altcoins, DeFi, NFTs, and more.
Pi Network has defied market trends and harsh criticism before, and if history is any guide, this rally might just be getting started.
🩵 Why Is Pi Coin’s Price Rising?
Pi Coin’s price is rising due to increasing exchange interest, migration deadlines, and strong community support, pushing demand higher.
💜 Nano History Will Pi Coin Reach $11?
If Pi breaks the $2 resistance with strong volume, experts predict a rally toward $11. Failure could lead to a drop below $1.5
💛 Is Binance Listing Pi Coin?
Binance has not officially listed Pi yet, but a recent community poll shows strong support, increasing the chances of a future listing.
XAUUSD NEW TARGET📌 Market Analysis & Trading Scenarios
Currently, the market is consolidating within a 100-pip range between support (2855) and resistance (2865). Based on this structure, we have three potential trading scenarios:
🔹 Scenario 1: Break & Retest for a Buy
✅ If any candle breaks and closes above the 2865 resistance, we wait for the next candle to break the high of the closing candle.
📈 Once confirmed, we enter a buy trade, aiming for upward momentum.
🔹 Scenario 2: Failed Breakout & Reversal
🔄 If the market breaks resistance but fails to sustain above the Fair Value Gap (FVG), we:
⚡ Close our buy trade at +60 pips profit.
📉 Immediately enter a sell trade, anticipating a reversal.
🔹 Scenario 3: Break & Retest for a Sell
✅ If any candle breaks below the 2855 support and the next candle breaks the low of the closing candle:
📉 We enter a sell trade, expecting further downside.
⚠️ Risk & Money Management 🎯
🔹 Always close partial profits at each target.
🔹 When full Take Profit (TP) is hit, close 90% of trades and hold 10% for long-term potential.
🔹 This disciplined approach ensures optimal risk management and capital protection.
📊 Trade wisely & manage risks effectively! 🚀

How To Manage Your Risk In Trading?Beginner!
Chasing profits is not the only purpose of smart trading. It is also about managing risk correctly. Every trade comes with uncertainty, and without a solid strategy, even the best opportunities can turn into costly mistakes. That’s where the 3-5-7 Rule comes in.
Think of it as a built-in safety net for your trades, a simple yet powerful guideline that helps you balance risk and reward. By setting clear limits on your exposure per trade, per market, and across your portfolio, the 3-5-7 Rule keeps you in control, protecting your investments from unexpected losses.
In this guide, we’ll break it all down: how the rule works, why it’s effective, and how you can apply it to your own trading strategy. Plus, we’ll walk through real examples to make it practical and easy to follow. By the end, you’ll be trading with more confidence, better discipline, and a clear plan to keep risk in check.
What is the 3 5 7 Rule?
The 3 5 7 rule works on a simple principle: never risk more than 3% of your trading capital on any single trade; limit your overall exposure to 5% of your capital on all open trades combined; and ensure your winning trades are at least 7% more profitable than your losing trades. It’s simple in theory, but success depends on discipline and consistency.
The Two Minds of a Trader: Analysis vs. ExecutionTrading is a game of probabilities, discipline, and emotional control. Yet, most traders unknowingly sabotage themselves by letting their analytical mind interfere with their execution. Understanding the distinction between the Analytical Mind (The Analyst) and the Execution Mind (The Trader) can significantly improve your trading performance. I’m Skeptic , and today, I’ll break down how to master these two mental states.
The Analytical Mind vs. The Execution Mind
The Analyst: The Market Forecaster 🔍📊
This is the part of your mind that loves to analyze, predict, and overthink.
It constantly searches for confirmation and the perfect setup.
It’s responsible for drawing support/resistance levels, using indicators, and finding confluence zones.
Often, it falls into the trap of “analysis paralysis,” hesitating to take trades due to over-analysis.
🛑 Biggest Mistake: Letting the Analytical Mind interfere with execution.
The Trader: The Decision Maker 🎯💰
This is the part of your mind that follows a structured, predefined trading plan.
It focuses on executing rather than predicting.
It respects stop-losses, sticks to the plan, and doesn’t chase the market.
It manages risk effectively and understands that losses are part of the game.
✅ Key to Success: Training the Execution Mind to act without emotional interference from the Analytical Mind.
How to Stop Overthinking and Trade with Confidence
1. Create a Clear Trading Plan 📝
A structured plan removes uncertainty. Before you enter a trade, you should already know:
Your entry triggers (specific price action setups, indicators, or fundamental conditions).
Your risk-to-reward ratio (R/R) and stop-loss placement.
Your profit-taking strategy (scaling out, trailing stops, etc.).
💡 Example:
I personally use setups based on support/resistance, RSI divergences, and volume confirmation.
I’ve backtested these setups with 30+ trades per condition, ensuring their viability.
This confidence in my system allows me to execute trades without second-guessing.
2. Separate Learning from Execution 🚧
One of the biggest mistakes traders make is learning while trading.
Before the trade: This is the time for analysis and preparation.
During the trade: This is execution mode—stick to your plan, no second-guessing.
After the trade: Review and learn. This is when you refine your strategy, not during a live trade.
3. Reduce Information Overload 📉
Too much knowledge can be detrimental in trading.
Many traders believe that knowing more = better trading. This is a myth.
The best traders master one or two strategies and refine them instead of constantly searching for new indicators.
Focus on backtesting and forward-testing instead of endlessly consuming content.
🚨 Reality Check: Traders 100 years ago made consistent profits without advanced indicators, algorithms, or AI models. Why? Because they focused on mastering risk management and execution instead of drowning in endless analysis.
Final Thoughts: Train Your Execution Mind
Trust your plan: If you’ve done your homework, your only job is to execute without hesitation.
Less is more: Reduce unnecessary analysis and stick to core principles.
Be patient: The best traders don’t chase trades—they wait for their setup.
📌 Key Takeaways: ✅ Stop over-analyzing and start executing.✅ Confidence comes from backtesting and having a structured plan.✅ The market rewards discipline, not predictions.
Which mindset dominates your trading—Analyst or Trader? Drop a comment below and let’s discuss!
🔹 I’m Skeptic, and my goal is to help traders gain clarity and consistency in their journey. Let’s grow together!

Learning Risk Management in Forex – A Step-by-Step ApproachAlthough I traded since 2004, but I actually started my trading learning journey in 2022. All what I did before was a waste of time.
I did another mistake in 2022. I wanted to teach myself technical analysis, and come up with a trading methodology that was suitable for me. That in itself is not a mistake, but starting with that aspect of trading was my mistake.
I realized that the first step should have been how to learn risk management in Forex trading.
As I continue my forex trading journey, I’ve realized that risk management is not just an add-on to a strategy—it’s the foundation of long-term survival. I’m sharing what I’m learning in the hopes that it helps others who are also figuring things out.
Here are a few key lessons I’ve come across:
Set a Fixed Risk Per Trade – Many experienced traders risk no more than 1 to 2 percent of their capital per trade. I’ve started applying this to keep losses manageable.
Define a Clear Stop-Loss Level – I used to place stops based on random numbers, but now I focus on market structure instead. This has made a difference in protecting my trades.
Use a Favorable Reward-to-Risk Ratio – I’ve been experimenting with a 1:2 ratio, meaning I aim for at least twice the reward compared to the risk. It helps keep my winners bigger than my losses.
Adjust Lot Size Based on Risk – This is something I’m paying more attention to. Calculating lot size based on risk per trade and stop-loss distance keeps things consistent.
Avoid Emotional Decision-Making – Sticking to a plan is harder than it sounds, but I’m learning that discipline is just as important as technical analysis.
I will write more about this and go deeper in each part of Forex trading risk management until I reach a level where I find myself set on my risk management plan.
I'm documenting more of my trading journey on my profile—feel free to check it out if you're interested.
How do you approach risk management in your trading? Let’s discuss in the comments.

Adverse excursion: a key concept for risk managementAs a professional trader, I can tell you about the adverse excursion and its crucial importance in the world of trading.
Adverse excursion: a key concept for risk management
Adverse excursion refers to the unfavorable movement of the price of an asset after a position is opened. More precisely, it is the difference between the entry price and the worst point the price reaches before the position becomes profitable again or is closed.
Maximum Adverse Excursion (MAE)
The concept of Maximum Adverse Excursion (MAE), developed by John Sweeney, is particularly useful. It measures the maximum floating loss suffered by a position before it turns in your favor or is closed. The MAE is a powerful statistical tool for analyzing drawdowns in an open position.
Trading Efficiency
Using MAE has several benefits for traders:
Optimizing Stop-Loss: By analyzing MAE over a series of trades, the optimal level for placing stop-loss orders can be statistically determined.
Evaluating Trading Systems: MAE helps evaluate the performance of trading systems and identify areas for improvement.
Refining Risk Management Strategies: By understanding the maximum adverse moves, traders can refine their strategies to better preserve their capital.
Improving Trading Efficiency: MAE analysis can help improve decision-making and execute trades with greater accuracy and confidence.
Practical Application
To effectively use the concept of adverse excursion, it is crucial to collect data on a large number of trades. For example, if you observe a series of MAEs like this: 15, 23, 18, 16, 0, 11, 31, 17, 8, 0, 19, 26, 0, 38, 22, you can deduce valuable information about the behavior of your trades and adjust your stop-loss levels accordingly.
In conclusion, the adverse excursion and especially the MAE are powerful tools for any serious trader. They allow to optimize risk management, improve the performance of strategies and make more informed decisions. As they say in the trade, "who controls his risks, controls his profits".
_______
Using the Maximum Adverse Excursion (MAE) has several significant advantages over traditional stop-loss placement methods:
Data-driven optimization
The MAE allows for a more precise and data-driven approach to stop-loss placement:
Statistical analysis: By examining the distribution of the MAE over a large number of trades, the optimal level for placing stop-loss orders can be statistically determined.
Performance visualization: The graphical representation of the MAE provides a clear overview of trade performance, allowing the most effective stop-loss levels to be visually identified.
Balancing protection and performance
The MAE helps to find an optimal balance between capital protection and trading performance:
Retention of winning trades: The stop-loss can be placed to retain 75-85% of winning trades, thus avoiding prematurely cutting potentially profitable positions.
Elimination of large losses: At the same time, this approach eliminates trades that suffer large losses, thus protecting capital.
Adaptation to the specific strategy
The MAE adapts to the unique characteristics of each trading strategy:
Customization: Unlike generic methods, the MAE takes into account the specific behavior of the trades of a given strategy.
Flexibility: This approach can be applied to a variety of strategies, whether short-term trading, swing trading, or long-term positions3.
Improved risk management
Using the MAE contributes to better overall risk management:
Deep understanding: The MAE provides a more nuanced understanding of how trades evolve, allowing for better risk assessment.
Reduced stress: By having a solid basis for placing stop-losses, traders can reduce the stress associated with real-time decision-making.
Complementarity with other tools
The MAE can be used in conjunction with other techniques:
Combination with the MFE: The analysis of the Maximum Favorable Excursion (MFE) in parallel can help to optimize not only the stop-losses, but also the profit-taking.
Cross-validation: The results obtained by the MAE analysis can be compared with those of traditional parameter optimization methods for greater confidence in the strategy.

$SOL Price LONG Setup February 2025 | 1D | SOLUSDT See on Chart✨SOL Price LONG Setup February 2025 | 1D | SOLUSDT
Solana News: VanEck Predicts $520, But This $0.01 Token is the One to Watch in 2025
VanEck, a prominent investment management firm, has recently predicted a strong run for Solana in 2025, saying the token could hit $520. This projection is based on Solana’s anticipated market share growth in the smart contract sector, which is expected to rise from 15% to 22% in 2025. Given this, Solana’s market capitalization could skyrocket to $250 billion, driving Solana’s price to $520 based on an estimated 486 million circulating tokens.
Solana Price Prediction: $150 Looking Inevitable
Solana is currently trading at $168 though it continues to plummet, having seen a drastic loss in the last 24 hours. As noted by Crypto Daily, a dip below $150 could pave Solana’s path to much lower prices, such as $140 and under.
• Solana (SOL) Technical Analysis and Key Levels
The potential reason behind this fear is the recent breakdown of the crucial support level at $180, which SOL failed to hold. Additionally, it has fallen below the 200 Exponential Moving Average (EMA), indicating that the asset is in a downtrend.
Based on recent price action and historical patterns, it appears that SOL is bearish, with a high probability of staying between $160 and $180 until it crosses the $190 mark. However, SOL falls below the $160 level, there is a strong possibility it could drop another 20% to reach $120 in the future.
According to the data, traders betting on the bullish side are currently dominating the asset, as they are over-leveraged at the $162.8 level and hold $145 million worth of long positions. This over-leveraged level suggests that traders believe SOL’s price won’t fall below this point, which currently acts as strong support.
#Write2Earn #BinanceAlphaAlert #BNBChainMeme #solana #SUBROOFFICIAL
Disclaimer: This article is for informational purposes only and does not constitute financial advice. Always conduct your own research before making any investment decisions. Digital asset prices are subject to high market risk and price volatility. The value of your investment may go down or up, and you may not get back the amount invested. You should only invest in products you are familiar with and where you understand the risks. You should carefully consider your investment experience, financial situation, investment objectives and risk tolerance any investment.

$SOL Price LONG Setup February 2025 | 1D | SOLUSDTSee on Chart, Recently News- Ethereum Price Holding Above $2600 Could Spark an Altseason?
Ethereum price is currently testing a crucial support level at $2,670, hovering dangerously close to the $2,600 threshold which is crucial for its price and other altcoins.
This price, just above 0.618 Fibonacci retracement level, was a key support that could dictate ETH’s and other altcoins short-term trajectory.
If Ethereum fails to maintain the $2600 level, it could signal a broader downturn, potentially impacting the anticipated altcoin season.
Ethereum has been navigating within an expansive ascending channel since mid-2023, adhering to both support and resistance levels delineated by Fibonacci retracement lines.
Notable touches at the 0.236 Fibonacci level around $1,456 and rebounds off the 0.382 level around $1,767 demonstrate the historical significance of these zones.
A fall below the current level near $2,670 might see ETH targeting lower supports at $2,414 and possibly $2,175.
Conversely, a rebound from the $2,600 level could reignite bullish sentiment, possibly pushing prices towards upper resistance levels near $3,140 and beyond.
This potential recovery would be critical in maintaining the momentum required for an altseason, characterized by widespread gains across various altcoins.
How Whales Could Spark an Altseason?
The total balances for wallets holding between 10k to 100k ETH surged, reaching 16 Million ETH by February 2025, compared to just above 14 Million in early 2024.
This substantial accumulation coincided with a noticeable uptick in ETH’s price.
It escalated from around $2,400 in December 2024 to over $3,800 in January 2025 before slightly retracting.
After a peak in early 2025, ETH price headed into a downward trend while the balances in whales’ wallets did not shown a similar decline.
This indicates a potential holding strategy rather than a sell-off.
Recently From News- Ethereum (ETH), the king of altcoins, has been steadily climbing, with analysts predicting a potential rally to $10,000 in 2025 as institutional adoption grows. Historically, when Ethereum moves, ERC-20 tokens follow, meaning that a major ETH rally could send Shiba Inu (SHIB) and Mutuum Finance (MUTM) soaring. With ETH currently priced at $2,773, a push toward $10,000 would likely create a bull market for ERC-20 tokens.
Disclaimer: This article is for informational purposes only and does not constitute financial advice. Always conduct your own research before making any investment decisions. Digital asset prices are subject to high market risk and price volatility. The value of your investment may go down or up, and you may not get back the amount invested. You should only invest in products you are familiar with and where you understand the risks. You should carefully consider your investment experience, financial situation, investment objectives and risk tolerance any investment.

$BTC Long Setup February 2025 | 4H | BTCUSDT See on Chart,✨ CRYPTOCAP:BTC Long Setup February 2025 | 4H | BTCUSDT
Recent News: Czech Central Bank Explores Bitcoin Amid Cautions Over Crypto Risks
Analyst Says Bitcoin Could Reach $100K in 1-2 Weeks, Trying to Create New Support. Bitcoin's price has recently bounced from a key support level, located just below the 78.6% retracement, which has been a focal point in the last few days. The price formed a local low and attempted a move to the upside. However, the bullish rally is still in its early stages, and the momentum seems too small to be considered a strong trend just yet.
Currently, Bitcoin has failed to break the previous swing high from February 3rd, which is around $96,700. For the bulls to show strength, a break above this level is essential. While this move up could be a sign of things to come, the price action is not yet strong enough to confirm a substantial low.
Crypto analyst Michael say Bitcoin and Ethereum in the coming weeks. He believes Bitcoin could reach $100K within 1-2 weeks, with the current consolidation phase offering a great entry point for investors. As Bitcoin holds at lower levels, van de Poppe sees it as a chance for a potential breakout.
Market Implications
The price area between GETTEX:89K and $57K may receive backing from institutional investors and ETFs yet a significant market fall below $57K would signal extended bearish trends. Long-term holders keep GETTEX:25K as their essential reference point for the market because previous market bottoms reached this exact value.
Disclaimer: This article is for informational purposes only and does not constitute financial advice. Always conduct your own research before making any investment decisions. You should only invest in products you are familiar with and where you understand the risks. You should carefully consider your investment experience, financial situation, investment objectives and risk tolerance any investment.

$ETH Price LONG setup 2025 | 4H | ETHUSDTSee or Chart, From Recently News - Ethereum eyes $3000 resistance level – why investors are accumulating this presale gem
Ethereum Price Confirms Bullish Reversal
After facing increased volatility due to broader market trends, Ethereum's price has broken a critical resistance level around the $2,727-$2,730 range. The large-cap altcoin might retest this zone, confirming it as the new support before its next leg up. Notably, Ethereum's price has been consolidating near recent highs and has formed a potential bullish continuation pattern. If the altcoin’s retest holds, the price of ETH could surge towards $2,769 and beyond.
The price has rebounded off a crucial support level at $2,503, which aligns with previous demand zones. Its relative strength index (RSI) reading on the daily time frame has been hovering around the neutral zone, neither overbought nor oversold, indicating room for movement in either direction. The next significant test of the ETH coin could be reclaiming the $3,349 level, which might signal bullish momentum returning.
A confirmed close above $3,349 could trigger a rally toward higher values. However, if the price of Ethereum fails to hold above the $2,700 level, it could set the stage for a deeper correction, pulling back the price towards the $2,503 and $2,125 support levels. Ethereum’s RSI on the 1-hour chart suggests mild bullish divergence, hinting at a potential upside, but confirmation is needed through increased volume and sustained price movement above $2,881.
Disclaimer: This article is for informational purposes only and does not constitute financial advice. Always conduct your own research before making any investment decisions. Digital asset prices are subject to high market risk and price volatility. The value of your investment may go down or up, and you may not get back the amount invested. You should only invest in products you are familiar with and where you understand the risks. You should carefully consider your investment experience, financial situation, investment objectives and risk tolerance any investment.

$BNB LONG SETUP | Binance Coin Price Predictions for This Week Binance Coin (BNB) Price Predictions for This Week
Key Support levels: $600
Key Resistance levels: $701. Massive Bounce off Key Support
After BNB touch $500 for a brief moment in early February, the price shot up to $700 in less than 10 days. This reversal was abrupt and significant, confirming that the support at $600 is well defended by buyers. At the time of this post, BNB is under the key resistance at $700.2. Sellers are Defending the $700 Resistance
As soon as the price moved above $700, sellers came in strong to push the price under this key level. After an impressive performance, BNB could not break this level which continues to act as a key resistance at the time of this post. Nevertheless, buyers could attempt another breakout later.3. Sustained Buy Volume Meets Sellers
Prior to BNB reaching $700, the buy volume was sustained and increased gradually. However, as soon as the price moved above $700 sellers dominated with the highest daily volume recorded so far in 2025. This has put a pause to the rally, and for it to continue, buyers need to turn $700 into a key support.
🔥 Market Analytics Info ( CRYPTOCAP:BNB )
Fully Diluted Market Cap: $94.2B
Volume 24 hour: $2.25 B
Total Supply: 142.48 B BNB
Circulating Supply: 142.48 B BNB
Market Cap: $94.02 B
All Time High: $793.35
All Time Low: $0.0961
Already have 90 Day Returns 2.84%
Now 7 Day Returns 13.99%
🔥Chart Analysis ( CRYPTOCAP:BNB )
💫2025 ATH : $793.35
🎆ENTRY POINT : $613.63, $588.50, $564.54
🎇STOPLOSS ZONE : $502.87
1ST TARGET $684.43
2ND TARGET $745.47
3RD TARGET $792.78
ATH 4TH TARGET $877.85
Disclaimer: This article is for informational purposes only and does not constitute financial advice. Always conduct your own research before making any investment decisions. Digital asset prices are subject to high market risk and price volatility. The value of your investment may go down or up, and you may not get back the amount invested. You are solely responsible for your investment decisions and Binance is not available for any losses you may incur. Past performance is not a reliable predictor of future performance. You should only invest in products you are familiar with and where you understand the risks. You should carefully consider your investment experience, financial situation, investment objectives and risk tolerance and consult an independent financial adviser prior to making any investment.

$LUNC Long Setup see on Chart, LUNC Price on the Rise as Terra..LUNC Price on the Rise as Terra Classic Moves Closer to 403B Target
The Terra Luna Classic (LUNC) market rose continuously during five trading days and surpassed its essential resistance barrier. On February 12, LUNC reached its peak value at $0.0000784 while showing a 59% rise relative to its yearly market lows.
LUNC Burn Activity Triggers Price Surge
The upward price trend of LUNC joins altcoins in general, which have recovered from their local winter lows reached on Monday. LUNC’s latest price increase stems directly from the continuous token-burning efforts on the Terra Classic network.
LUNC Metrics demonstrates that the network has destroyed more than 628 million tokens throughout the previous week. The latest round of burning operations has expanded the total destroyed LUNC supply up to 402.78 billion since the initiative commenced.
The current pace indicates that the total burned supply will cross the 403 billion threshold during the latter part of this month. Between on-chain network transactions and Terraform Labs donation amount, 67.86 billion of the total burned tokens have been eliminated thus far, but 334.92 billion tokens were directed toward the burn wallet.
Binance stands out as the primary supporter of LUNC burning through its destruction of more than 70.8 billion tokens, as noted in our earlier post. The burn process received substantial support from the DFLUNC Protocol, which managed to destroy 4.52 billion tokens, along with LunaticsToken, which burned 1.97 billion tokens.
The Terra Classic community believes that ongoing burn operations alongside staking might possibly resolve the issues that affect TerraClassicUSD (USTC).
USTC, the stablecoin that lost its peg during the Terra ecosystem collapse, also recorded a notable surge. USTC price rose above 13.22% today to reach the value of $0.01875. However, the current value of USTC remains 5,233% below its target dollar value of $1, therefore necessitating further increase in price.
LUNC Price Analysis Today
On Wednesday, LUNC price continued surging, trading at $0.00007805, up by 5.12% at press time. A formation of hammer candlestick pattern emerged at this price level with its long lower wick and tiny body structure, which often indicates a bullish reversal move, as mentioned in our previous story.
The LUNC price exceeded the upper boundary forming the pattern of declining wedge. The falling wedge is created by descending trend lines that move toward one another and generally signal bullish price movements. Terra Classic overcame its previous support area at $0.00007140 in early September.
Terra Classic stands to potentially reach its next major resistance point at $0.0001025 after breaking through this barrier because this level corresponds with the 38.2% Fibonacci retracement measure. The future price potential stands at 40% above its current value according to this target measurement. Hence, the current bullish outlook would become invalid if market bearishness drives prices beneath the $0.00005525 support
Disclaimer: This article is for informational purposes only and does not constitute financial advice. Always conduct your own research before making any investment decisions. Digital asset prices are subject to high market risk and price volatility. The value of your investment may go down or up, and you may not get back the amount invested. You are solely responsible for your investment decisions and Binance is not available for any losses you may incur. Past performance is not a reliable predictor of future performance. You should only invest in products you are familiar with and where you understand the risks. You should carefully consider your investment experience, financial situation, investment objectives and risk tolerance and consult an independent financial adviser prior to making any investment.

$XAU TAKE PROFIT 3 DONE & Price Serged 8.75% ~ $2963 ATH NOW BITGET:XAUTUSDT TAKE PROFIT 3 DONE & Price Serged 8.75% ~ $2,963 ATH NOW
Disclaimer: This article is for informational purposes only and does not constitute financial advice. Always conduct your own research before making any investment decisions. Digital asset prices are subject to high market risk and price volatility. The value of your investment may go down or up, and you may not get back the amount invested. You are solely responsible for your investment decisions and Binance is not available for any losses you may incur. Past performance is not a reliable predictor of future performance. You should only invest in products you are familiar with and where you understand the risks. You should carefully consider your investment experience, financial situation, investment objectives and risk tolerance and consult an independent financial adviser prior to making any investment.

$XAU Profit Target 2 Done See on ChartBITFINEX:XAUTUST Chart Analysis of Price Prediction 2025 see more chart...
Gold price flat lines above $2,760 level as traders keenly await FOMC decision Gold Price Forecast: XAU/USD nears $2,750 as Fed’s decision looms
From a technical perspective, the recent breakout through the $2,720-2,725 horizontal barrier and positive oscillators on the daily chart suggest that the path of least resistance for the Gold price remains to the upside. A subsequent move above the $2,772-2,773 area will reaffirm the constructive outlook and lift the XAU/USD beyond the $2,786 area, or the highest level since October 2024 touched last Friday, towards the all-time peak, near the $2,790 zone. Some follow-through buying, leading to a strength beyond the $2,800 mark, will be seen as a fresh trigger for bullish traders and pave the way for an extension of a well-established uptrend witnessed over the past month or so.
XAU/USD Current price: $2,753.60
The Federal Reserve will likely keep rates on hold in today’s monetary policy meeting.
The United States will publish the preliminary estimate of the Q4 GDP on Thursday.
XAU/USD could extend its slide in the near term amid prevalent US Dollar demand.
Gold is under modest selling pressure on Wednesday as caution rules ahead of the Federal Reserve’s (Fed) monetary policy announcement. The United States (US) central bank is widely anticipated to keep the benchmark interest rate unchanged after trimming 25 basis points (bps) and settling it at 4.25%-4.5% in December.
Support levels: 2,747.20 2,734.60 2,716.50
Resistance levels: 2,764.85 2,777.30 2,789.95
Disclaimer: This article is for informational purposes only and does not constitute financial advice. Always conduct your own research before making any investment decisions.

Dogecoin (DOGE)📌 Dogecoin (DOGE) Technical Analysis
🔷 Introduction:
Dogecoin (DOGE) is one of the oldest meme coins in the crypto market, consistently remaining in the spotlight thanks to strong community support and endorsements from influential figures like Elon Musk. Given the recent surge in trading volume and price fluctuations, a technical analysis of DOGE can provide valuable insights for investors.
📊 Technical Analysis
📌 Overall Market Condition:
🔹 After a sharp rally, DOGE has entered a correction phase and is currently fluctuating within a descending channel.
🔹 The price has reached the 0.5 Fibonacci retracement level and the key support zone of $0.19 - $0.20.
🔹 Historically, this area has acted as a significant support level.
📈 Bullish Scenario:
✅ Reaction to the bottom of the descending channel → potential for an upward trend.
✅ Entry confirmation upon signs of reversal and a breakout above the channel.
✅ Possible targets if the descending channel is broken:
🔸 TP1: $0.52 - $0.57
🔸 TP2: $0.85 - $0.94
✅ Key Consideration: After reaching TP1, market behavior and trend strength should be reassessed.
📉 Bearish Scenario:
❌ If the $0.19 support level is broken and the price stabilizes below it, further decline is likely.
❌ Key support levels in case of a breakdown:
🔻 $0.128
🔻 $0.093
❌ A decline in trading volume and increased selling pressure would indicate weak buyer momentum.
📌 Conclusion:
🔹 The bottom of the descending channel could present a buying opportunity, but it comes with high risk.
🔹 A breakout above the channel may trigger a price surge toward $0.52 and beyond.
🔹 Risk management is crucial—breaking below $0.19 could be a strong bearish signal.
⚠️ Disclaimer: The crypto market is highly volatile. Always define your exit strategy before entering a trade and strictly adhere to your stop-loss plan.

$BTC Bounce Back Again $100K Price, New Long Setup see on chartBINANCE:BTCUSDT Bounce Back Again $100K Price, New Long Setup see on chart...
News: Bitcoin Leads US Equity Markets Amid Macro Developments, Yet Stays Resilient: Report
Bitcoin (BTC) is becoming increasingly sensitive to macroeconomic factors. In fact, the digital asset is leading equity markets in the United States in response to President Donald Trump’s latest economic and policy changes.
Over the last four days, President Trump’s announcements havetriggeredincreased uncertainty in global markets, leading to a decline in bitcoin’s price. Bitcoin fell below $100,000 and even touched an intraday low of $91,657 on Monday.
Since bitcoin rallied during President Trump’s inauguration, the cryptocurrency has continued to show a downward trend. BTC formed the double top structure at the $108,000 level and has been trading in a 15% range since mid-November.
Bitfinex analysts said such 15-20% ranges often resolve in either an upward or downward direction within 80-90 days. This means BTC will experience a decisive price move in the coming weeks, still under the influence of macroeconomic developments.
As the financial markets process the implications of the tariff hikes, Bitfinex believes BTCfacesfurther downside unless legacy assets recover. Even if legacy markets do not see significant recovery, analysts are confident in bitcoin’s long-term trajectory, which they have described as compelling.
“In conclusion, while Bitcoinʼs short-term volatility may continue in response to macroeconomic influences, its long-term outlook remains positive,” Bitfinex analysts added.
BINANCE:BTCUSDT LONG SETUP HERE
Entry Price: $96,651.98
Stoploss Zone: $91,206.57
Leverage: 11x use 11% of your margin balance.
This Long Setup 4 Target Price Level here
1 Take Profit: $100,443.31
2 Take Profit: $103,772.29
3 Take Profit: $107,087.34
4 Take Profit: $111,059.81
Disclaimer: This article is for informational purposes only and does not constitute financial advice. Always conduct your own research before making any investment decisions. Digital asset prices are subject to high market risk and price volatility. The value of your investment may go down or up, and you may not get back the amount invested. You are solely responsible for your investment decisions and Binance is not available for any losses you may incur. Past performance is not a reliable predictor of future performance. You should only invest in products you are familiar with and where you understand the risks. You should carefully consider your investment experience, financial situation, investment objectives and risk tolerance and consult an independent financial adviser prior to making any investment.

$XAUTUST Chart Analysis of Price Prediction 2025 see more chartBITFINEX:XAUTUST Chart Analysis of Price Prediction 2025 see more chart...
Gold price flat lines above $2,760 level as traders keenly await FOMC decision Gold Price Forecast: XAU/USD nears $2,750 as Fed’s decision looms
From a technical perspective, the recent breakout through the $2,720-2,725 horizontal barrier and positive oscillators on the daily chart suggest that the path of least resistance for the Gold price remains to the upside. A subsequent move above the $2,772-2,773 area will reaffirm the constructive outlook and lift the XAU/USD beyond the $2,786 area, or the highest level since October 2024 touched last Friday, towards the all-time peak, near the $2,790 zone. Some follow-through buying, leading to a strength beyond the $2,800 mark, will be seen as a fresh trigger for bullish traders and pave the way for an extension of a well-established uptrend witnessed over the past month or so.
XAU/USD Current price: $2,753.60
The Federal Reserve will likely keep rates on hold in today’s monetary policy meeting.
The United States will publish the preliminary estimate of the Q4 GDP on Thursday.
XAU/USD could extend its slide in the near term amid prevalent US Dollar demand.
Gold is under modest selling pressure on Wednesday as caution rules ahead of the Federal Reserve’s (Fed) monetary policy announcement. The United States (US) central bank is widely anticipated to keep the benchmark interest rate unchanged after trimming 25 basis points (bps) and settling it at 4.25%-4.5% in December.
Support levels: 2,747.20 2,734.60 2,716.50
Resistance levels: 2,764.85 2,777.30 2,789.95
Disclaimer: This article is for informational purposes only and does not constitute financial advice. Always conduct your own research before making any investment decisions.

TrueFi (TRU)Comprehensive Analysis of TRU/USDT
Overview
TrueFi (TRU) is an innovative project in the decentralized lending space (DeFi Lending) that enables collateral-free lending. The TRU coin is among the low-market-cap cryptocurrencies, and due to its low liquidity and high volatility 🚨, it falls into the category of high-risk trades. For investing or trading this coin, risk management and attention to trading volume are essential.
Current Market Situation
Downtrend Channel: 📉
TRU’s price is currently in a downtrend channel and is heading towards the bottom of the channel.
Weekly Support Zone:
The range (0.0605 - 0.0662) acts as a key support level. Although there is a possibility of a drop below this range, a quick rebound (Fake Breakout) from this zone could signal a safe entry. 💡
Trading Volume: 📊
If the volume increases when the price bounces from the channel’s bottom, the likelihood of price rising to the top of the channel strengthens. Traders should pay close attention to volume near the support range.
RSI: 📈
RSI Support Zone:
The range (41.24 - 44.19) could prevent further decline. A breakdown of this zone could lead to a deeper drop.
Breaking the 50 RSI Zone:
A move above this level could indicate a strong upward move, providing a good entry opportunity. 🚀
Upcoming Scenarios
Bullish Scenario: 🌟
Bounce from the Bottom of the Downtrend Channel:
If the price stabilizes in the support range (0.0605 - 0.0662) and trading volume increases, an upward move to the top of the channel becomes likely.
Breakout of the Downtrend Channel’s Top:
If the top of the downtrend channel is broken, the price could reach the target range (0.2258 - 0.2702). Given TRU's low market cap, heavy liquidity inflow could push the price beyond this target. 📌
Bearish Scenario: ⚠️
Loss of Weekly Support:
If the range (0.0605 - 0.0662) is lost, the next support is at 0.0400.
Traders should set appropriate stop-loss orders to mitigate risk. 🛑
Weakness in RSI:
A breakdown of the support zone (41.24 - 44.19) in the RSI could signal a continuation of the downtrend. 🔻
Range-Bound Scenario: ⏸️
If the price remains within the weekly support zone and trading volume decreases, a short-term range-bound movement may develop. 🔄
Stop-Loss:
For long trades, set the stop-loss below the 0.0600 range. ❌
Trade Volume:
Given the high risk, it is recommended to allocate only a small percentage of capital to this trade. 💰
Summary
TRU, considering its technical setup and position in the downtrend channel, can present promising trading opportunities. However, due to its low market cap and high volatility, risk management is crucial. ⚡
Recommendation: Always review fundamental factors and project-related news before making any decisions. 📰
⚖️ Warning: This analysis is purely technical and should not be considered financial or investment advice. Always do your own research and practice risk management. Good luck! 🚀

$BTC BIG PUMPING & PROFIT TARGET 4 DONE BINANCE:BTCUSDT BIG PUMPING & PROFIT TARGET 4 DONE
Chart Analysis ( CRYPTOCAP:BTC )
💫NEW ATH : $108,306.16
🎆ENTRY POINT : $94428.96
🎇STOPLOSS ZONE : $90,444.77
1ST TARGET $99,762.63 🔥
2ND TARGET $102,315.06 🔥
3RD TARGET $105,501.97🔥
4TH TARGET $108,306.16🔥
Disclaimer: This article is for informational purposes only and does not constitute financial advice. Always conduct your own research before making any investment decisions. Digital asset prices are subject to high market risk and price volatility. The value of your investment may go down or up, and you may not get back the amount invested. You are solely responsible for your investment decisions and Binance is not available for any losses you may incur. Past performance is not a reliable predictor of future performance. You should only invest in products you are familiar with and where you understand the risks. You should carefully consider your investment experience, financial situation, investment objectives and risk tolerance and consult an independent financial adviser prior to making any investment.
