EURAUD Sell Hi Traders,
Keep your eyes on where my arrows are because we are anticipating a nice wave to the downside.
"MAY THE PROFIT BE WITH YOU"
Moneymanagement

#CADCHFTime range specified
Orange areas are strong and important
Support and resistance have been identified
The green areas are Target
Look carefully at the pattern
Look at the trend lines

GBPJPYhitting demand zone
fibonacci support area
________________________________________________________________________________________
Golden Trading Rules:
Big movements take time to develop
________________________________________________________________________________________
I'll be happy to read your opinion and ideas, and if you like the idea, please give it a like for support, thanks
Remember, we are speculators, not investors ;)
Have a profitable day
Telegram Contact: t.me
Supply And Demand Strategy


USDCHF what is nextWhenever we have multi lows/tops breaking is stronger than usual, as we have right now. The price has break Fibo and MA200 level and strongly continue to rise. RSI at lower time frames is overbought, which can be some short opportunity to squeeze a bit. As I see Fibonacci 61.8 will remain resistance level ( daily fibo) and Fibo 62.8 ( weekly) will remain support level. After smaller profits with sell action, my play for this will be SELL at 1.00 area and compounding those trades with proper money management. For those who can afford:
10k at 1.00, 25 k at 1.01, 50k at 1.02

#OILSupport and resistance have been identified
Time range specified
Look at the trend lines
Look carefully at the pattern
The green areas are Target
Blue areas are important and strong

US30 30/09/2019Hello Traders!
We play with Smartmoney concepts, that means that we look mostly on PA to determine what will happen in future.
As we all know, price is moved by BIG players: Banks, Institutional traders, HFT bots (we call them all of them SM).
They can't play as we do, cause of a HUGE lot sizes, so cause of that they need to SELL to BUY and BUY to SELL for positioning them self in the best possible spot.
If u were learn about trading from free and accessible knowledge, u probably heard about BUYing LOW and SELLing HIGH?
So SM must BUY LOWER and SELL HIGHER :)
We as retail traders are just a small fish in this ocean, so we need to catch the waves which are created by SM.
CHARTS AGENDA:
SM - SMART MONEY
PA - PRICE ACTION
BITCOIN SIGN - MONEY POCKET
ARROWS ARE ABOVE AND BELOW OF EQUAL HIGHS AND LOWS
BLUE LINES - ENTRIES WITH SM
MARKED LINES - POTENCIAL ENTRY POINT
BOX - GAP's
GOD BLESS U ALL!

usdtryusdtry currently consolidating between 5,6980 and 5,6580
looking for short position after breaking 5,6429

EURUSDEURUSD lot of news next week it will give small down and strong movements
1 Wait for the brake
2 Double bottom will happen
3 if brake the below it will way to go down
4. if retest the it will move to projected zone up trend

#AUDSGDThe green areas are Target
Purple ranges are important and strong
Support and resistance are specified
Time range specified
Price is within channel
Look at the trend lines

#DJISupport and resistance are specified
The green areas are Target
Red areas are important and strong
Time range specified
Price is within channel


#USOILSupport and resistance are specified
The green areas are Target
Pink areas are important
Time range specified
Look carefully at the pattern

#CADCHFSupport and resistance are specified
The green areas are Target
Red areas are important and strong and may hold the price
Time range specified
Look at the channels
Be careful with the trend line

#BTCUSDSupport and resistance are identified
Pink areas are important
The green areas are Target
Time range specified
Look at the pattern and line of trends

#GBPRUBYellow zones are important and strong
The green areas are Target
Time range specified
Support and resistance are identified
Look at trend lines and patterns

#AUDZARSupport and resistance are identified
The green areas are Target
Orange areas are strong
Time range specified
The pattern is broken

#ETHUSDSupport and resistance have been identified
Pattern prices and trend lines have broken
The green areas are Target
Red areas are important and strong
The final Target is the triangle's rule
Time range specified

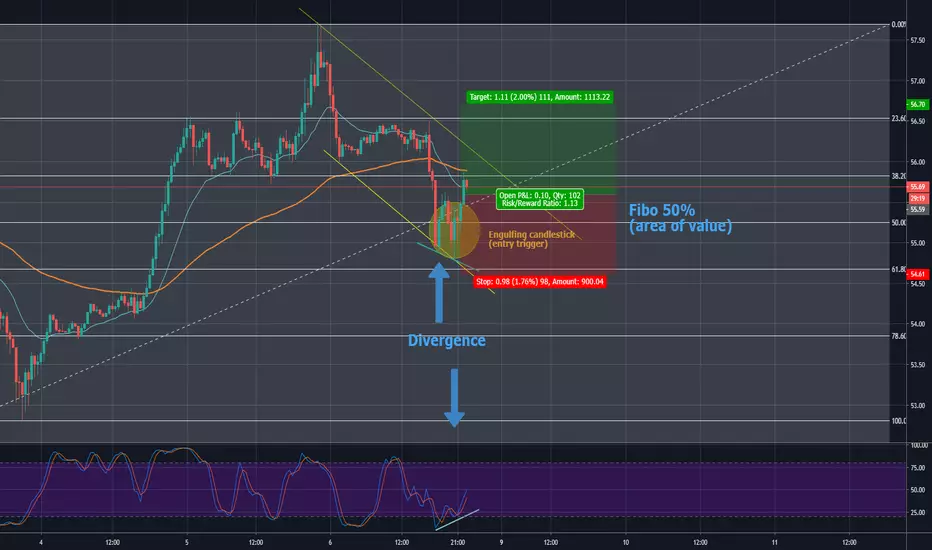
USOIL, Short term long position opportunitiesThe oil has reached its 50% fibonacci retracement level, and making a flag pattern. The entry trigger also presents itself, which is the engulfing candlestick pattern forming around the 50% fibonacci retracements (which i considered as an area of value). The other trigger is with the stochastics oscillator, it turns out that there is a divergence between the price and the oscillator, which indicates a momentarily possibility of a reversals.
To summarize why take a long position;
Pros:
1. The price reach a 50% Fibonacci retracements level while making a flag pattern (considered as an area of value)
2. There are divergence between the stochastics oscillator and the price leve (entry trigger)
3. The candlesticks forming a bullish engulfing pattern (entry trigger)
Cons:
1. 50% Fibonacci retracements area sometimes is not reliable
2. The higher time frame trends still not showing a clear trend
Considering the pros and cons, i made a decisions to go for a long position with small lot to compensate for the cons.
#SPXTime range specified
Blue areas are strong and are likely to be trapped
The green areas are Target
The price is within the pattern

EURUSD Will make a correction before NFP ?EURUSD reached a low of May 2017, bad PMI report from the US pushed a correction and this move may continue cause LONG positions on the USD are usually terminated before the NFP report on Friday.
Good Luck!

#EURAUDTime range specified
Support and resistance have been identified
Purple ranges are strong
The green areas are Target
Price is within channel
