Bullish on Bigger Time Frames.Bullish on Bigger Time Frames.
Immediate Resistance is around 126 - 127.
Potential to touch 200 is 127 is Sustain on
Monthly Basis.
On the flip side, 101 - 111 is the Support level
(if it takes pressure now.
Now it should not Break 89.
Monthlychart

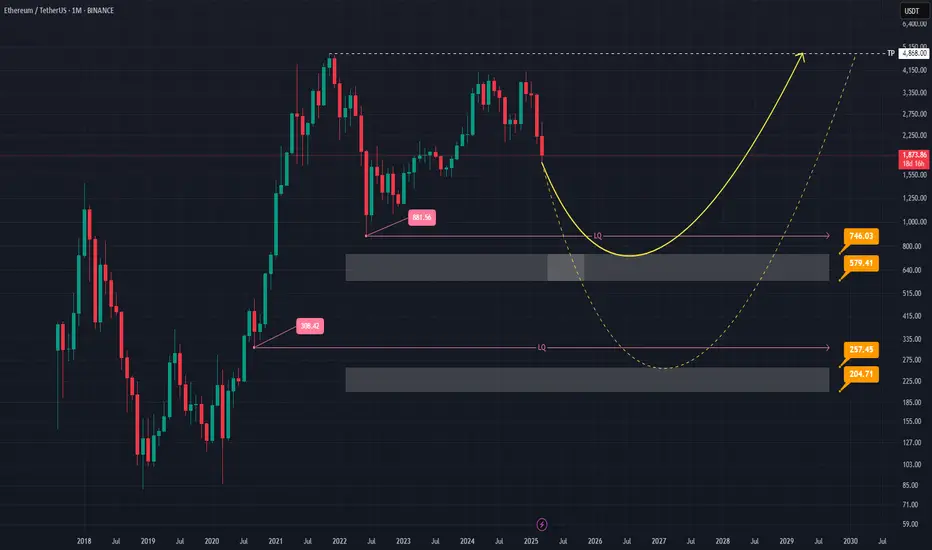
Ethereum: Rebound from here or Drop to $881?Hey everyone! Let’s explore what’s happening on Ethereum’s monthly chart. Right now, there seem to be two main possibilities to keep in mind. The first and more likely scenario involves a dip toward the lower price zones—around 881.56—and then testing important supports near 579.41 and 756.03. Observations suggest that if the price heads down to these areas, there could be a bounce, though a deeper move is possible (even if it seems less likely). On the flip side, if the price climbs from its current level toward its previous peak, we’d want to revisit this analysis for updates.
Key price zones are highlighted on the chart, showing where a lot of buying or selling could happen. A change in trend would typically be confirmed by a clear candlestick pattern and solid trading volume, so those are worth watching. As with any market, unexpected moves can always occur, so it’s good to stay prepared and flexible.
Remember, these are just observations based on the monthly chart, and personal research is always important. Stay curious, stay safe, and never hesitate to dig deeper into your own analysis before making any decisions. Good luck out there! 💼📈
Important Support level159 - 163 would be a Very Good Support Level
as this Support is of Monthly TF. So Patient Traders /
Investors may wait for this level; which seems bit
difficult (as of now) due to Bullish Divergence on
Shorter TF.
180 - 185 is an Important Resistance.

Weekly+ Monthly ViewWeekly
Recently printed HL on Weekly TF; which is intact
as long as 109400 is Not Broken.
Still Bullish but may remain Sideways unless
Crosses 117200 (Bullish) or Breaks 105000 (Bearish).
Weekly Support is around 110600 - 112200
Weekly Resistance is around 115500 - 115700

Beautifully making HH HL on Monthly TF.Beautifully making HH HL on Monthly TF.
However, Bearish on Daily TF.
a Perfect Example of Bearish ABCD Reversal Pattern,
Touched Point D & Reversed.
Now, either it should close above 1520 on Monthly basis
for a positive move probably upto 1600+
else,
the selling pressure may bring it to the Next Support
around 1300 - 1365.
In worst case, it may touch 1140 - 1145.

GOLD MONTHLY LONG TERM RANGE ROUTE MAP ANALYSISMonthly Chart Gold (9th Feb 2024)
Dear Traders,
Attached is the updated Monthly Chart Roadmap for GOLD, showcasing our meticulous analysis and 100% target accuracy since October 2023. The Golden Circle areas on the chart emphasize our precise predictions and successful target achievements over the months.
Previous Chart Highlights:
* GOLD successfully hit TP1 (2286.35) and TP2 (2603.46), with the monthly candle closing above TP2.
* EMA5 crossed and locked above the TP2 level at 2603.46, confirming strong upward momentum.
* The EMA5 detachment process was successfully completed.
* The Fair Value Gap (FVG) at 2790 provided robust support, facilitating a push toward higher levels.
What’s Next for GOLD?
This chart update includes revised entry levels, weighted target levels, and two critical GOLDTURN levels: 2742 and 2595. These levels act as strong support zones, where potential reversals may occur. If a reversal happens, prices are likely to retest any of these levels (marked in red) before bouncing back.
Pay close attention to EMA5 near the Entry Level of 2742.55. If EMA5 crosses and locks above 2742.55, it will confirm bullish momentum and make the target of TP1 (2961) achievable with ease. Although short-term bearish movements may occur, the broader picture on the monthly chart suggests a long-term bullish trend. Temporary pullbacks strengthen the trend and provide excellent dip-buying opportunities near support levels, minimizing risk.
Recommendations:
For a detailed understanding of support structures and to identify ideal buying opportunities, refer to our smaller time frame analyses, including weekly, daily, 12H, 4H, and 1H charts. These provide actionable insights while aligning with the bigger picture of long-term bullish momentum.
As always, we’re committed to keeping you informed with daily updates and insights. Don’t forget to show your support by liking, commenting, and sharing this post. Stay tuned for more updates on our Trading View channel.
Trade Safe with Confidence!
The Quantum Trading Mastery

GOLD MONTLHY CHART LONG ROUTE MAP ANALYSISDear Traders,
Attached is the Monthly Chart Route Map for GOLD. Since October 2023, we have been consistently analyzing and trading GOLD with 100% accuracy in our targets. The Golden Circle Area marked on the chart clearly reflects our precise analysis and targets achieved.
The EMA5 has crossed the ENTRY LEVEL, leading to the successful achievement of TP1, followed by TP2. We are now anticipating TP3.
What’s Next for GOLD?
The FVG has provided strong support at 2535 level that caused the price to push upward to 2785 and also the monthly chart confirms that EMA5 has crossed and locked above TP2 (2603), signaling the next bullish target at TP3 (2920). While external market factors may slow momentum or cause temporary reversals, we are confident that TP3 will be reached in due time.
Once TP3 is hit, a significant correction to lower weighted levels is expected before the bullish trend resumes, as indicated on the chart.
Key Levels:
Support: 1969
TP1: 2286 ✅ (Achieved)
TP2: 2603 ✅ (Achieved)
TP3: 2920 ⏳ (Pending)
Short-Term Strategy:
We will utilize smaller timeframes (1H and 4H charts) to buy dips at key weighted levels, targeting clean 30-40 pips per trade. This strategy is most effective in ranging markets, avoiding extended holds that may be exposed to high volatility.
Long-Term Bias:
Our outlook remains bullish, viewing market drops as buying opportunities. We will continue to leverage predefined levels and setups for optimized entries in smaller timeframes.
🔺 THE QUANTUM TRADING MASTERY 🔺

BAD Idea Ai up 100% from lows/please DYOR (do your own research)CRYPTO:BADUSD BAD month break out.. up or down??
Draw a line on the chart and see the triangle..
BAD Idea Ai monthly chart please dyor (do your own research). ^

A clue of where xrp can head based on it being a fractal of 2016Ok this will be a slightly extensive dive into how the current breakout move from the multi year triangle that xrp just broke out of has a high probability of being a fractal of the triangle pattern breakout move xrp did in 2016 that yielded explosive parabolic bullish price appreciation. I want to start with this image on xrp on the Monthly chart to show how the first monthly candle that confirmed the breakout of the 2016 triangle went up 287 percent and the first monthly candle confirming the current breakout went very similarly to around 283%. So since we already have it following that same pattern there, I’m gong to extrapolate where price could head from here if we are needed mirroring that same explosive move of 2016 with our current price action. If so, the very first spot XRP had a pullback and then consolidated into a bull flag before heading further up was actually at the 1.038 fib level which is just 13% or so above its previous all time high. If we were to do something similar today we could see xrp’s first real significant pullback consolidation around $3.75-$3.77. This is in line with certain chart patterns breakout targets I have in mallet time frame charts that I don’t have shown here. Other chart patterns in those smaller time frames have a targets around $3.80, $3.84 and some as high as $4.06 and then on the logarithmic chart as high as $4.77-$4.85. I think even as high as $45 would still fall in line with a standard deviation away from the 1.038 fib and would still retain the fractal if we were to reach the top logarithmic target before having that first pull back. We can see on the left of the chart above on the first triangle breakout, after it moved on from the 1.038 level the net level it rose to before the first significant correction s all the way up at the 1.618 (in blue). If Xrp were to maintain the fractal in current price acton then the 1.618 should be its destination to before the first ajar correction, and as you can see the 1.618 for the current Fibonacci retracement is all the way up at around $26!

Symmetrical Triangle on the XRP Monthly chart ready to breakout?This Triangle can also be seen well on the weekly…and also valid on the daily chart but you have to scroll over to see the whole triangle on the daily. I chose the monthly chart for this idea though because it’s the easiest one to see all the key valid touches on both the bottom and top trendlines of the triangle.That bottom trendline has been holding for 3 years now and is super strong support. We just had a flash crash on the daily dip down below it and threaten to trigger what looks like a h&s on the daily chart (not shown here) however that was quickly bought up and with very little volume to show is looking to be a classic fakeout breakdown/bear trap. Still a decent amount of hours left in todays daily candle but as long as that candle closes green it is a very good sign that this triangle will likely be breaking upwards. *not financial advice*

Monthly chart triangle XRP is reaching apex We can see this monthly triangle that xrp has been forming since 2020 is nearing an apex. We can also see that, barring some sort of black swan, XRP is fairly unlikely to stay above 40 cents based on the extremely solid support of the triangles bottom trendline and the fact that the monthly 100 ma is now overlapping that trendline for double reinforced support. The top trendline has the 3 touches needed to be a valid line so it is suggesting a measured move of over $2. Of course being a monthly chart pattern it would likely take may months to reach the full target. *not financial advice*

Updated monthly chart of the XRPUSD Symmetrical TriangleWe just had a big correction in the crypto markets and like clockwork the bottom trendline of this symmetrical triangle held exact support on the bottom wick of the current monthly candle. Will be interesting to see if that holds ultimate support as often right before a pattern breaks up there is a big pullback in price action similar to an archer pulling back their bow before releasing the arrow and letting it fly forward. So it’s also quite common to see price dip below the bottom trendline of a pattern right before the breakout upwards. Meaning, there’s still an opportunity for a correction that dips below this triangle before the break upward which would be a nice opportunity to accumulate a little at a discount if it were to occur. Either way the current dump we have experienced gives me confidence that a breakout is right around the corner. On the linear chart the breakout target for the triangle is right around $2.36-$2.40. The logarithmic measured move has us eventually reaching a target of around $11.47 or so but that is likely to take a fairly longer amount of time to reach the target of. I posted another chart of this triangle logarithmic mode and will link that chart link down below. *not financial advice*

An update on the monthly log channel chart from AprilI posted this chart idea originally all the way back in april when I discovered that all the major tapas and bottoms of the market since the 2017 top until now are all in a very clear set of rising channels seen best on the 1 month log chart as shown here. We can see since that time in April, Bitcoin has now broken back upward and is very close to retesting this super strong trendline just above it currently around 47-48k. This trendline is likely to be significant resistance, however there is a chance during a moment of extreme fomo where we could break above this trendline and retest the lighter green ascending trendline with a wick which is currently sitting around 56-58k on the current monthly candle. Ultimately my guess is the trendline just above current price action at the 48k zone is likely to maintain candle body resistance and lead to the next big market correction. It may even maintain wick resistance too but I still believe we can possibly wick above it and retest the trendline just above it with a wick before ultimately closing whichever candle gets above it’s candle body below the 48k trendline. Once this happens, the first zone I’m going to be watching to hold support is at the 1month 50ma shown here in orange. There’s a decent chance we could correct even lower than that but that will be the first zone I watch for a potential reversal back into the uptrend. For now though I think it’s completely possible to go as high as the 56-58k zone with a wick while still maintaining the trendline just above this current area as resistance but I wont be surprised if that trendline at 48k is so powerful we cant even get a wick above it either. Both seem quite probable to me at this point. I am going to attach a link to my original channel idea on this update as well so you can see where this channel discovery originated from. *not financial advice*

3 potential targets for the xrpbtc triangleUpon closer look, I feel like only giving one potential top trendline for the triangle pattern on the monthly xrpbtc logarithmic chart is ignoring some other possibilities so I wanted to ost 3 other top trendline possibilities s well with this chart. Surely one of the will be the ost valid although they potentially all could be validated. *not financial advice*

Something very peculiar is occurring with XRP dominanceUsually when the candles go upward on the xrp dominance chart, the btc dominance chart is going downward and the liquidity along the xrp dominance chart go up is coming from bitcoin liquidity. This time however something has changed. XRP dominance is rising substantially all while bitcoin dominance is also still rising. This suggests that the liquidity is no longer coming from btcoin but instead from other sources likely institutional investors. We can see the candle on the monthly has broken above the neckline of a large inverse head and shoulders pattern on the logarithmic chart. Will be interesting to see how well this plays out. Chart patterns don’t behave as they usually do when working with these kind of charts so it’s no guarantee what looks like a bullish breakout currently will behave like one. I will definitely be keeping an eye on this as it develops though *not financial advice*

XRPBTC breaking up from triangleYou never know when chart patterns will behave roperly when you are on the xrpbtc chart. Often times all bets are off on the usual chart pattern expectations with this pair. Suppose we were to actually follow through with the measured move breakout target from this blue triangle xrpbtc pears to be breaking up from well it would put price action even noticeably higher than the all time high between this pair that was set back in 2018. Let’s see if for once price action behaves like it’s supposed to herewith this pair. *not financial advice*

XRPBTC breaking up from triangleYou never know when chart patterns will behave roperly when you are on the xrpbtc chart. Often times all bets are off on the usual chart pattern expectations with this pair. Suppose we were to actually follow through with the measured move breakout target from this blue triangle xrpbtc pears to be breaking up from well it would put price action even noticeably higher than the all time high between this pair that was set back in 2018. Let’s see if for once price action behaves like it’s supposed to herewith this pair. *not financial advice*

4 potential top trendlines for monthly log chart xrp patternXrp has some sort of bull pennant that it has been forming since the 2018 top and there are at least 4 potential top trendlines for it which I have showcased here with different colors. The green top trendline would be if the most valid pennant is an ascending triangle, the light pink line is for a cup n handle pattern, the brown trendline is jut connecting the two red wicks, and the teal trendline is there because it was able to connect 4 key wicks. The purple trendline is the top trendline of a smaller triangle inside the pennant that has a breakout target of around $12 which means once it breaks out and its getting quite close to its apex, the momentum it brings on the way to its measured move target will take us well above the highest of all these potential top trendlines causing the chain reaction of the larger pennant validating its breakout as well. This is a monthly chart timeframe of course though…so even though the inside triangle with the purple top trendline is nearing its apex that breakout from that triangle could still be very possibly 1-3 more months away. I get the feeling around the time of the automated market maker amendment being implemented(march 22nd) we could see price finally leap up out of the triangle, if so I’m expecting a very bullish april for xrp The good news is the highest price for any of these potential top trendlines currently is around $1.56-1.58 or so and is not gonna be getting any higher so once we flip that price zone to solidified support then we can look forward to validating the breakout on the big pattern, and the fact that it’s a pennant means we will have 2 targets to look for in the long run: 1 for just the flag portion and then a much higher one based on the height of the pennant’s pole. I left the price target of the poles measured move target(in neon yellow) out of the frame of this chart idea but you may be able to drag that part of the chart down into the frame with your mouse or touchscreen if trading view still lets you. The reason I left it out of the frame is because I wanted to be zoomed in close enough to the flag portion of the bull pennant itself to be able to clearly see how the candles move in the coming months whenever I pull this chart back up and click the play button. *not financial advice*

Xrp moving above highest top trendline of linear trianglesThese triangle trendlines are most accurate looking on the monthly chart. I wll also post a weekly timeframe version of this chart and a daily time frame version thats zoomed nto the top green trendline so you can see how we have 3 consecutive daily candle closes above this extremely pivotal trendline and now officially have closed one weekly candle close above it too. Seeing as how the trendlines of the green triangle seem most valid on the monthly time frame however, i think the most important candle close will be once we have a 1 month candle closing a portion of the candles body above the line and the follow up monthly candle also holds the line as solidified support. This is such a major trendline to flip to support and as you can see, the breakout target for the green triangle of $3.75 is actually right around the same breakout target as the yellow triangle of $3.70 that’s very strong bullish confluence that should help increase the probability of hitting those targets as it has twice the bullish momentum potential as just one of the patterns would have. *not financial advice*

BTC’s logarithmic bullflag targets on the monthly chart Shown here are the two bull flags that have formed since the last bull market top. Since this is on the logarithmic chart, there’s no guarantee that we can hit any of these breakout targets in the current bull market, however the smallest flags breakout target of around 199k has a much higher probability of being reached in the current bull market than the others. That being said, there is still a chance we could hit one of the 2 potential targets for the 2nd bigger flag, and even hit the highest target shown here as well which is a breakout target from a flag from 2 full bull markets ago that hasn’t yet hit its full target. Considering that logarithmic chart patterns from the higher time frames (monthly and higher) usually tend to take 2 bull markets to be reached so that does slightly raise the probability that we could hit that highest target this bull run as it is 2 bull runs after that flags breakout occurred. This probability is bolstered also by the fact that the bull flag prior to that one only took 2 bull rackets to reach its target as well.Whatever the outcome, I feel fairly confident that if not this bull run we should definitely be able to reach the 280k target by the next bull market and also very likely to reach the highest target by ext bull run as well since then it would be 3 full bull markets since that flag confirmed its breakout. Patterns worth keeping an eye on anyways regardless of how long it takes for them to reach their full targets. *not financial advice*

Bitcoin’s entire history is just a series of bullflag fractalsOn the entire bitcoin history index monthly logarithmic chart we can see how Bitcoin is nothing but bullflags. The second bullflag we broke up from took 2 bull runs to hit its full breakout target. The first one however because of how insanely long its pole is, has still yet to hit its full breakout target. It is now the 4th consecutive bull market since it broke out of the first flag though so perhaps it will reach that target this bull market, if not this market I’m confident the 1st flag will finally reach its full target next bull market. The second bull flag in the fractal series was able to hit its full target within 2 bull markets which is typically about the pace the huge macro patterns on the logarithmic chart tend to take. The other Flags since that second flag also are yet to hit their full targets but if the next flag in the series is also able to hit its full breakout target within a 2 bull market timeframe, the flags after it will also have to hit their targets as well on the way yo hitting that 3rd flags breakout target. We can see each flag seems to be getting progressively smaller as the fractal continues so odds are good the time it takes each flag to reach its full breakout target should also be getting progressively smaller as well so that would make sense. Anyways I just wanted to post a new version of the entire bitcoin history’s bullflag fractal so i could easily reference t and follow its progress for the current bull run *not financial advice*

XRPETH chart may finally be ready to reclaim some gainsIf price can get above the monthly 50MA here (in orange), and flip it solid support for a candle or few, we should see xrpeth confirming the breakout from this monthly chart falling wedge and then heading up to reach the measured move target posted here. This is a logarithmic chart. *not financial advice*

Potential Macro Channel on Bitcoin to keep an eye onThis ascending channel on the monthly chart has both pi cycle tops from the last two bull runs as key touches on the top trendline. The bottom trendline has lots of important key touches too. If we break above my other big wall of channels which I have posted in a previous idea, thie top trendline of this channel would be the next price I would be looking for for a potential bull market top. By next month the top trendline of this channel wlll be around 240k. The other wall of channels I have posted in the past has a current top trendline around 120k so it would definitely ahve to find aay to break up from that one first to have a chance to retest the top trendline of this one. Gonna keep a close eye on it. *not financial advice*
