Solana’s Cup&handle, Bullpennant, & symmetrical triangle targetsSolana already with a strong green candle on the Daly right now as price action is currently above the brown rimline of the cup and handle. Will be interesting to see how quickly it is able to confirm the breakout, still not completely validated yet but looking promising on the daily chart(not shown here). Since these patterns seem most valid on the monthly time frame it is going to take more than just one bullish daily candle close to confirm the breakout most likely. *not financial advice*
Monthlychart

The Monthly has a bullish pennant with an even higher targetThe same bullflag on the weekly chart that has a 99k breakout target morphs into a bullish pennant with an even longer flagpole on the monthly chart. If the bullish pennant were to confirm a breakout in the zone price action currently resides in, the breakout target for this monthly bullish pennant is around 115.9k! *not financial advice*

Analyzing Bitcoin Monthly Candle ClosesA lot of notable traders are calling for Bitcoin to drop to 44k or even to around 20.5-21.5k towards an unfilled daily CME chart gap (see daily CME chart below).
Before getting into my thoughts about whether or not we move up or down here, let's remind ourselves of some things:
1.) Bitcoin made its first new ATH back in March 2024, after closing right around the previous Oct 21 ATH in February this year.
2.) Let's also take note of two significant previous monthly ATH candle closes from 2021:
March 21 Monthly Close - 58.8k
October 21 Monthly Close (Previous Monthly ATH - approx 61.3k
Recap of this year
Next, a recap of what has happened since March 24's ATH:
April's monthly candle closed just below that high, but above the March 21 high, losing the Oct 21 level that was broken in the previous month.
Then in May, it reclaimed that Oct 21 high, held it for 2 months, and then lost it again in August with a stronger re-test of the March 21 high, and the strongest wick below it yet... but still closing just above it.
Just after August, the September monthly candle yet again reclaims the Oct 21 high, but is now re-testing that area again this year, also in October again and with 21 days left to go until the monthly close.
So what happens next?
Scenario A - October monthly candle closes above 58.8k, we could still see wicks lower than the one in August, and we could see levels like 44k or even lower prior to close. Remaining above 58.8k still gives Bitcoin a chance to reclaim 61.3k and move up in the months that follow.
Scenario B - October monthly candle closes above 61.3k, with a 2nd reclaim of the Oct 21 ATH, we likely move on up to test or even break this year's ATH.
Scenario C - October monthly candle closes below 58.8k, if November doesn't quickly reclaim that level or 61.3k, we likely see 44k or lower, and may even revisit the unfilled CME gap on the daily chart.
Daily CME Gaps Chart:

Bullflag On Monthly Log Chart for LINKUSD has a target of $55.4For now this seems very achievable. This is a monthly chart pattern so this could take ome time to reach the target even after a breakout were to be confirmed. *not financial advice*

AVAX Hidden bullish divergence Dear reader,
I can see an hidden bullish divergence on Avax on 1month timeframe. I saw more on lower timeframs.

But GBPUSD Macro chart ( monthly time frame)Strong buy Signal for GBPUSD on monthly time frame.
Entry : 1.329
Take Profit ; 1.400
Stop loss : 1.295
Buy Signal on macro chart can also be traded on 4H time frame by using MACD (12,26,9) by buying on each buy Signal with proper money management as per your account size. For 100 USD account only 0.01 lot size is recommendable. Similarly for 500 USD account size 0.05 lot size can be used.
Take trade on each MACD bullish cross over on 4H time frame with SL & TP same as mentioned above for monthly chart
Enjoy profit on huge trade signal
Thanks!

Prism Johnson Ltd: Major Resistance Breakout with Strong Bullish📊 Prism Johnson Ltd - Technical View
🔍 Daily Timeframe:
Resistance Trendline Breakout 🚀
Huge Bullish Green Candle with significant volume 📈
📅 Monthly Timeframe:
Breakout of a long-term Resistance Trendline (since 2008) with massive volume 📊
📈 Indicators:
MACD: Buy Signal ✅
Oscillators: Buy Signal ✅
📉 Key Levels:
Stoploss : 190
Target 1 : 235
Target 2 : 245
Target 3 : 285
Disclaimer : "Please do not base your trades solely on the ideas mentioned above. Conduct your own research before making any trading decisions. We are not responsible for any financial losses that may result from applying this study or from taking any early entry or exit in trades."
#StockMarket #TechnicalAnalysis #Breakout #Bullish #PrismJohnson #Trading

It looks like we are ready to go long! 🚀 #Bitcoin Monthly Chart Update 🚀
After breaking out from its previous all-time high, #BTC is now retesting that key level.
The current monthly candle looks solid, showing signs of strength! 📊
This could be the beginning of a major move upward, in my opinion. 💡
What are your thoughts on this setup? Drop your views below! 👇
#Crypto

KOMODO ⭐ Long Term Spot PlanHey guys!!
Well this is a coin request and I'm glad to be able to share my views on this project. As I've marked in the chart, I placed icons to help notice important areas to take actions from.
Reality is that this coin is under a ranging market at the moment but based on ALL TIME flow, this is still bullish as its structure has never been broken (0.14 - 0.13) -> BEST possible prices to have ever bought this coin at.
1) BUY icon for the buy zones displayed in yellow rectangles. I believe these areas are great to take a spot position. You can also buy the breakout of the range if you want to secure the bullish reversal bias OR if you like it hard, take a risk and buy support hoping that it would eventually break the range.
2) If the purple line gets crossed that would mean a strong bull market may just be taking place by that moment and if that happens HOLD for the ultimate target the ALL TIME HIGH.
3) Long term targets to take partial profits as price gets there:
1 dollar
4 dollars
12 dollars
It could take months and a really long time but when the bull run begins this is going to fly to targets marked above and could even go BEYOND.
Tip of the day: Have a plan to manage assets and money properly. If you got stuck in the wrong side of the trade, don't worry, it happens to the best of us. There's always a chance you could still get a chance to buy lower, just be alert and patient.
Keep it shiny ⭐
Kina, The Girly Trader

Birlasoft retestBirlasoft breakout retest on monthly time frame. It can give good returns in the years to come.

GULFOILLUBE Buy active above ATH / CUPGULFOILLUBE Buy active @ 1,144.00 and presents an opportunity for a long trade with a promising risk-reward profile. The strategy involves entering a position at 4% above the ATH and employing a dynamic stop-loss approach to manage risk and maximize potential gains.
Buy active at GULFOILLUBE's ATH price + 4% (1,144.00)
Initial Stop-Loss: Set an initial stop-loss at 20% below the entry price (915.20) or Weekly Swing Low
Targets:
First Target: 1,546.45 (Fibonacci 1.618 level)
Second Target: 1,822.40 (Fibonacci 2 level)
Third Target: 2,544.80 (Fibonacci 3 level)
Position Sizing: Limit the trade size to ensure that no more than 5% of your capital is at risk. In case the stop-loss is triggered, the maximum capital loss will be limited to 1%
The dynamic stop-loss adjustment after reaching the first target further protects capital and locks in profits.
The position sizing ensures that you are not risking more than you can afford to lose.
Disclaimer:
This trading strategy is for informational purposes only and should not be construed as financial advice. Please conduct your own research and due diligence before making any trading decisions.
Additional Notes:
Consider using technical indicators and chart patterns to refine your entry and exit points.
Monitor market conditions and adjust your strategy accordingly.
Practice risk management techniques to protect your capital.
Please let me know if you have any other questions.

HUHTAMAKI : ATH / CUP BREAKOUTHUHTAMAKI is currently trading around its all-time high (ATH) and presents an opportunity for a long trade with a promising risk-reward profile. The strategy involves entering a position at 4% above the ATH and employing a dynamic stop-loss approach to manage risk and maximize potential gains.
Entry: Enter a long position at NFL's ATH price + 4% (388.75)
Initial Stop-Loss: Set an initial stop-loss at 20% below the entry price (311.00) or Weekly Swing Low
Targets:
First Target: 513.10 (Fibonacci 1.618 level)
Second Target: 599.20 (Fibonacci 2 level)
Third Target: 824.60 (Fibonacci 3 level)
Position Sizing: Limit the trade size to ensure that no more than 5% of your capital is at risk. In case the stop-loss is triggered, the maximum capital loss will be limited to 1%
The dynamic stop-loss adjustment after reaching the first target further protects capital and locks in profits.
The position sizing ensures that you are not risking more than you can afford to lose.
Disclaimer:
This trading strategy is for informational purposes only and should not be construed as financial advice. Please conduct your own research and due diligence before making any trading decisions.
Additional Notes:
Consider using technical indicators and chart patterns to refine your entry and exit points.
Monitor market conditions and adjust your strategy accordingly.
Practice risk management techniques to protect your capital.
Please let me know if you have any other questions.

GLENMARK : ALL TIME HIGH BREAKOUT / CUP BREAKOUTGLENMARK is currently trading around its all-time high (ATH) and presents an opportunity for a long trade with a promising risk-reward profile. The strategy involves entering a position at 4% above the ATH and employing a dynamic stop-loss approach to manage risk and maximize potential gains.
Entry: Enter a long position at GLENMARK's ATH price + 4% (1,313.40)
Initial Stop-Loss: Set an initial stop-loss at 20% below the entry price (1,050.70) or Weekly Swing Low.
Targets:
First Target: 1,913.45 (Fibonacci 1.618 level)
Second Target: 2,364.15 (Fibonacci 2 level)
Third Target: 3,465.40 (Fibonacci 3 level)
Position Sizing: Limit the trade size to ensure that no more than 5% of your capital is at risk. In case the stop-loss is triggered, the maximum capital loss will be limited to 1%
The dynamic stop-loss adjustment after reaching the first target further protects capital and locks in profits.
The position sizing ensures that you are not risking more than you can afford to lose.
Disclaimer:
This trading strategy is for informational and educational purposes only and should not be construed as financial advice. Please conduct your own research and due diligence before making any trading decisions.
Additional Notes:
Consider using technical indicators and chart patterns to refine your entry and exit points.
Monitor market conditions and adjust your strategy accordingly.
Practice risk management techniques to protect your capital.
Please let me know if you have any other questions.

Monthly Chart Breakout - Positional Trade - VEDL📊 Script: VEDL
📊 Sector: Mining & Mineral products
📊 Industry: Mining / Minerals / Metals
Key highlights: 💡⚡
📈 Script is giving Breakout of double bottom neckline on Monthly chart, we may see some good rally.
📈 One can go for Swing Trade.
⏱️ C.M.P 📑💰- 414
🟢 Target 🎯🏆 - 504
⚠️ Important: Always maintain your Risk & Reward Ratio.
✅Like and follow to never miss a new idea!✅
Disclaimer: I am not SEBI Registered Advisor. My posts are purely for training and educational purposes.
Eat🍜 Sleep😴 TradingView📈 Repeat 🔁
Happy learning with trading. Cheers!🥂

Bullish confliuence on the btc falling wedge & bear flag targetsWe can see here if price action can break above the top trendline of the chartreuse bearflag by next week and then hold that trendline as solidified support, thereby confirming the bullish breakout, that the measured move of the break out would be identical to the measured move of the bullish breakout of the monthly pink falling wedge pattern. This is very encouraging bullish confluence. The wedge being on the monthly time frame is more powerful than the bearflag which is on the weekly timeframe and the wedge has already confirmed a bullish break greatly increasing the likelihood that the bearflag which is a weekly timeframe pattern will also have a bullish breakout. To add to this the flag of the bear flag is a falling channel and those types of channels tend to break bullish far more often than they break bearishly. Bearflags usually only break up instead of down at the end of a downtrend or beginning of an uptrend as well, so if it does break up it is a very good sign that bullish momentum has control. One last thing that increases the probability of a break upward instead of downward is the measured move target for a break down from the bearflag is an impossible low negative number. All this combined I think we should see it break upward, but for the target to identically match the wedge target it is gonna need to break above the channel of the flag by the next 2 weekly candles. If this can happen then we are pretty much guaranteed the bottom is in. *not financial advice*

XAUUSD for +50%?OANDA:XAUUSD is making the same pattern that 50% before so I think we might be able to 50% again. the market is already broken out and is looking super bullish. Using this triangle pattern we can see that price is broken out and shooting to the upside with great momentum and volume.

ASTRAL MONTHLY BOX BREAKOUT🔍 Chart Analysis: ASTRAL - Monthly Time Frame 📈
🚀 Monthly Range Box Breakout!
📉 After 7 months of trading in a tight range, Astral has finally broken out on the monthly time frame! 📊 This breakout suggests a potential opportunity for an upside move and profitable gains. 📈
🔥 Trade Setup:
CMP (Current Market Price): 2069 💹
SL (Stop Loss): 1890 🛑
Targets: 2355 🎯, 2652 🚀
🌈 What's a Range Box Breakout?
Imagine a coiled spring 🔄 - that's what we've been seeing in Astral's chart for the past 7 months! Now, with this breakout, the potential for an explosive move to the upside is on the horizon.
🚨 Trade Strategy:
📈 Confirm the breakout on the monthly chart.
⚖️ Set your stop-loss strategically at 1890.
🎯 Targets locked at 2355 and 2652.
💡 Why is this noteworthy?
📊 Breakouts from tight ranges often lead to substantial moves.
🚀 Monthly time frame signals a potentially significant trend change.
📉 Opportunity to ride the upward momentum for profitable gains!
📈 Disclaimer: Trading involves risk. Always do your research and utilize risk management. Not a SEBI registered analyst.
👉 Your take? Excited about this breakout potential? Share your insights below! Let's engage and learn together! 🤝💬
#ChartAnalysis #StockMarket #TechnicalAnalysis #Astral #TradingOpportunity #BreakoutAlert 📊✨

USDT.D Analysis: $ Dominance Dips, Opening Doors for Crypto?Hey traders,
Let's dive into Tether Dominance CRYPTOCAP:USDT.D and see what it might mean for the crypto market.
Channel Cracked:
USDT.D used to chill in a monthly channel for a while. But recently, it decided to break free, potentially paving the way for a continued decline in dollar dominance, reaching the next weekly resistance level.
RSI Bouncing Back (Maybe):
The Relative Strength Index (RSI) just stepped out of the oversold zone. This could signal a potential price bounce or a period of consolidation (think of it as the market taking a breather).
Crypto on the Rise?
As long as dollar dominance keeps falling, more money might flow into cryptocurrencies, potentially pushing their prices up.
Bitcoin's Buddies:
If this dollar decline happens alongside Bitcoin price fluctuations and a dip in its own dominance, we could see altcoins surge in an epic way!
The US Dollar Factor:
One big question mark: how will US policies affect the dollar's value and, in turn, crypto prices? Only time will tell.
Time to Take Profits?
If the RSI exits the oversold zone, it might be a good time to consider closing out your long positions (selling your crypto) or taking some profits off the table.
Remember:
This analysis is for educational purposes only, not financial advice. Do your own research and use proper risk management before making any trades.

ICICIGI MONTHLY BREAKOUT📈 Exciting Chart Analysis Alert! 🚀
🔍 Chart Analysis: ICICIGI - Monthly Time Frame 📊
🚀 Potential Rounding Bottom Breakout!
📉 After a prolonged downtrend, ICICI General Insurance seems to be gearing up for a major turnaround! 🔄 The chart is painting a beautiful rounding bottom pattern, indicating a potential reversal.
🔥 Trade Setup:
CMP (Current Market Price): 1711 💹
SL (Stop Loss): 1589 🛑
Targets: 2279 🎯, 2879 🚀
🌐 What's a Rounding Bottom?
Imagine the market doing a graceful U-turn 🔄 - that's the rounding bottom! It's like the phoenix rising from the ashes, symbolizing a potential shift from bearish to bullish trends.
🚨 Trade Strategy:
📈 Wait for the breakout confirmation.
⚖️ Place your stop-loss strategically at 1589.
🎯 Targets set at 2279 and 2879.
🤔 Why is this exciting?
Rare chart pattern alert!
Potential reversal play in a long-term downtrend.
🚀 Targets set for an optimistic ride!
📈 Disclaimer: Trading involves risk. Always conduct thorough research and use risk management strategies. Not a SEBI registered analyst.
👉 Your thoughts? Excited about this potential breakout? Share your insights below! Let's discuss and learn together! 🤝💬
#ChartAnalysis #StockMarket #TechnicalAnalysis #ICICIGI #Trading #Investing #FinancialMarkets 📈✨

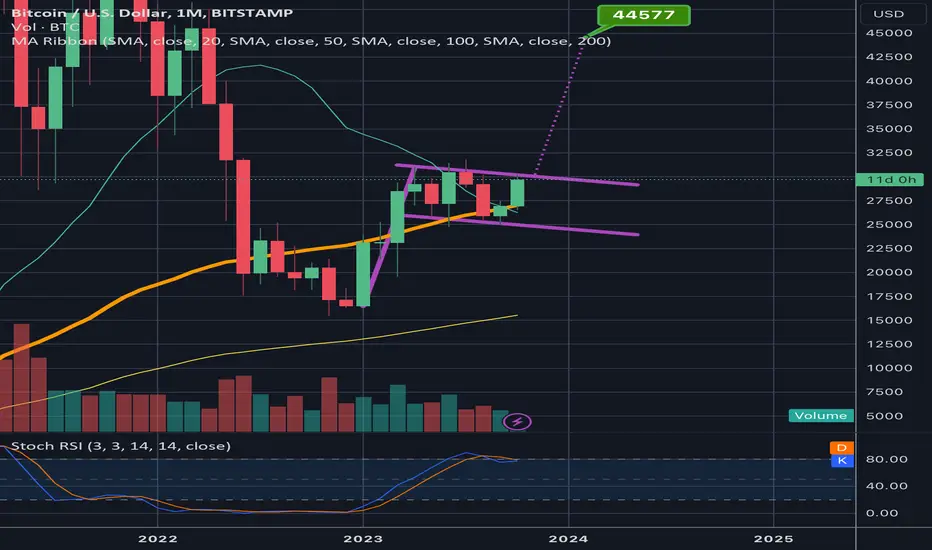
Bitcoin in a monthly bullflag that has a 44k breakout targetIf price can maintain support on the monthly 50ma(in orange) then we should likely see a breakout up from this monthly bullflag in the few candles. If so the target is around 44-45k. *not financial advice*
CANFIN Homes technical AnalysisThe stock has consolidated well at resistance level and looks set for a breakout. It has made a beautiful cup and handle pattern as well. Keep a stop below 690 and buy above 800 levels.
Disclaimer- Only for learning purpose.

GBPJPY Long 3/8 Trap Monthlylooks like a bullish outlook on the monthly charts considered executing a position for long term profits.

Prism Johnson Ltd ( LTP : 156 )Go long for prism Johnson forming inverse head and shoulder with rsi support buy on dips for the target of 250-255 holding period 1/1.5 years
