Moodeng / UsdtGATEIO:MOODENGUSDT
Nice move on **MOODENG/USDT** — structure respecting support zones well! Let's see if it pushes toward that resistance. 👀📈
**Disclaimer:** This is not financial advice. Always DYOR.
Moodeng

MOODENG/USDT Technical Analysis – Massive Breakout Incoming?
🔍 Pattern Identified: Falling Wedge – A Classic Bullish Reversal Setup
The MOODENG/USDT pair is currently forming a Falling Wedge pattern, a well-known structure that often appears at the end of a downtrend, signaling a potential bullish reversal.
Key characteristics of the Falling Wedge:
Down-sloping resistance and support lines converging toward each other.
Price action narrowing within the wedge as sellers weaken.
Often results in a powerful breakout to the upside, especially when accompanied by a volume surge.
📈 Bullish Scenario (Breakout Potential)
If the price successfully breaks out above the wedge resistance and closes above 0.25 USDT, this will confirm the breakout and open up potential upside targets:
🟡 Target 1: 0.316 USDT – Minor resistance zone and past consolidation level.
🟡 Target 2: 0.455 USDT – Major horizontal resistance and psychological level.
🟡 Target 3: 0.626 USDT – Golden Fibonacci zone and previous structure highs.
🟡 Ultimate Target: 0.78 – 0.90 USDT – The full wedge breakout projection and former top.
🔔 Ideal breakout confirmation includes:
A daily candle close above the wedge resistance.
Strong breakout volume.
RSI pushing above 60 and MACD crossing bullishly.
📉 Bearish Scenario (Breakdown Risk)
If the price fails to break out and instead falls below wedge support (especially under 0.17 USDT), it may revisit lower levels:
🔻 Support 1: 0.11 USDT – Historical bounce zone.
🔻 Support 2: 0.07 USDT – Last significant demand area before May’s breakout.
🔻 Final Support: 0.015 USDT – All-time low (high risk zone).
Still, current structure remains more bullish-biased as price consolidates near the upper wedge edge.
🧠 Market Sentiment & Narrative
This Falling Wedge is forming at the tail end of a long downtrend, with the asset showing early signs of accumulation.
If the broader crypto market sees renewed strength, altcoins like MOODENG could lead the next wave.
Smart traders spot these setups before the breakout — not after the crowd joins.
✅ Conclusion
This Falling Wedge is not just visually clean but strategically strong in terms of risk-to-reward. A confirmed breakout could trigger a massive rally with more than 200% upside potential from current levels.
Keep a close watch on the breakout level, volume confirmation, and daily candle structure. Patterns like this only appear a few times per market cycle — and they often mark the beginning of something big.
#MOODENG #AltcoinBreakout #FallingWedgePattern #CryptoAnalysis #USDT #TechnicalBreakout #ChartSetup #BullishAltcoins #CryptoReversal #TradingOpportunity

MOODENG – Wave 2 In Play, More Upside Ahead
Might be a bit bold here, but I see OKX:MOODENGUSDT pushing higher as long as it holds the 13c level.
It had a strong impulsive move, and this looks like wave 2 of the current momentum.
Daily downtrend signals from the local high have already expired, increasing the odds of continuation from here.
If momentum picks up, I’m eyeing 40–44c as a potential target zone.
MOODENG isn’t done yet!

Moodeng Set to Drop 33% with Target at 0.12500 SoonHello,✌
let’s dive into a full analysis of the upcoming price potential for Moodeng 🔍📈.
OKX:MOODENGUSDT is currently approaching the upper boundary of a strong descending channel, aligned with a significant daily resistance level. Given this setup, a correction of at least 33% appears likely, with the main target near 0.12500. Traders should watch for confirmation before entering positions. ⚠️📉
✨ Need a little love!
We pour love into every post your support keeps us inspired! 💛 Don’t be shy, we’d love to hear from you on comments. Big thanks , Mad Whale 🐋

$60 Moodeng in the next 3 weeks July will be explosive, and the rest of the year will be bloody. so enjoy the pump before a huge crash
not a financial advice

moodeng buy setup scalp & swingIf btc stays sideways till fri-sat it can hit swing tp, also during eid days I won't recommend you to take any trade due to dry volume, less volatility. It's a meme token so use tight sl and don't use high margin on this trade. Good Luck.

MooDENG price analysis😭 How “fun” you can live trading memecoins!)
First, -97% dump, and then +1600% if from the absolute bottom, or +800% of a rapid pumping)
And with all this, the capitalization of #MOODENG is only $275 million, and at the maximum it was around $600 million.
🕯 Moreover, on the OKX:MOODENGUSDT chart, they “draw” as if they want to give another upward momentum. Here's the question: to $0.40 or $0.70?
❗️ But this is an idea for spot holders!!!
Because as you can see on the chart, a -50% correction "It's not a big deal" at all, and it can liquidate longs even with x2 leverage.
_____________________
Did you like our analysis? Leave a comment, like, and follow to get more

Phemex Analysis #94: Pro Tips for Trading MooDeng (MOODENG)MooDeng ( PHEMEX:MOODENGUSDT.P ) is a playful, Solana-based meme coin inspired by a charming pygmy hippopotamus born at Thailand’s Khao Kheow Zoo. Since its debut in 2024, MOODENG has quickly captured crypto enthusiasts' imaginations, gaining prominence through explosive price surges and a rapidly growing community.
Recently, MooDeng’s market presence surged dramatically following its listing on Upbit, one of South Korea’s largest cryptocurrency exchanges. Upbit added trading pairs with KRW, BTC, and USDT, leading MOODENG’s price to spike by over 70%, while liquidity and trading volume increased by a staggering 600%, elevating its market capitalization beyond $200 million.
This newfound liquidity and heightened market attention bring exciting yet challenging trading conditions. To navigate these effectively, let’s explore several scenarios that traders should consider in the near term.
Possible Scenarios
1. Bullish Continuation (Extended Rally)
The recent Upbit listing provided significant bullish momentum, which might continue propelling MOODENG’s price upward. If buying pressure remains strong and price confidently holds above immediate support $0.165, the rally could extend toward higher resistance levels.
Pro Tips:
Monitor Key Resistance Levels: Keep an eye on critical short-term resistance zones $0.234 and $0.2676. Consider partial profit-taking at these levels to safeguard gains.
Entry and Risk Management: Look for price consolidations or small retracements as potential entry points. Always set stop-losses below recent support areas to minimize downside risk.
2. Price Consolidation (Sideways Movement)
After substantial upward movement, MooDeng might enter a period of consolidation as the market absorbs recent gains. Consolidation typically involves price fluctuating within a defined range, testing support $0.165 and resistance $0.206 repeatedly before the next significant move.
Pro Tips:
Range Trading: Implement range-trading strategies by identifying clear support and resistance levels, taking advantage of repeated price movements within these bounds.
Volume Analysis: Carefully observe trading volumes during consolidation phases. Declining volumes typically indicate a healthy pause before a potential next leg upward or downward breakout.
3. Bearish Correction (Pullback Scenario)
Following significant rallies, sharp pullbacks can occur as traders take profits, particularly in meme coins known for volatility. If MOODENG breaks below recent key support levels $0.165 with substantial trading volume, it might signal a bearish correction, returning the price toward lower support areas.
Pro Tips:
Identify Support Zones: Carefully monitor established support levels $0.133 or $0.12 for potential accumulation or buying opportunities. Significant pullbacks could present strategic entry points for long-term believers.
Stay Cautious: Avoid hastily entering trades during strong bearish momentum; instead, wait patiently for clear signs of price stabilization before taking new positions.
Conclusion
MooDeng’s recent explosive growth following the Upbit listing presents traders with numerous opportunities. By carefully monitoring outlined scenarios—considering bullish continuation, consolidation, and potential pullbacks—traders can effectively manage risk while capitalizing on MOODENG’s volatility. Stay disciplined, remain responsive to market dynamics, and always practice strategic risk management to maximize your trading success with MooDeng.
🔥 Tips:
Armed Your Trading Arsenal with advanced tools like multiple watchlists, basket orders, and real-time strategy adjustments at Phemex. Our USDT-based scaled orders give you precise control over your risk, while iceberg orders provide stealthy execution.
Disclaimer: This is NOT financial or investment advice. Please conduct your own research (DYOR). Phemex is not responsible, directly or indirectly, for any damage or loss incurred or claimed to be caused by or in association with the use of or reliance on any content, goods, or services mentioned in this article.

Beginners Guide To Winning Memecoin Trades! Moo DengMeme coins have taken the cryptocurrency world by storm, often starting as jokes but evolving into high-volatility assets that attract crypto traders seeking quick gains. From Dogecoin to Shiba Inu and now Moo Deng, these so-called useless meme coins can offer trading opportunities—if you know where to look.
In this updated crypto analysis, I will build on our previous analysis where I identified a strong monthly supply zone for Moo Deng meme coin at $0.26. If you're wondering how to trade meme coins like Moo Deng, even with little experience, this supply and demand analysis breaks it down using simple supply and demand concepts on larger timeframes.
The sell-off is trying to happen.

$HYPERUSDT Breakout in Progress Eyes on Key Levels!BINANCE:HYPERUSDT is bouncing from a strong demand zone.
If support holds, the price could target $0.1823, $0.2370, or $0.3201.
Watch for a clean retest around $0.170 to confirm the move.
It looks bullish for now.
DYRO, NFA

$MOODENG is Coiling Up AgainMoodeng is starting to move again.
If you’re up for some risk, you can enter here at cmp and DCA down till $0.26
Stoploss just below the low at 0.234
Targets:
$0.2908
$0.3042
$0.3186

MOODENG - This HIPPO will definitely FLYY!THIS IS WHAT YOU ANTICIPATE! The buys as seen below the blue box! Means its for you to buy at the right point or short now to buy at the bottom and buy at the bottom to sell at highs! All your thoughts hahhahaha!! LESGO

MOODENG - This Hippo will FLY!This is MpO for MOODENG!
MOODENG recently had a strong breakout from the dead zone (~$0.06–$0.09), followed by a beautiful volume-led rally all the way up toward $0.34. But after hitting $0.34–$0.35, we now see volume tapering and the price consolidating in the $0.24–$0.26 zone, with the POC (Point of Control) settling around $0.25. This indicates most trades are happening here — the current fair value.
Over the last few sessions, the profiles are getting balanced and tighter, which usually hints at a cooling-off period — where buyers and sellers are agreeing on price. This is not bearish, but shows the coin is building base after its pump.
What my pattern suggest is a heavy flow on the top, as most old OB will get activated! Invalidation below the green or closing below the green line!

MOODENG Up 1561% — Is a 50% Crash Next?MOODENG has gone full parabolic — launching from $0.0206 to $0.34 in just 36 days. That’s a staggering +1561% gain. But after a move this vertical, it’s time to ask the real question: can it sustain this pace… or is a correction looming?
Let’s break it down.
Technical Snapshot
MOODENG just tapped a major resistance zone — the 0.786 Fibonacci retracement (log scale) of the entire bear trend from $0.70 down to $0.0206. That drawdown was a brutal -97% over 143 days, defining the last macro bear cycle. The current rally has now retraced almost 80% of that decline.
And now? It’s knocking on exhaustion’s door.
RSI Screaming Hot
The RSI on the daily chart is currently at 96 — a level rarely sustained for long. Historically, these readings lead to sharp corrections as early bulls take profit and late buyers get trapped.
Key Structure:
The key swing high at $0.31982 was just taken out, possibly as a liquidity grab.
Price is now hovering at this level — hovering… or topping?
Potential Retracement Zone
If MOODENG enters a standard corrective phase, the $0.15411 level stands out. — it lines up as a logical 50–61.8% retracement zone from the recent parabolic leg. A return to that level would mean a -50%+ crash from current highs.
Short Trade Idea (On Confirmation Only)
Entry: Break below $0.32 and retest it as resistance
Stop-Loss: Above $0.34 (structure invalidation)
Target: $0.15411 (0.618 Fib retracement)
R:R: 7:1+
This setup requires patience. Don’t front-run it — let price lose $0.32 with conviction and treat a clean retest as your trigger.
📘 Bonus Insight:
Whenever you see extreme RSI paired with major Fib levels (like 0.786), you’re likely looking at the exhaustion phase of a move — especially when paired with psychological price levels and historical resistance. That’s where smart money exits… and emotional money enters.
🧠 Educational Note: Why You Should Be Cautious with Parabolic Moves
These kinds of explosive rallies are exciting, but they’re often unsustainable. When price goes vertical and indicators like RSI hit extreme levels, smart money starts exiting — and emotional money starts chasing.
Parabolic moves often end with sharp, sudden crashes. Chasing these tops may feel tempting, but more often than not, it leads to losses. The real edge comes from waiting — for structure, confirmation, and setups with defined risk. Don’t trade hype. Trade the chart.
Summary
MOODENG up +1561% in just over a month
Tapped the 0.786 Fib of its entire macro downtrend
Daily RSI at 96 → overheated
Break & retest of $0.32 = ideal short setup
Targeting a possible -50% correction to $0.15411
Keep your emotions out of it — parabolic runs like this are exciting, but it’s discipline that gets you paid. Let price confirm. Then strike. 📉🔥

Moo Deng Meme Coin Cryptocurrency Expecting a Sell-off Expecting a strong sell-off on Moo Deng Meme Coin Cryptocurrency after the strong monthly supply has been reached. There is a lot of profit for margin on the way down.

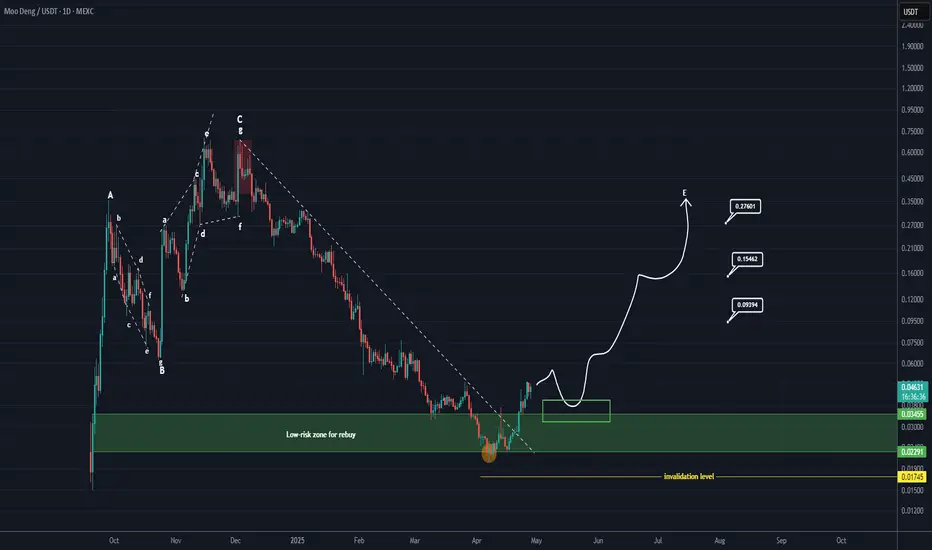
MOODENG Looks Super Bullish (1D)After a series of significant drops, MOODENG has reached a golden zone and has accumulated buy orders, which suggests that it may have established a price floor.
Given the break of the medium-term descending trend line and the strong buy orders being fed from a solid source, we expect MOODENG to start an upward trend that could last for 2 to 3 months.
The upper green box is the Rebuy area.
A weekly candle closing below the upper green box (which is our Rebuy area) will invalidate this analysis.
For risk management, please don't forget stop loss and capital management
When we reach the first target, save some profit and then change the stop to entry
Comment if you have any questions
Thank You
MOODENG - Prolonged Base to Breakout AttemptMOODENG’s chart shows textbook accumulation after a washout, punctuated by a convincing breakout through key dynamic resistances. The critical test now is whether $0.058–$0.063 will hold as support on the next pullback. If so, look for a run toward psychological $0.10; if not, this may be a false start requiring reevaluation near the base.
Let price action and volume be your guide—manage stops and size positions to respect these key pivot zones.

MOODENGUSDT 1DMOODENG ~ 1D Analysis
#MOODENG Buy after successfully penetrating this resistant line with a short -term target of at least 10%+.


MOODENGUSDT 1DMOODENG ~ 1D Analysis
#MOODENG This trade is very high risk. Buy from here or buy after successfully penetrating this resistant line. with a short -term target of at least 10%+.

Moodeng Buy/Long Setup (8H)From where we placed the red flash on the chart, it seems that a deep correction for MOODENG has started.
It appears that a diametric is in the process of completion, and we are at the end of wave G of this diametric.
As long as the SWAP range is maintained, the price could move toward the targets.
A closing of an 8-hour candle below the invalidation level would invalidate this analysis.
For risk management, please don't forget stop loss and capital management
Comment if you have any questions
Thank You

MOODENGUSDT Reversal Potential with Falling Wedge FormationMOODENGUSDT is showing signs of a potential bullish reversal as it forms a Falling Wedge Pattern , a classic setup that often signals a breakout to the upside. Traders should monitor key resistance levels for a breakout confirmation, which could indicate the start of a new upward trend. This could be an exciting opportunity for those looking to capitalize on a possible rally. Stay vigilant for price action near the wedge's upper boundary!

Moodeng/USDT Breaks Resistance: Major Rally Ahead?Moodeng/USDT has successfully broken above the descending resistance line and is moving upward, supported by the rising trendline.
If the price breaks above the marked resistance zone and secures a proper closing, it could trigger a significant upward move.
