QI waiting for Retest, then MOOOOOOOOOOOOOOOOONQI flying to Moon might not be possible
But it is necessary.
Moon

BTC.United Kingdom.Full Moon Long.&.New Moon Short Experimentlet me know your thoughts just a fun little experiment I thought i would try out...
if anyone is a fib nerd hmu I wanna work on a new fib indicator with somebody


AOA/USDT Repeating Bullish PatternKUCOIN:AOAUSDT KUCOIN:AOABTC
An altcoin I've mentioned previously on the BTC pairing has starting showing some signs of life & a pre-breakout pattern I've seen it do right before the last rally it had
Possibly an unexpected performer soon, see the BTC pair below for some further TA I've done on this pair
Expecting the USDT pair to make a run if it can break that descending res.

Possible 2x On The Way For BAL/BTCBINANCE:BALBTC COINBASE:BALBTC COINBASE:BALUSD BINANCE:BALUSDT
BAL has a fairly nice setup with a likely bullish outcome on the BTC pair, with the price ranging between a massive descending wedge & looking ready for a macro breakout which would lead to a 2x in BTC price (likely higher)
Expecting a breakout towards that .369 retracement as the likely target for the first wave on the breakout!
The USD pair is also looking bullish on the macro scale too!
Watch this one over the next days & weeks!


Only wait to till full moon #bitcoinonly wait to till full moon #bitcoin
Comment: Chaikin money flow oscillator -> if the indicator crosses the zero line upwards, it means that the price is gaining bullish momentum
NEXT FULL MOON !!!!! - August 22 -
40K SUPPORT ZONE - 22 august!
NEXT PARADE TO THE MOOON
the trend of going down from the new moon is evident. then bull moment from full moon onwards.

Bitcoin rising wedge on 4H Looks like on 4H Bitcoin is a little bit overbought. I think we are in rising wedge and if we reach $48-50k zone we can get reject and to appear big sell pressure. I still think we can reach higher levels without seriosly correction, but pullbacks like 10-15% are healthy in my opinion. We can break $50k without retest but i don't think is likely this scenario.

Bitcoin Meets Elliott Fibonacci: The Definitive CountBitcoin’s run thus far has been wild. The future will only get wilder.
Most Elliotticians predict that we are in a primary Wave 5 currently however, my big macro count differs at bit.
Firstly, let it be known that Wave 3 isn’t mandated to end at the 1.618 level. I’ve made the mistake in assuming this too many times; all bad. Therefore it’s important to actually take the time and count the waves. Also, just to put it out there, if Wave 2 and 4 are both zig zags within an impulse, I consider the count likely invalid. This is what I’m seeing in most predictions that predict we are in a primary Wave 5 cycle. It sort of irks me but to each their own. All forms of analysis is subjective after all.
Watch out for the huge drop near $110-$120K. This rollercoaster ride will not be free.

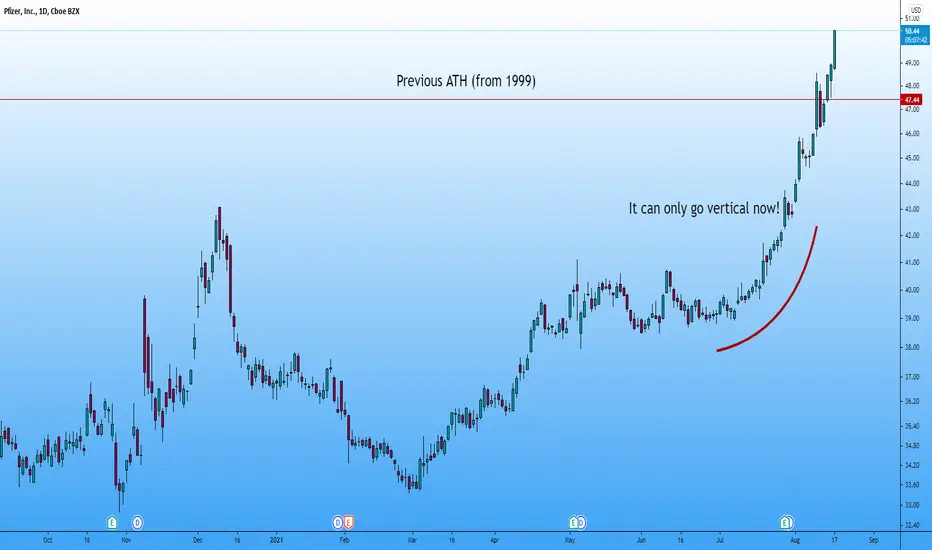
Pfizer here we go! Holding while price is green. 🚀🚀🚀Stocks trend. A lot. Much more than Forex. Pfizer is going parabolic while breaking all time high and $50, this could be the start of a big trend, or it might not.
Let's look at a few examples starting with Pfizer.
Clearly we see how with stocks we can make big multiples of our risk.
Like 25R in stocks versus 10R in Forex (for example, reality is probably close to that)
Zooming in the little impulses:
I don't know how many "casuals" are interested in Pfizer, but it is a word billions of people know.
We can look at Tesla & PonziStop:
How about another one just to illustrate?
So the question is, how to hold on but without giving back all profits?
1 solution is sell half once a stop is reached keep half with a much wider stop.
Smooths out the PnL. And this is probably what I'll do.
On a longer TF I'd look to add, here this is all a short term play, expecting the stock to go parabolic.
I am at exactly 5 times my risk (counting spreads) as of writting this.
Hasn't even been 2 weeks yet. Talk about a monster. This risk a monster correction too. Hopefully it warns before.
SOLANA TO THE MOON!cashing bois! We reached a new ATH and also our target of the wedge. I would buy more Solana at 50 dollars (when it retests the support line
Enjoy your profits!
yours Henrik

AVAX pumping to the MOOOOOOOOOOOOOOOOOONPUMP IT UPP
AVAX BULLISH SOON SUBNETS SOON LAMBO
20USD Resistence broken LETS GOOOOOOOO

Covalent is a small cap gem! Potential 10x in the coming months.Covalent (CQT) was a hyped project on CoinList with an ICO a few months ago. It has similar functionality as The Graph (GRT) and could eat it into its market cap.
Covalent has gone up 300% in the last month but has a lot more room to run - I could see this as the potential next Solana. Coinlist ICO with hype, nothing for a little bit before raging its way into the top 100 or even top 50 within a years time. It has moved from about 560 to currently 342 on CoinGecko. GRTs current market cap is $3.8 billion. CQT is only $112 million. That's 1 /33 of the market cap. Not saying CQT will take over GRT and its technology. However, the project has great fundamentals and tokenomics. Whereas GRT has struggled with price action since its ATH in February (still down 75%), CQT is back already to its listing price on Kraken and other exchanges.
I see a bright future ahead and the 300% gains for the past few weeks are just a start. As it is a small cap, do not put a great amount of your portfolio - i.e. no more than 5%. However, it could be a great long term hold that will continue to fly as the bull market continues through to next year. I could foresee Solana or Avalanche like gains to come (new projects that have shown they have great tech and will stand the test of time).


Looking for double bottom bounceThis is just for fun, don't take it seriously. We are a little bit bearish at 4H but i think we can do some bulla pattern at 38-40k zone like doubble bottom or inverse H&S

SQ just touch a bullish trendline on the daily.As you can see SQ just touched a trendline leading to the upside.
A good volume on Monday will make it bounce off that trendline and continue its uptrend.
If there is a low volume on Monday and there is bad news in the market wait for the break of the trendline and place your trade accordingly.
Get active folks!!!

XLM Deep Double Bottom BreakoutXLM Deep Double Bottom Breakout. looking very bullish XRP to the moon!

XLM So far XLM has been taking it's time consolidating along some Higher Lows. I think the moves to the right of the current graph are going to play out over the next quarter.
XLM is still kinda questionable as a whole, but it has decent support and there are no indicators of some kind of manipulation in price... I'm hoping for 1.50 before Winter for sure. It may not last long though, eyes open.

Bitcoin looking for a little pullbackI am not sure but i am looking for something like this. Rising wedge + decreasing volume and strong resistance. Will be health if we pullback a little bit to 40k.

BEWARE Bitcoin Bear-Moon / Bull-Trap at any moments notice.Bearmoon guys, it has a solid reputation for some reason, but seems to be very accurate. Maybe the moon is a WHALES call instead of the wolves for CRYPTO! ;)

Blood Magic BTC Moon CycleTechnical and celestial analysis. Analysis suggests 2 pull backs and moon shot, before the crypto winter.

Bitcoin on its way now to 50kAs predicted Bitcoin continued a short-lived correction wicking down to about 43.8k before now shooting back up and in the 46k range as of this writing. Altcoins have recovered just as strongly - ADA is crossing $2, ETH is still well over $3k. We are seeing as predicted support from the Bull market support band - a critical zone for bulls to defend if Bitcoin will go on to 50k and then 100k later this year or early 2022.
I did not call for shorting as it seemed like it would be short-lived and many were liquidated last night. I trade for overall greater movements and do not function as a day-trader. I now expect Bitcoin to rise another 10% to 50.000. I expect it will hit it within the next week or so, and definitely before the end of August. Lots of analyses provide support levels that are too low. Almost always with trading set orders slightly higher than called support levels. Anyone submitting for 42k did not get their orders filled and now Bitcoin will have a strong green daily candle and with likely rise will be buying at much higher levels.

