1000 Dollar SOLIts very possible that SOL infact reachs 1000 dollars by the end of 2025 thats 1830% from where we are now.
Personally not holding SOL or buying it , its a ticking time bomb with there security , how many times has the network gone down?
Moon

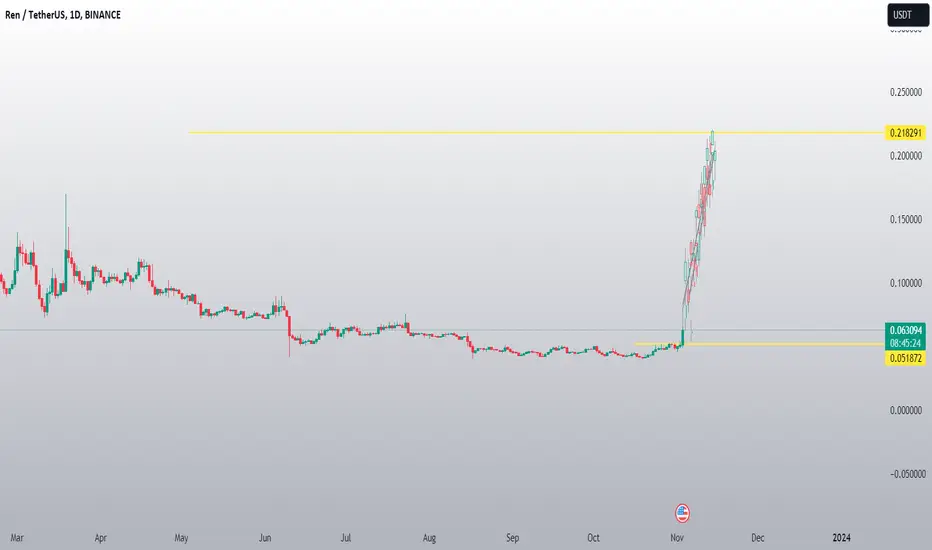
REN IS GOING TO EXPLODE AS IT LOOKSThanks for reading this update.
REN Showing high volume whale trend, and can explode with new candles in the coming time.
Unexpected volume did start, we did add before about it.
C3 AI's strong support level holding My thoughts on C3 AI is that we are in for a correction soon to the upside. We have been in a sideways market for a few weeks and I strongly believe the break further to the downside would have happen already. But due to interest rates staying the same and next year being the ultimate interest rate cut year there is a lot of upside for the whole stock market not just C3 AI. I am long on this stock because it has a lot of value in this kind of market condition. But let's be real AI is the new kid on the block and one thing we know about new kids on the block is they get pumped by retail investors causing large corporations to cover shorts lol. Let's also be more real you can already see that the shorts have been covering since the last pump this stock did they are scared. But do your own homework and when this stock hits $150 let's grab a drink cheers.

BLZ. a monster BINANCE:BLZUSDT , WEEKLY BREAKOUT
What a monster, very bullish, it already breakout from weekly view, and it will not stop at 0.2x.
Hodl for huge treasure.
Follow me for more chart analysis.
Patience is the key to success.
DYOR

BTCUSD interesting geometryHere is some interesting geometry on an outer edge ray.
- Extrema point 0 on ATH
- Extrema point 1 on PI * 27.3 (orbital period moon) High
- Break on PI
- Retest on 3.5
All within a tiny margin of error.
The time between 0 and 1 ≈ 5 moon orbits
The time between 0 and PI ≈ 16 moon orbits
You could probably draw and find proportions everywhere on either scale, but what is the chance of them relating equally on both price AND time scales?
How unique is this occurrence?
Statistically probably a unicorn event.
How great would it be, to produce analytical algorithms that find these price and time-dependent extrema points and relate them with each other via things like outer edge extension rays, to measure and test at what proportions they are broken/retested, and so change in status, to truly test how unique, predictable and structured-to-nature the market behaves.

RVN IS THE BUILDING COINRVN is the coin of the moment with building trend on day frame, this can go further on the swing trend and long term.
RVN has a building trend and can show an interesting break in the coming time frames
And same time it's the coin of the moment.
We follow always what the trend shows depending on the tools and trends we use.
RVN can shows more in the coming time.

FITFI THE 2023 WHALES INCREASEFITFI is poised to potentially experience significant growth in 2023, reaching unexpected targets. We anticipate that FITFIT may rise to $0.03 by the end of 2023.
Several factors contribute to this potential upswing, including an increasing number of holders, a relatively low maximum supply, and a modest market capitalization. From a technical standpoint, the coin also demonstrates growth potential.
Key data to watch for is the 6-month milestone, which is a crucial point in the cycle. If the coin's trajectory aligns with the cyclical plan, FITFI could potentially achieve a remarkable 519% increase in market capitalization, making it an intriguing prospect.
It remains to be seen whether FITFI can break a new level soon. Please note that this information is not intended as trading advice."

BTC October's FractalBTC October 2020 vs October 2023 Fractal
IF below 33k, accumulate 25k-30k
IF above 35k, send it to 40k
Long

ORBS $0,08 Volume IDEA ( THE BREAK)Thank you for reading our update. Please remember that this is not advice for trading.
ORBS Looks to have a new uptrend volume
It's going against the BTC trend with the possibility of breaking to $0,08 in the coming time.

KOREA IS COMING FOR ORBS : THE NEXT MOON COIN 2023Thank you for reading our update. Please remember that this is not advice for trading.
ORBS Looks to have A massive incoming Korean volume
It appears that ORBS is attracting significant attention from Korean volume with 93%, which could lead to substantial trading volume. This makes ORBS a potentially attractive coin to watch, especially as Korea aims to strengthen its position in the market.
It's important to note that while many altcoins tend to follow the general market trends, ORBS has the potential to defy expectations. If the Korean trading volume continues to rise, ORBS might experience an unexpected surge to $0.08, and potentially even reach $0.22.

BTCUSD - New Rally has BeganAs discussed back in 2021, we were watching a correction in BTCUSD taking place after a 5-impulse wave move (marked on the chart) starting wave 1 of the initial bull market rally.
The next phase was a three correction, as marked ABC on the chart. We had measured a possible level of the correct to reach around 17257 from the confluence Fibonacci retracement level. Please see my previous post from September 2021.
The 3-3- 5 wave move into this level is now complete. This level has now been reached, and we see a bullish divergence in both the composite index and RSI indicators.
The quick move of the RSI from below 40 to 70 is a strong indication that a change in direction is about to begin. The RSI is holding above 40, being the base in a bull market, while the price is forming a bullish wedge after completing a small 5-wave move within the wedge.
A break and hold above the top of the wedge will see a fast and aggressive move high as we move into wave 3 of 5 which is always the largest wave.
Hang on to your hats, as the initial rally in BTCUSD will be insignificant to the rally that has already begun. Forget the moon, aim for Pluto and beyond.

USDT.D (Full Chart Analysis-Long-Term)Hello Friends.
How are you? Hope you always be happy and successful
Today I want to talk about USDT.D
in another words, I want to talk about the dominance of Tether.
the situation is complicated.
I want to check this item based on Ichimoku, channel line, and classic pattern. so, let's go into details.
based on Ichimoku, the future cloud is getting green(positive)
Tenkensen is above Kijunsen and it's a sign to prove us the chart is bullish.
based on the Classic pattern, we have an Ascending Triangle. As you know it's a continuation pattern. and I expect this trend to continue.
if dominance succeeds in breaking 8.21% and then 8.51%, the next target will be 9.45%.
that's a border of a huge dropping in altcoins.
if dominance is able to stabilize above 9.45%, everything will be changed and the main target of this movement will be 15%
it means that you will see a lower low in all markets.
And you should expect it to drop more than you think.
it's my favorite theory. I think it will happen soon.
let me check based on the channel line in the weekly time frame.
As you can see, we are moving in an ascending channel.
we had three hits at the top of the channel and four hits at the bottom of the channel.
it means that this channel is validated.
at this time we are moving around the midline. This move to the top of the channel is expected to be around 15%.
If these three conditions occur, everything will be changed. and you can buy for example Bitcoin for around 9800-11500 USD for the first level. and maybe cheaper.
sounds great.
who doesn't like it?
🙏🙏 Please don’t forget to like 👍, follow ✌️, and share 👌 this analysis with your friends. Thank you so much for your attention and participation 🙏🙏
Sincerely Yours
Ho3ein.mnD

When will be next ATH? What will be next ATH?After every BTC reward halving, BITSTAMP:BTCUSD had always reached its new record.
It can be in a year, but I am sure that we are in the bull run which leads us to the moon.
I am also very curious if my prediction will be true.

To Uranus after the Moon (Bitcoin Chart-Art)Venturing through the labyrinthine tapestry of blockchain architecture with a symphony of algorithmic dexterity, our lunar conquest effortlessly transitioned into a transcendental odyssey to Uranus
(Bitcoin Chart-Art)

NATURAL GAS 25% GAINS IMMINENTNATGAS is lining up to break out of this bullish consolidation structure/ bull flag and reaching its next resistance zone around 3.4-3.5.
This resistance also coincides with the measured move of this bull flag.
Upon entering on the breakout my SL would be below the previous lows giving a 2-1 RR.

CFX, hot shill for breakout comming soon BINANCE:CFXUSDT
CFX's trying to breakout on daily timeframe.
Price is closed above the Tenkansen, cloud kumo is fading out.
We can try to setup a LONG position here. And it will hit: 0.15 -> 0.175 -> 0.24 in the midterm.
Do your own risk management.
Follow me for more chart analysis.
Patience is the key to success.
DYOR

BLZ, consolidating for next pump! BYBIT:BLZUSDT.P
On 4h timeframe, BLZ is consolidating in a rectangle, it's currently on its Kumo cloud (act as a support).
We can try to setup a LONG position here to catch the bounce.
This setup is a bit risky , handle your own risk management. I will by some when it retests 0.178 - 0.180 zone.
Dont forget to checkout my view on BLZ's weekly view., it's very bullish cause its major trendline on weekly timeframe already broke.
Enjoy! Moon it!
Do your own risk management.
Follow me for more chart analysis. Dont forget to check out my X and other charts.
Patience is the key to success.
DYOR

SNDL MAJOR GAINS TO BE MADESpring Backtest of old support after FAKE breakdown. Along with three rising inverse valleys.
This is a textbook play with a tight SL below the third valley and support.

TSLA is approaching a massive support trendtitle says most of it. Support trend is marked in green, and there is a high probability it bounces.
Two rejection trends are marked in red, they are weak enough that the support trend should hold.
Wait for the really small rejection trend to confirm, maybe around 236.63?? (this is my marked price, subject to change).
I would feel quite confident buying on this support trend for a nice bounce to the rejection trend, which oddly enough lines up nicely with the orange zone (current rejection area).
Lines are marked, Expect these to be zones (+/- to the next zone) where price action settles before another movement. (these are subject to change, but good to note)
Follow the trend.

Bitcoin's path for next 5 monthsI think btc will not go higher than 28k or 29k during this year.
Starting from october this year we might see more volatility accross the markets and btc's price will start moving to the downside.

GRT still looking bullish - Moon pending?GRT broke below our initial stoploss. If you followed the updates posted on the trade you would've seen that we did NOT in fact EXIT the trade at the SL and WE ARE STILL IN LONG. I've adjusted the SL since this and will update further.
The breakdown was weak and the 11c level has been tested three times since. We broke the downward trend line and have since confirmed it and looking to break the 11c mark. Once we do this we can look to be bullish for higher targets.

📊#FLM starts again, can it go to the moon again?🌕👀By observation we can see that FLM has been running in this mode for more than a year. This is a coin heavily manipulated by whales, which speaks to its high popularity.
🧠This time the RSI has appeared an unprecedented overbought state and broke through the wedge pattern, so I think the performance this time should be better.
Do you choose A to go to the moon or choose to adjust and fall back to B ?
