Gold - The Tea Leaves Say: More Downside On Deck3.5% is a lot in gold, and that's about the range of the total landslide we've been through the entirety of August so far.
It's the kind of pattern where goldbugs and USD collapse narrative nerds go long and go long or hodl and hodl but the price never goes up.
In my last call on gold from the beginning of July, I warned that $2,000 was a death trap. That call was pretty successful, coming just a few dollars shy of the target, abeit it was because the next month's futures contract settled some 2% higher.
Gold - $2,000 Is a Death Trap
And with the index markets at large, I caution that Nasdaq not breaking 15,000 is actually a real bull trap
QQQ - Is It Rally Time? Or Are You Too Early?
With gold, geopolitical risks are heightened because Xi Jinping and the Chinese Communist Party he has yet to throw away bought a lot of gold, and at relatively high prices, according to media reports at least.
And thus, because of this, a form of subtle on-the-low economic sanctions against Xi and/or the CCP can be to devalue the price of gold, which puts the central bank in a bind.
And this is a real problem for China right now with all the other economic catastrophes that land one after another, and the flooding, and the instability, and the posturing of the International Rules Based Order about war/invasion via Taiwan.
The CCP won't invade Taiwan. But China might get invaded by the IRBO via Taiwan.
You might not believe it. But give it some sober thought. Tacticians are tacticians for a reason. Hitting from the shadows and blind spots is a real useful thing.
But for Xi, he can always weaponize the 24-year persecution against Falun Dafa that was launched on July 20, 1999 by former Chairman Jiang Zemin against the entire world.
Because the whole world has been going to Shanghai to train under the Jiang faction for economic and social benefits. Which means a lot of closet skeletons. Which means a lot of data dumps can serve as weapons delivered to international media in the future.
Anyways, here's the call, friends.
Gold is obviously going down and will go down farther. It really looks like it's seeking at least the short term lows, which means $1,900 is longzo-gonzo.
And so on a dump from where we're at at time of posting to, say $1,850, you're getting 5% on a very safe short.
You can short the hole.
And 5% is a lot of money on gold.
Probably only at $1,850 can we look for reversal longs towards new all time highs.
But with how lethargic gold has been, we may very well just have seen the top on the re-run to $2,080.
Moon

VGX: INTERESTING TECHINCAL VIEWVGX showing since last week an interesting technical view which is now building a trend. There is a good chance that VGX can build further the trend.
A resistents target of $0,38 is an interesting target that this coin with time can gain.

CRYPTO WITH 96% GAINS - DASHThis is how the trade is sized up. WE posted this around a week ago stating that we would enter upon breakout, which we did at $31.3, and now are showing you further variables and the targets along with a SL

SHIBA is Extremely Bullish? (MOON soon?)SHIBA is on its way to the third poop pattern. Be prepared to fill your bags. SHIBA to the Moon!

GRT LONG - To the MOON?GRT presents a great structure on the daily with a break of the trendline and the formation of a clear head and shoulders.
First target: 14.6c
Second target: 17c
The weekly also shows a promising formation that if it plays out would bring GRT to 50CENTS.

THE BEST CRYPTO TO OWN FOR MASSIVE GAINS - BANDThe best looking Alt-coin right now is BAND.
It has a clear stop loss and has shown great strength to get above a historical support.
Below you can see the trade and it's reasoning:

MOON. Reddit toy.Not sure I understand the specific utility of this. But, for the speculation purpose, you can use it - the thing is quite volatile. The price moves in the channel, which allows you to estimate the likely area of movement.

bulish on dogehave a good week for dogecoin.
there is support era and ema 200
dogecoin have a good found and support for weeks

WORLDCOIN BREAKOUT! WLDUSDTHi everyone hope your day is going well.
Today i would lik to share my analysis on WLDUSDT.
As we can see in the chart above the price action has created a
pennant formation.
Breakout level i would lik to see WLDUSDT get above $2.45 and close a
4hr candle above that level. We are reaching the apex of this pennant. Generally
this type of a pennant would break to the downside but being that this is openai aka chatgpt's
coin the narrative is that this coin will likely skyrocket well above $5 in the next month or 2.
The coin is currently ranked 131 on coinmarketcap and i see this becoming a top 25 coin in the
next few months.
in the short term where is it headed?
In short term i think we could see a potential run up to $3.17 that is where i have my take
profit set.
Thanks, LIKE and FOLLOW for more content! LiquidMEX

What will you tell your kids-- i remember this one time?I don't know how to explain this to you in more technicaler terms. But do you see that?
Its right there. If you cant see that I feel sorry for you. If you cant see it, i guess you'll just never know.
Knowing the government is going to use it for Fednow payments, it makes no sense to not even gamble on this coin. The governments are what rule how the country is operated and they have been trying to find a way into the crypto game for a while by causing violent waves within the market just because they want to. Now that they have their own token to back themselves, yes its possible to see a pullback but what's even more possible is to see a bull run.
good luck and have fun with it, see you on the true adoption of crypto into the world.

Ethereum (ETH) Corrects After Reaching Yearly High – Will $1,800Ethereum (ETH) has experienced a corrective phase following its new yearly high on July 14.
While the price action confirms the correction, the wave count suggests that ETH will likely bottom soon, paving the way for it to resume the previous upward trend.
Daily RSI Bearish Signal
The daily Relative Strength Index (RSI) is bearish, corroborating the Ethereum price drop. The RSI is a key indicator used by traders to assess market conditions. An RSI above 50 and trending upward indicates a positive sentiment for bullish investors, while a value below 50 suggests the opposite.
At present, the RSI is falling and below 50, signifying a bearish trend.
ETH Price Prediction: How Long Will the Correction Last?
Based on the Elliott Wave count, Ethereum's price has completed a five-wave increase and is currently in an A-B-C corrective structure. This indicates that the price is currently in the C wave, which will ultimately conclude the correction. The Elliott Wave theory helps analysts understand the trend's direction by studying recurring long-term price patterns and investor psychology.
Applying a 1:1.61 ratio to waves A:C suggests a potential low near $1,780, which aligns with the 0.618 Fibonacci retracement support level. According to the Fibonacci retracement theory, after a significant price change in one direction, the price is expected to partially return to a previous level before continuing in the same direction.
Considering this confluence, it is likely that Ethereum's price correction will find support around the $1,780 level before resuming its upward movement toward $2,000.
Looking Ahead: Despite the optimistic long-term ETH price prediction, a decline below the June 10 low of $1,648 would indicate that the current decrease is not merely a correction but rather a continuation of the bearish trend. In such a scenario, the price could potentially fall to $1,450.

BEST STOCK PICK MEDIUM AND LONG TERMUA has the best possible set up you could ask for. I am in this from the entry point on the trade and will add if this support holds... I know I should've posted it earlier.
A double bottom at a critical level completing the typr two return of the bullish cypher. Along with this showing bullish divergence. On top of this the weekly looks AMAZING .
It might take a while to play out but you can't ask for a better set up.

$CING - Low Float - Positive Top Line Results - ADHD 1 PILLWe are traveling the bottom of the channel. I think it starts to move up shortly. Adolescent and Pediatric fixed dose phase 3 trials start this month and next month. FDA approval submission early/mid next year. Billion-dollar drug if it can get some funding? This is my own opinion, and you should not take any of this as financial advice.

Verge BifurcationVerge has reached a critical threshold and is transitioning towards a new stable state equilibrium.
The price is expected to reach $1+
This has been predetermined using the amplitude of excitation and critical slowing referenced in my previous video.

Is DOGEUSD bottomed in !? DOGEUSD seem to be bottomed in.. but the dip. It’s time to go to the moon.
Hold it when you buy .. do NOT sell ! I repeat DO NOT SELL .. until DOGE reach 1$ or higher
Let’s get reach this year until 2024 which means you will retire early even early age.


NVDA - PRICE TARGETS IT IT HOLD SUPPORT TODAYTrend Fib Extension targets with NVDA holding trendline from swing lows since breakout. This stock is a repeater - like setting semi-auto to burst - pap pap pap
June 2 430 Call
Jun9 420 Call
July21 500 Call
Rolled into from calls in $400 strike range that i purchased morning of earnings day. %1050 gain !@!@!@

edu can so pumpWe are waiting to receive for long or short, but the reviews give more possibility of growth, so let's be optimistic.

nice big flagWe are waiting to receive for long or short, but the reviews give more possibility of growth, so let's be optimistic.

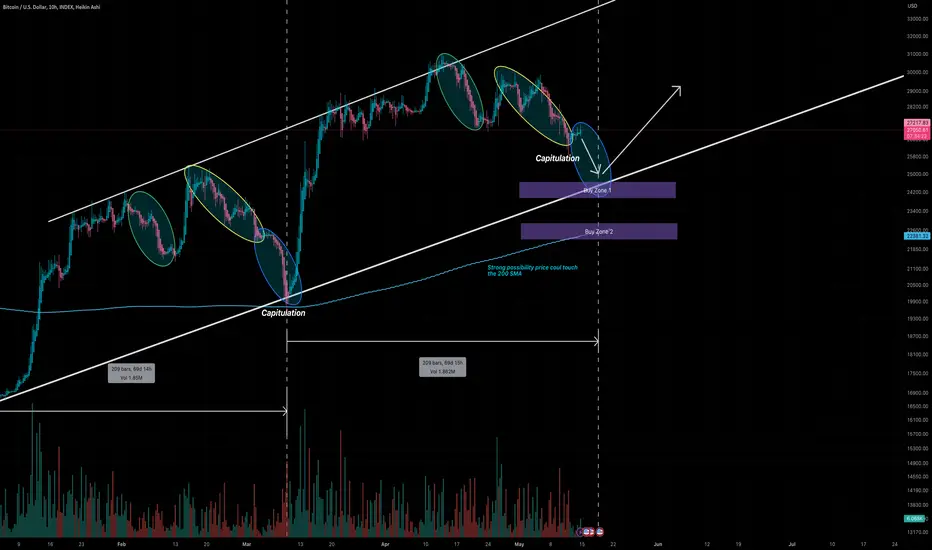
Last chance to buy BTC in the $20k's?Happy Sunday all
It looks like BTC is preparing for the capitulation phase of it's retracement which should happen during the next few days. I'm looking at pricing hitting anywhere between the 200 SMA and the $24500 area.
After which I believe it will retest the FWB:31K mark.
Thanks for your time
BB
LunarCrush (LUNR)Lunr price today is $0.3 with a 24hour trading volume of 1 million dollar
LunarCrush provides social insights for cryptocurrencies and Lunr is a utility token rewarded to LunarCrush users for the work they put into LunarCrush
I remember the first time I talked with Joe Vezzani the CEO of the project it was 3 a.m and I loved everything about their team and their mission and they still crushing it
I started investing since the price was 0.14 and I think we going to see much higher prices
targets 0.39 , 0.50

Ethereum Sunny 🌞🌤️ Good news for Ethereum investors! Based on the chart index for the past hour, it looks like we're in for some sunny weather ☀️. The close price is currently above the long position entry point of 1980, indicating a positive trend.
📈 With a long take profit (TP) set at 2040 and a stop loss (SL) at 1720, investors may want to consider entering a long position. However, it's important to keep an eye on market trends and adjust the TP and SL accordingly to maximize profits and minimize losses.
💰 Overall, the forecast looks optimistic for Ethereum investors, but as always, caution and careful monitoring are key to successful trading in the cryptocurrency world.

EURPLN Rocket Moon StrategyOur rocket prediction shows that there should be a nice pop in EURPLN in the upcoming weeks. Sponsored by MetaFreedom Investment Group.
