Moonshot
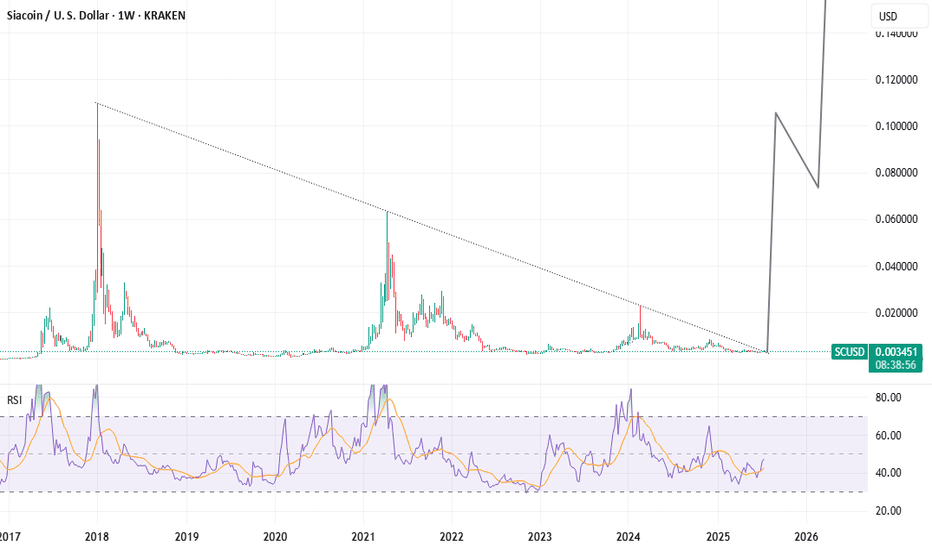
8-Year Breakout Confirmed! SIACOIN Hardfork Activated!Breaking out from a near-identical structure to XRP’s Q3 2024 move, Siacoin (SC) is poised to moon.
Once a top 20 crypto, SC has just closed outside an 8-year falling wedge on the weekly—marking the end of nearly a decade of compression.
But this isn’t just a pattern breakout—it coincides with the biggest technical overhaul in Sia’s history, rolled out on the 10-year anniversary of the token’s launch. Some of the new features:
- Full protocol overhaul — complete rewrite in Go (from siad to hostd/renterd)
- Faster performance — significantly improved upload/download speeds
- Modular architecture — easier dev integration, plug-and-play infrastructure
- Efficient storage contracts — new ephemeral account system for faster payments
- Lower gas costs — more cost-effective microtransactions for storage users
- Better redundancy & reliability — improved renter-host coordination
- Stronger developer tools — RESTful APIs + CLI tools for building on Sia
V2 basically turned Sia from a clunky decentralized Dropbox into a scalable, developer-friendly Web3 storage protocol, just in time for the AI + data sovereignty wave.
Still buried in market cap rankings, SC has the potential to quietly reclaim a top 30 spot as the world rediscovers decentralized storage. This isn’t a meme coin—it’s a battle-tested, utility-rich project with real infrastructure, real adoption potential, and serious upside.
#Siacoin #SC #Sia
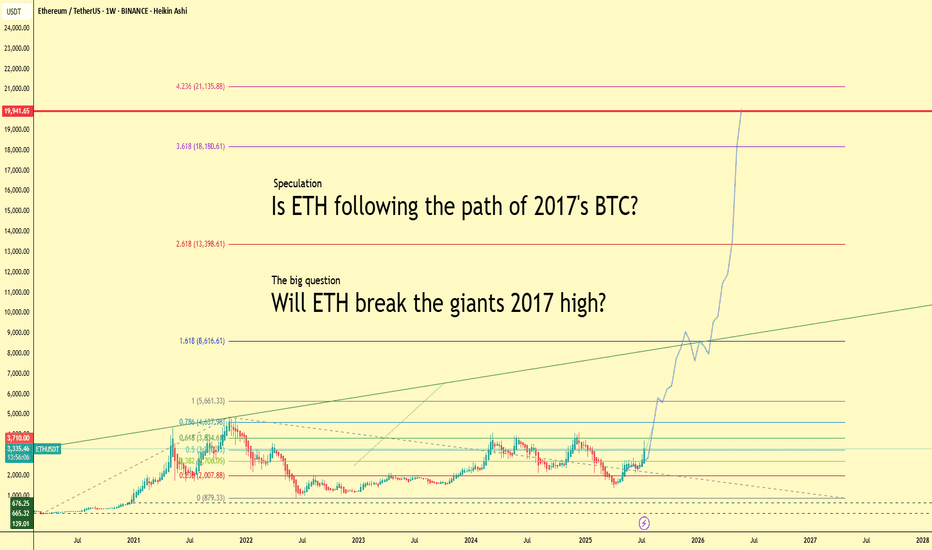
Will ETH Follow BTC’s 2017 Path? $20K in Sight?Ethereum is heating up — up more than 20% this week and currently trading above $3,300. But what if we told you this might just be the beginning?
This chart explores a bold yet exciting speculation:
👉 Is ETH repeating Bitcoin’s legendary 2017 run?
Back then, BTC went from obscurity to global headlines, smashing through $1k, then $5k, then $10k… and eventually peaking just below $20,000. Ethereum might just be lining up for a similar parabolic path.
🚀 Fibonacci Levels Say: Sky’s the Limit
The chart projects Fibonacci extensions up to:
1.618 = $8,600
2.618 = $13,400
3.618 = $18,180
4.236 = $21,135
Notice the key level: $19,941. That’s the legendary BTC high of 2017. Will ETH match or even surpass that milestone?
🧠 The Big Question:
Can ETH become the new “giant”?
While Bitcoin still leads the narrative, Ethereum’s ecosystem, real-world adoption, and institutional attention have never been stronger.
💬 Let’s Talk
Do you believe Ethereum is set to break $20K this cycle? Or is this just hopium and lines? Share your thoughts and let's compare notes.
#Ethereum #ETHUSDT #Crypto #Altseason #BTC2017 #Fibonacci #Bullrun #ETHBreakout #Parabola #CryptoSpeculation
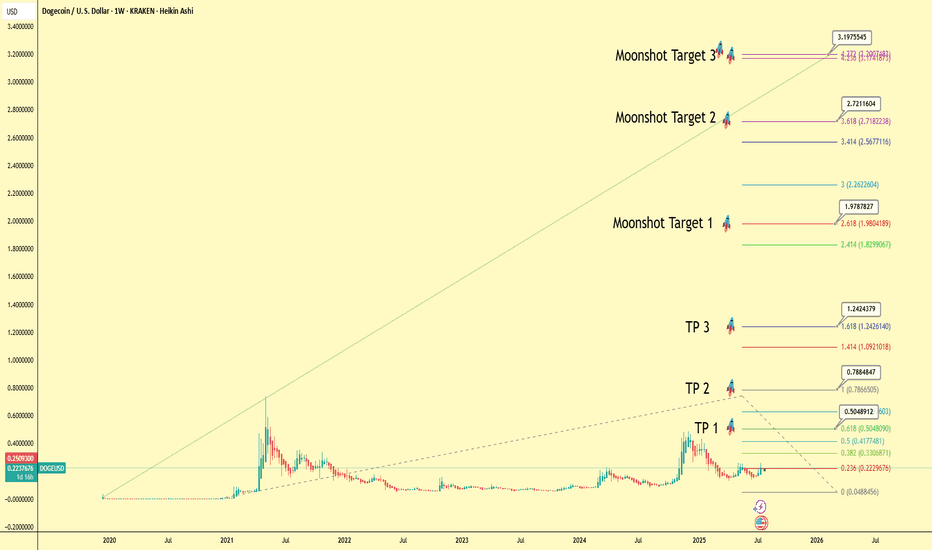
DOGE Macro Analysis: A Technical and Fundamental Blueprint to $3This analysis presents a long-term macro view for Dogecoin (DOGE/USD) using a daily Heikin Ashi chart to smooth out price action and better identify the underlying trend. The primary technical tool employed is a multi-year Fibonacci extension, a powerful instrument for projecting potential price targets in a trending market.
Based on the key swing low and high of the previous cycle, we have mapped out several conservative take-profit (TP) levels and more ambitious "Moonshot" targets.
The Technical Targets
The core of this projection lies in the Fibonacci extension levels. Assuming an entry or cost basis around the current consolidation level of $0.25, the potential targets are as follows:
TP 1 (0.618 Fib): $0.505 (+102% Profit)
TP 2 (1.000 Fib): $0.788 (+215% Profit)
TP 3 (1.618 Fib): $1.242 (+397% Profit)
Moonshot Targets
For longer-term holders, the upper Fibonacci levels suggest significant upside potential:
Moonshot Target 1 (2.618 Fib): $1.979 (+692% Profit)
Moonshot Target 2 (3.618 Fib): $2.721 (+988% Profit)
Moonshot Target 3 (4.236 Fib): $3.175 (+1170% Profit)
The Rationale: Why These Prices are Expected
This bullish outlook is supported by a combination of historical technical patterns and strengthening fundamental catalysts:
Historical Cycle Performance: In previous bull cycles, Dogecoin has shown a remarkable tendency to not just meet, but exceed standard Fibonacci targets, often running all the way to the 4.236 extension level. While past performance is not a guarantee, this historical precedent forms a strong basis for the "Moonshot Target 3" as a cycle peak objective.
Growing Institutional Legitimacy: The landscape for digital assets is maturing. Recent news about a major player filing with the SEC to list Dogecoin futures is a significant catalyst. Such a product would open the door for institutional capital, enhance liquidity, and provide a regulated pathway for investment, fundamentally increasing Dogecoin's legitimacy and market depth.
Renewed Investor Inflows: Dogecoin possesses one of the most resilient and loyal retail communities in cryptocurrency. As the market cycle progresses, the combination of re-energized retail interest and new institutional inflows could create a powerful demand-side shock, providing the fuel needed to reach these upper price targets.
Conclusion
This analysis outlines a clear, multi-stage roadmap for Dogecoin's potential path forward. The confluence of a historically reliable technical pattern (Fibonacci extension) and major fundamental catalysts (futures listing, broad investor interest) creates a compelling long-term thesis.
Disclaimer: This is a personal analysis and projection for educational purposes only. It is not financial advice. Always conduct your own research and manage your risk accordingly.
#Dogecoin #DOGE #Crypto #TechnicalAnalysis #Fibonacci #Altcoin #TradingView #ToTheMoon
XRP at $7 in 50 days!Like the rest of the market XRP has been stalling a bit for the last few days.
The coming 50 days will give us several new ATHs, though.
For this scenario to play out, we need a strong break out from $2.57 and a strong support from $2.60.
Look at the chart and find the minor pullbacks going up to around $7 !
God speed to all of you !
Moonshot opportunities The article strategies showed about Moonshot can breakout and go over 3000. I am expecting this bullish opportunity.
The chess between bears and bulls.. bulls will bring up the end game checkmate. It needs to break way above 2590 and thru 2900. The bulls take control; it takes it very well.
After the breakout it will mission back to recent high and then 2021 ATH which is at 4800 area; once that happens then 5000 will happen.
Im not financial advisor; be sure to use proper risk management and be cautious of the spike.
Watch any reversal
Moonshot Ideas $CFLT > $40- We are entering era of Agentic AI which requires real time data and agent decides to take an action on that event in near real time.
- Confluent valuation is so cheap in a massive TAM and an exploding tailwind of AI Agents. I am seeing all the tech companies and startups are building AI Agents and apetite for real time data streaming capability, processing is required.
- NASDAQ:CFLT need to ride this wave and one way they could do is by making Apache Flink to natively support Python instead of just relying on Java. If they build sdk, python library which could do the heavy lifting when it comes to stream processing, transformation then NASDAQ:CFLT would be number one choice and popular among growing Python community and ML community.
- I wouldn't be surprised to see NASDAQ:CFLT well above 60 dollars in next 2-3 years.
350x alt alert AVERHidden Gem Alert: Promising Micro Cap Project 🚀
Stumbled upon an amazing micro cap project with strong fundamentals and massive growth potential. Perfect for those who spot opportunities before they hit the mainstream. 🚀🌕
1 eth into 1 million
Thank me later! 😉
$BTC Needs to #HODL abv POC (Yellow Line)!!!!!As of time of posting CRYPTOCAP:BTC is on a down day, and would need to hold here at the Volume Weighted Point of Control (Volume/Confluence). At this time it's approx $92.3K... Thoughts to add?
For my opinions on potential #Upside & #Downside levels I'm eyeing, pls see text in chart notes.
Any confluence from the charting community, that (kinda) lines up with my theories (lol)?
Any contradictions out there?
Happy Hunting!
#SLB
AMP gearing up for a nice move to the NorthAMP is looking nice resting on the .618 and broke through resistance nicely. Also printing a nice bull flag pattern at the moment.
AMP is the token used as collateral connected to the Flexa App which is used to make fast secure crypto payments. Flexa is accepted at Chipotle and other numerous stores starting to come on board the crypto wave. Flexa was just mentioned in a Bitcoin News article about a large national gas station chain staring to accept the Flexa app. This one has the potential to be huge and is a sleeping Giant ATM IMO. LETS F GO!!!
Target 1: .01075
Target 2: .01300
Target 3: .01685
Target 4: .02700
Target 5: .03800
Target 6: MOON
BTC blasts offI am a Bayesian in terms of probability theory. I look for Priors to give me a clue. There are many Priors in Bitcoin that provide guidance on the magnitude of price "Mark-Ups" following prolonged periods of chop.
The most recent Prior from Jan-Mar 2024 would suggest that Bitcoin continues its rally through the end of the year and might reach $125,000 by New Years Day.
WEN starting to gain momentum - preparing longMemecoin WEN has suddenly come back to life.
As soon as WEN break the resistance at 0.00067 and have a successful retest, I think we quite fast can pass through 3 take profit levels. A potential retest of the horizontal resistance could be a good entry for a short or long time trade
I see WEN as one of the memecoins with the best potential. I wouldn't be surprised if we see WENs price go bananas when the market goes full bull.
I see WEN as a solid meme coin that can be sustainable in the long term...
Non financial advice, I believe in WEN.
$ALZN dips 3 times the past day. Short interest up. Squeeze?NASDAQ:ALZN has been on an interesting exponential decrease from $5000 per share to $2.5 since June 14th, 2021. Wow!
In the past day it has dipped a few times. It might be ready for a rebound!
Number of people shorting has increased over the past day on the daily chart:
Could the price squeeze up?
GAMESTOP SOARING from $25 to $111 - $168 range.GME just got $1 BILLION dollars in funding. Price expected to rise past all short squeezes in the $120 - $168 price range. This stock just went from a simple meme to opposing sides on institutional traders that even Kramer is beginning to call it a good investment (not that his opinion matters at this point with the amount he flip-flops with retail investors money)
Invest smart, invest hard. This one's to the moon.
Boost my post if you like this idea 💡
Also follow and subscribe for more uproars. Let's spread the word together.
Roaring Puppy 🐶 out.


