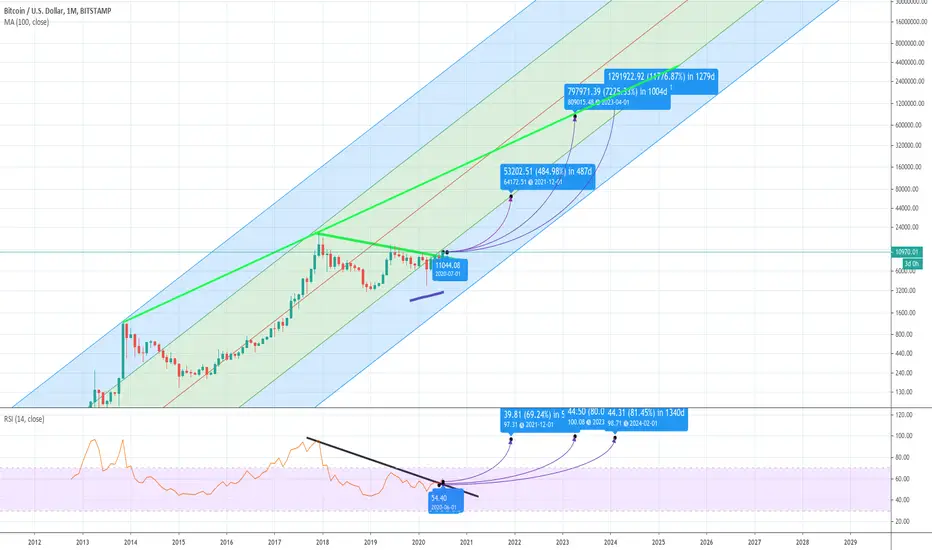
USD's pain is the WORLD's, and CRYPTO's gain !If we break below the black multi-year support line, and if we test it's underbelly successfully by bouncing off the white 0.25 level of the Schiff pitchfork, which we seem to have done already, we need to fall below the white 0.25 level and turn it into resistance.
If this happens and if we stay decisively below it, for several weeks, after multiple unsuccessful tries to break through and up.
In that case...
...the coming bitcoin bull-run will leave in the dust pretty much every bull-market we've ever seen in the financial world people will be stunned.
In the very long run, on a ten to thirty year horizon, the world is going to de-dollarize further. This is bad for the value of the dollar, and very good for the Emerging Market's massive volume of dollar-denominated loans, as the dollar will weaken, those loans will be way easier to finance.
Moonshot

Face Masks for $APT MoonshotAMEX:APT
Clean S/R flip on the 1W chart of a main horizontal resistance for Alpha Pro Tech. Massively bullish chart from a technical standpoint with almost a picture perfect "buy" signal if we can break this ~$18 region.
Fundamentally if a mandatory mask/face covering order is put into place by the US government, I think that would seal the deal for a new ATH of $50+ for this name.
Technicals + Fundamentals = Money
- PennyBag

$DATA MEANS CHA CHING TO MOON BOYS You can see from this chart i drew that we are saved by this bottom ring which will carry us on up to the moon!!!
$DATA

Months of consolidation come down to his moment.Daily completed an Inverse H&S since January highs. Did what looks to be a final shakeout which touched support around 3100 sats followed by a 4hr H&S with another shakeout at 3200 sats. DAily RSI Divergence up and in over sold region. I say up up and away. DYOR. THis is crypto.

$1000 Chainlink is fud Strongest project in the space right now, incredible fundamentals and technicals. A mere 10x away in btc away from being $1000 USD when Bitcoin hits 100k
When Bitcoin hits a million USD per coin Chainlink with have unfathomable gains. We have broken out of the 'accumulation' phase of the Chainlink market cycle, the smart money has already taken positions. If you want to know what comes next all you need to do is look at a chart of ETH when it went from $10 to $1000+ in just a few months.
Don't get left behind! Buy now! This is not financial advice, it is a financial COMMAND.

VET SIMPLE PHYSICS ANALYSISwhenever vet goes over the line and comes close to a rocketship
who put those rocket ships there?!?!
the sophistication of this analysis can not be questyioned
moon is the only direction
happy trading
NFA!


Bitcoin Dreams - Looking At The Log ChartIts hard to conceptualize a $50,000, $100,000 let alone a $500,000 per BTC price in the future, however the log chart really helps with the visualization. Just trying to illustrate the headroom BTC has to run, and how quickly it may do just that. Not 'technical analysis' just exploring the possibilities. This is not trading advise, just archiving my thoughts.
Possible cup and handle on 3 day chartThis lines up well with the 3 months chart idea from the other idea posted here on the RRD uptrend with 3 month charts.
Could be the entry here. Watch this til close, might be the entry.


Who let the DOGE Out? (TikTok did, and they created a monster)Keep going DOGE. Gen Z is pumping this thing up just for the fun of it.

#Kwality broken triangle triangle broken on the upside & targets are Rs.6+
I think we will soon have a retrace & that's where I will buy but for now not laddering any buys
need to see price action before leaving any bids - this would be the setup not good R:r

NVDA is a go | Huge ATH BreakoutWon't dig in too much, NVDA just pumped through a huge resistance and now claims ATH at $296 coming into pre-market this morning. I'll be looking to enter a small contract position striking a bit higher (2-3 months), good continuation play.
DotcomJack | Not Your Financial Advisor

XRPUSD: Tightest Downward Consolidation Since 2017As seen in the charts we have a similar pattern as the beginning of 2017.
We just saw the first green tick on 3 Week MACD on XRPUSD since 800 days ago.
It's been a 910 day bear market and somethings got to give soon.
XRPUSD broke its falling wedge pattern and has been doing this consolidation above its top trend line .
We should see 50 cents by Q4 2020.
Time is Ticking.
Please comment and like

#BitcoinDiamond - Small risky buy Broken out of ascending triangle on the daily timeframe, Greenzone should act as support now
also, we are in an uptrend parallel channel
I am risking this with tight stop
I AM NOT A FINANCIAL ADVISOR
please always Do your own research
please do let me know about my charts in comments, has setups clear & easy to read? charts are not messy right?
thanks :)

I hope you catch the next flight Forgive me for writing like a politician:
They don't lie, but they don't tell you the truth either.
"Things will get worse before they get Better"
I hope you catch the next flight to the North.

Let's #long #bitcoinpossible H&S forming with right shoulder being in Golden FIbbonacci zone!!
risking it if we see good reaction from levels :)
Do leave a comment

#ETC - Wait for the breakout Retestwe are still trading under resistance IF somehow BTC dumps then this will also come crashing so it's better to wait for the breakout & the retest of S/r flip just how we did for #VET
entering at the successful retest of the broken triangle is much safer then entering blindly here that resistance will break, 90% of the time in my experience they retest if I miss out then on to the next setup :)


XLM to the moon ? Another 300% + mega cycle loading read whyHI guys & girls
Today we are looking into XLM (stellar) chart.
What XLM did twice was pretty amazing. That chart shows us the gains vs the Bitcoin!
The chart shows us the accumulation zone and what happens when XLM explodes from it.
What is the news behind the current situation?
Bitstamp (the odlest, most respectful crypto exchange) will list XLM on 15.June
The Bitstamp exchange hasn't listed new coin in about 3 years, so when ever they do it, it makes notable impact on the price.
They are very conservative and chosing to work only with long lasting, stable projects. There is no crypto exchange with more stable business model as Bitstamp.
Buckle up guys, XLM could bring us 300% in following months.

BTCUSD - The Comeback?The price has settled a floor just above the 88.6% fibonacci trend line which is also right at the support of where the 3rd wave extension would be, this means there is underlying strength in buyers but like any other bubble it is till it isn't right? However I believe this time is different, the sideways wave has ended at Wave 4 being bullish, however there may be some trouble around 9,800. Will come back and update.
