US Banks on Fire | Revenues Soar, and So Do the ProfitsWho Needs a Recession? Banks Are Swimming in Cash!
The largest U.S. banks have reported some of their best quarterly performances in recent years, with surging trading revenues, a resurgence in dealmaking, and an overall renewal of corporate confidence playing pivotal roles. Let’s break down the key details of the results.
Market Recovery
Across the major banks, investment banking and trading activities recorded impressive performances. Goldman Sachs saw investment banking revenue increase by 24%, while Bank of America (BofA) experienced a massive 44% jump, marking its strongest quarter in three years.
The market volatility stemming from factors like the U.S. election and changing expectations around interest rates continued to fuel robust trading revenues. Morgan Stanley’s equities division, for example, reached an all-time high, while JPMorgan and Goldman Sachs enjoyed notable gains in fixed-income trading.
A surge in CEO optimism has led to an uptick in mergers and acquisitions (M&A), initial public offerings (IPOs), and private credit demand. Morgan Stanley, in particular, is seeing the largest M&A pipeline in seven years, signaling a sustained wave of dealmaking.
Mixed Results for NII
Net interest income showed varying results across the banks, but forward guidance indicates that NII will likely see moderate growth in 2025, spurred by continued loan demand and higher asset yields.
Credit Risks on the Rise
Consumer lending pressures have persisted, with JPMorgan’s charge-offs rising by 9%. Many banks are preparing for a further increase in delinquencies, particularly in credit cards.
Commercial Real Estate Challenges
While the office sector remains under stress, banks are managing their exposures cautiously and have yet to face significant shocks in this area.
Regulatory Scrutiny Continues
Citigroup lowered its 2026 profitability target as it undergoes a transformation, while Bank of America faced increased scrutiny over its anti-money laundering compliance.
Resilient U.S. Economy
Banks are reporting strong consumer spending, loan growth, and corporate profitability, which supports an optimistic outlook for earnings growth heading into 2025.
Performance Breakdown for Each Bank
JPMorgan Chase
- JPMorgan posted a record annual net income of $58.5 billion, marking an 18% increase from the previous year.
- Investment banking saw a 46% surge in revenue, driven by strong advisory and equity underwriting.
- Trading revenue climbed by 21%, led by a 20% increase in fixed-income trading.
- Despite the impressive results, JPMorgan is still facing challenges such as rising charge-offs and pressures on loan margins. CEO Jamie Dimon emphasized concerns about persistent inflation and growing geopolitical risks.
Bank of America
- BofA experienced an 11% year over year growth in revenue, reaching $25.3 billion, with net income up 112% from the previous year.
- The investment banking division saw a dramatic 44% rise in revenue, the highest in three years, thanks to strong debt and equity underwriting.
- Trading revenue grew by 10%, driven by solid performance in fixed income (up 13%) and equities (up 6%) as market volatility spurred client activity.
- BofA also reported growth in its consumer and wealth management divisions, with credit card fees and asset management showing strength. Client balances grew to $4.3 trillion, a 12% increase from the previous year.
- After several quarters of decline, BofA’s NII grew by 3%, exceeding expectations and signaling stability. The bank expects NII to continue rising through 2025, with projections of $15.7 billion per quarter by the end of the year.
Wells Fargo
- Wells Fargo’s revenue remained flat at $20.4 billion, but net income surged by 50%.
- NII declined by 8% year-over-year but is expected to rise slightly in 2025 due to higher reinvestment rates on maturing assets.
- The bank made significant progress in cost-cutting efforts, reducing non-interest expenses by 12%, thanks to workforce reductions and efficiency initiatives.
- Investment banking fees rose by 59%, benefiting from the broader market recovery and the bank’s renewed focus on its Wall Street presence.
- Wells Fargo returned $25 billion to shareholders in 2024, including a 15% dividend increase and $20 billion in stock buybacks. However, the bank continues to face regulatory constraints, notably the asset cap imposed by the Federal Reserve.
- Looking ahead to 2025, Wells Fargo anticipates modest growth in fee-based revenue, with cost discipline and efficiency gains driving improvements.
Morgan Stanley
- Morgan Stanley saw a 26% increase in revenue, reaching $16.2 billion, while net income soared by 142%.
- Equity trading revenue jumped by 51%, setting a new all-time high as market volatility sparked increased client activity, particularly in prime brokerage and risk-repositioning trades.
- Investment banking revenue grew by 25%, fueled by strong demand for debt underwriting, stock sales, and M&A activity. CEO Ted Pick noted that the M&A pipeline is the strongest in seven years, signaling a potential multi-year recovery in dealmaking.
- Morgan Stanley’s wealth management division saw $56.5 billion in net new assets, increasing total client assets to $7.9 trillion. The firm is pushing toward its goal of $10 trillion in assets under management.
- In response to growing business complexities, the firm launched a new Integrated Firm Management division to streamline services across investment banking, trading, and wealth management.
Goldman Sachs
- Goldman Sachs experienced a 23% increase in revenue, reaching $13.9 billion, while net income more than doubled, up 105%.
- Record performance in equity trading contributed to a 32% increase in revenue from this segment, as market volatility drove greater client activity.
- Investment banking revenue grew by 24%, boosted by significant gains in equity and debt underwriting.
- The firm’s asset management division saw an 8% rise in assets under management, reaching $3.1 trillion, while management fees exceeded $10 billion for the year.
- Goldman is winding down legacy balance-sheet investments but also saw a gain of $472 million from these investments in Q4. The firm’s recent launch of its Capital Solutions Group is aimed at capturing growth opportunities in private credit and alternative financing.
Citigroup
- Citigroup posted a 12% increase in revenue, reaching $19.6 billion, with non-interest revenue surging 62%.
- Fixed-income and equity markets were key drivers, growing 37% and 34%, respectively, as market volatility tied to the U.S. election boosted performance.
- Investment banking revenue climbed by 35%, supported by strong corporate debt issuance and a pickup in dealmaking activity.
- The bank unveiled a $20 billion stock repurchase program, signaling confidence in future earnings.
- Citigroup also made strides in controlling operating expenses, which declined by 2% quarter-over-quarter. However, the bank lowered its 2026 return on tangible common equity (RoTCE) guidance to 10%-11% due to the costs of its ongoing transformation.
- CEO Jane Fraser emphasized Citigroup’s long-term growth trajectory, noting improvements in credit quality and continued progress with the strategic overhaul, including the postponed IPO of Banamex, the bank’s Mexican retail unit, now expected in 2026.
Long story short
Heading into 2025, the major U.S. banks are in strong positions, buoyed by a favorable economic backdrop, continued growth in trading, and a rebound in corporate dealmaking. Despite challenges such as rising credit risks, regulatory hurdles, and potential macroeconomic uncertainties, the outlook remains positive. With a recovering IPO market, continued wealth management growth, and strong trading revenue, the banks are poised to capitalize on the renewed corporate optimism. The key question will be whether the dealmaking frenzy continues or whether uncertainties in the global economy and market dynamics could temper the rally.
Morganstanley

Morgan Stanley (NYSE: MS) Reports Strong Q125 ResultsMorgan Stanley (NYSE: NYSE:MS ) Beats Q1 estimates with record Equity Trading Revenue. The bank posted earnings per share (EPS) of $2.60, beating analyst expectations of $2.18. Revenue reached a record $17.74 billion, topping forecasts of $16.44 billion.
The bank's equity trading revenue soared 45% year-over-year. It reached a new high of $4.13 billion as growth came across business lines and regions. Asia showed particularly strong performance. Prime brokerage and derivatives led gains, fueled by high client activity in volatile markets.
Morgan Stanley shares dropped 1% after the earnings release. However, the stock remains up over 20% in the past year. Volatility in global markets helped trading desks outperform.
Technical Analysis
Morgan Stanley bounced sharply from the $95 support zone. Buyers stepped in near the previous breakout level. Volume increased and confirmed renewed interest. This was seen as Trump paused tariffs for the next 90 days as well. Current price action suggests a recovery trend. The RSI stands at 39, hinting at oversold conditions. A potential path points to $142.03, which acts as the immediate resistance level.
If the price breaks $113 cleanly, momentum could carry it to $130 and beyond. If it fails, it is most likely to retest $95 support level. A strong break above recent highs would confirm bullish continuation. For now, Watch out the $113 and $142 levels closely.

Charles Schwab ($SCHW) Upgraded by Morgan Stanley to Overweight Morgan Stanley has taken new rating actions on financial exchanges and brokers as markets face heightened uncertainty. The investment bank highlighted concerns over economic growth, sticky inflation, and interest rate paths. Recession fears and tariff-induced volatility have also rattled investor confidence.
According to Morgan Stanley, such conditions increase the need for hedging, trading, and risk management by corporations and asset owners. The note added that the recent market sell-off may discourage retail investor activity, especially as portfolio losses and margin calls mount.
Despite these challenges, Charles Schwab (NYSE: SCHW) received an upgrade to Overweight. The firm cited Schwab’s more stable earnings profile and strong fundamentals. Morgan Stanley sees a 20% annual EPS growth for Schwab over the next two years. The bank also noted Schwab’s resilience amid the volatile macro environment.
Technical Analysis
Charles Schwab's stock is showing strength despite the broader market downturn. Price action recently formed an inverted Head and Shoulders pattern. This is aligned with an ascending trendline that dates back several months.
Currently, SCHW is testing a solid horizontal support level that confluences with the trendline near $70. If momentum remains strong, the next potential target is $84, the high from February 2025. The bullish chart formation, combined with Morgan Stanley’s upgrade, supports a possible price surge from the current level.

$MS Tradespoon - Long Entry $119.20Tradespoon model generated long signal for Morgan Stanley ( NYSE:MS ). Predicted range: $119.20–$123.87. Trend: +1.47%. NYSE:MS

Why Morgan Stanley and MUFG back JPY? Morgan Stanley and MUFG both see the Japanese yen as the strongest G10 currency in 2025. They expect it to gain value as U.S. interest rates fall and Japan’s central bank raises its own.
On the daily chart, USD/JPY oscillators are still away from being in the oversold zone, suggesting that the path of least resistance could to the downside.
MUFG predicts further yen gains, especially against the euro, and has set a target of 150 for EUR/JPY, down from 157.
Morgan Stanley also favors the Australian dollar. Meanwhile they believe the New Zealand dollar will appreciate but underperform the Australian dollar due to a weaker domestic outlook.

Morgan Stanley Breaks Free A Bullish Wedge Reversal in ActionMorgan Stanley (MS) on the 4-hour chart has confirmed a breakout from a descending wedge pattern, signaling a strong bullish reversal. The breakout is accompanied by increased momentum, as indicated by the clean surge above the wedge’s upper boundary. This setup is a classic reversal signal, with bulls reclaiming control.
The entry is placed at 137.87, capitalizing on the breakout momentum. The stop loss is strategically positioned at 123.50, below the wedge’s lower boundary, to safeguard against invalidation of the setup. The take profit is set at 155.35, aligning with the wedge’s projected target based on its height.
The trade exhibits a solid risk-to-reward ratio, and the breakout aligns with the broader bullish market sentiment for the stock. With buyers driving the price upwards, this trade setup offers a high-probability opportunity for trend continuation.

Morgan Stanley (MS) Shares Display StrengthMorgan Stanley (MS) Shares Display Strength Ahead of Earnings Release
The stock market is eagerly awaiting the start of the quarterly earnings season. Traditionally, it kicks off with reports from major players in the financial sector, including Morgan Stanley (MS). The bank's earnings report is scheduled for tomorrow, Thursday, before the opening of the main trading session.
According to Yahoo Finance, analysts expect:
→ Earnings per share (EPS) to be $1.62, indicating a 43.4% increase compared to the previous year;
→ Revenue to reach $14.8 billion, reflecting a 14.7% rise year-on-year.
Meanwhile, MS’s share price may also be influenced by internal organisational changes at Morgan Stanley. The bank has created a new division to enhance client relations and appointed a new head of wealth management.
MarketWatch notes that the upcoming earnings season could be the strongest in three years (based on FactSet data), with the financial sector likely to be the largest contributor to profits this season. Furthermore, a technical analysis of Morgan Stanley’s (MS) stock chart suggests that market participants are optimistic.
Indeed:
→ Price fluctuations have formed an upward channel (marked in blue), with the share price stabilising around its median line—likely in anticipation of corporate news;
→ During the stock market decline in early 2025, MS’s share price fell less than the S&P 500 index (US SPX 500 mini on FXOpen), as indicated by arrows;
→ The $120 level appears to be a significant support zone.
It’s possible that today’s earnings reports from banks such as JPMorgan (JPM), Wells Fargo & Co. (WFC), Goldman Sachs Group Inc. (GS), and Citigroup Inc. (C) may offer clues about how MS’s stock price might move next.
This article represents the opinion of the Companies operating under the FXOpen brand only. It is not to be construed as an offer, solicitation, or recommendation with respect to products and services provided by the Companies operating under the FXOpen brand, nor is it to be considered financial advice.

MS Morgan Stanley Options Ahead of EarningsIf you haven`t bought MS before the previous earnings:
Now analyzing the options chain and the chart patterns of MS Morgan Stanley prior to the earnings report this week,
I would consider purchasing the 125usd strike price Puts with
an expiration date of 2025-2-21,
for a premium of approximately $4.85.
If these options prove to be profitable prior to the earnings release, I would sell at least half of them.
MS | SHORTNYSE:MS
Technical Analysis of Morgan Stanley (MS)
Key Observations:
Current Price Action:
Price: $95.85
Recent Drop: -5.91 (-5.81%)
Support and Resistance Levels:
Immediate Support: $93.99 (Bearish Line)
Further Supports: $92.66 (Target Price 1), $86.34 (Target Price 2), and $82.74 (Target Price 3)
Trendlines:
The price has broken below the upward trendline, indicating a potential shift from a bullish to a bearish trend.
Relative Strength Index (RSI):
Current RSI: 52.21
The RSI shows a decline, indicating increasing selling pressure but still in a neutral zone.
Target Prices:
Target Price 1: $92.66
This level is the immediate support and a potential first target for any continued downward movement.
Target Price 2: $86.34
If the price breaks below the immediate support, the next target is around $86.34, a previous support level.
Target Price 3: $82.74
Further downside could see the price reaching $82.74, another key support level.
Summary:
Morgan Stanley (MS) has experienced a significant drop, breaking below a key support level and its upward trendline. The next levels to watch are $93.99, $92.66, $86.34, and $82.74. The RSI is neutral, suggesting the potential for further declines if market conditions remain negative.

Morgan Stanley - Bulls In ChargeSmall flag structure formed under the middle of this channel which lets the bulls push higher
This channel will be in effect for the bulls for years to come.
Weekly chart

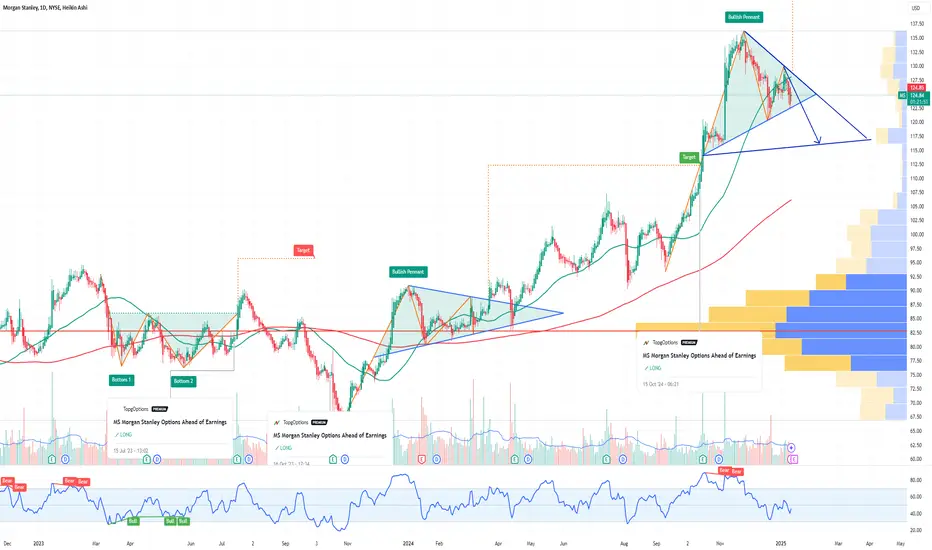
MS Morgan Stanley Options Ahead of EarningsAnalyzing the options chain and the chart patterns of MS Morgan Stanley prior to the earnings report this week,
I would consider purchasing the 115usd strike price Calls with
an expiration date of 2024-11-15,
for a premium of approximately $2.26.
If these options prove to be profitable prior to the earnings release, I would sell at least half of them.

Morgan Stanley (MS) Shares Rise 6.45%, Setting Historic HighMorgan Stanley (MS) Shares Rise 6.45%, Setting Historic High
Morgan Stanley (MS) reported its third-quarter results:
→ Earnings per share: actual = $1.88, forecast = $1.59
→ Gross revenue: actual = $15.38 billion, forecast = $14.35 billion
According to Barron’s, Morgan Stanley’s profit increased by 32% compared to last year, driven by heightened activity in investment banking, which had previously been pressured by the Federal Reserve's high interest rates.
Market participants reacted positively to Morgan Stanley’s success, with MS shares rising 6.45% in a day, reaching an all-time high. Will the rally continue?
A technical analysis of the daily MS stock chart indicates:
→ The price action has formed a long-term channel (shown in blue), and in October, the price broke through its upper boundary. A strong price movement (indicated by an arrow) occurred at this resistance level around $110, influenced by strong reports from other banks. Bulls demonstrated dominance here, and this level may now serve as support.
→ In 2024, a steeper price growth trend is observed, providing anchor points for constructing an upward channel, shown in purple. Today, the MS stock price is positioned in the upper half of this channel, nearing its upper limit.
→ The RSI indicator is at its highest since January 2020.
→ Yesterday's candle closed well below the highs, with the price unable to hold above the psychological level of $120.
Given these factors, it is reasonable to suggest that the MS stock price is vulnerable to a correction as the initial reaction to the strong report may wane. If a correction occurs, it’s possible the price may retreat to the $110 level, where two channel lines converge, potentially providing support.
Analysts’ forecasts also indicate a likelihood of a pullback. According to TipRanks, the average price target for MS shares is $112 over the next 12 months, with 4 out of 12 analysts recommending buying Morgan Stanley (MS) shares.
This article represents the opinion of the Companies operating under the FXOpen brand only. It is not to be construed as an offer, solicitation, or recommendation with respect to products and services provided by the Companies operating under the FXOpen brand, nor is it to be considered financial advice.

GM Stock Dips 5.4% Following a Downgrade by Morgan Stanley General Motors (NYSE: NYSE:GM ) stock took a significant hit following a downgrade by Morgan Stanley on Wednesday, as the investment bank lowered its rating from "Equal Weight" to "Underweight." Analyst Adam Jonas expressed concerns about rising competition from China, growing inventories, and the increasing costs tied to artificial intelligence (AI) integration in vehicles.
The China Factor
The major factor behind Morgan Stanley's downgrade is China, a critical market for NYSE:GM and the global automotive industry. China now produces 9 million more vehicles than it sells, turning what was once a profit center into a significant competitive threat. Jonas remarked that China's overcapacity, especially in electric vehicles (EVs), could put further pressure on Western automakers like GM.
- GM's Market Share Decline: Over the past few years, NYSE:GM has been losing market share both in the U.S. and globally. The company has shifted its focus to electric vehicles and AI-driven technologies, but the costs and complexities of these transitions weigh heavily on its profitability.
- Rising Costs: Another critical aspect of the downgrade is the growing expense of enabling AI in vehicles. As GM pivots towards advanced driver-assistance systems and autonomous vehicles, capital spending continues to rise, with an estimated **$300 million** in additional costs for the foreseeable future.
- Price Target Adjustment: As part of the downgrade, Jonas slashed GM's price target from $47 to $42, a level below the current share price. This adjustment reflects concerns over GM's ability to compete effectively in a rapidly changing market dominated by EVs and AI-enabled vehicles.
Industry-Wide Impact
While NYSE:GM was hit the hardest, the downgrade extended to other U.S. automakers. Rivian (RIVN) and Ford (F) also saw their ratings adjusted. For Ford, Morgan Stanley cited similar concerns, including price/mix headwinds and the risk posed by the growing Chinese market. Meanwhile, Rivian's downgrade was attributed to the high capital intensity of developing its autonomous and EV technologies.
However, Tesla (TSLA) and Ferrari (RACE) were notable exceptions, as Jonas maintained an "Overweight" rating on both companies. Tesla, in particular, is considered well-positioned to benefit from ongoing advancements in AI, battery technology, and its upcoming **October 10 robotaxi reveal, which could set a new benchmark for autonomous vehicles.
Technical Outlook
From a technical perspective, GM's chart paints a bleak picture. As of Wednesday, NYSE:GM stock was down 5.2%, hovering near $45.47 per share, following the Morgan Stanley downgrade. This marks a sharp reversal from GM's year-to-date gains of over 26.2%, placing the stock under significant downward pressure.
The Relative Strength Index (RSI), a key momentum indicator, stands at 42, suggesting the stock is nearing oversold territory and is approaching a bear zone. This indicates potential further downside if selling pressure continues to mount.
Bearish Gap Down: More importantly, the daily price chart shows a gap down pattern, a clear bearish reversal signal. When a stock opens at a lower price than its previous close without trading in between, it creates a gap, often reflecting negative sentiment or new bearish information—such as this downgrade. The gap remains unfilled, adding to the negative outlook.
GM's next critical support level lies at the $42 pivot. Should the stock dip below this level, it could trigger a larger sell-off, dragging NYSE:GM even deeper into bearish territory. Investors will be watching this zone closely to determine whether the stock will hold or break lower, which could catalyze even more selling pressure.
False Dawn or Opportunity?
Despite the current headwinds, GM's stock has rallied over 80% from its lows last November, largely due to factors like the resolution of the UAW strike, the gradual ramp-up of its EV production, and a resumption of Cruise robotaxi rides after a brief suspension. However, the stock's latest downturn raises the question: was this recovery a false dawn?
While the company has made strides in expanding its EV lineup and autonomous driving capabilities, many analysts are wary of its ability to maintain momentum. Rising competition from Chinese automakers, combined with the immense capital required to stay at the forefront of AI and EV technology, puts GM in a challenging position.
For now, Morgan Stanley's downgrade seems to reflect broader concerns over GM's ability to sustain market dominance in the face of these challenges. But with a robust presence in gas-powered vehicles and a growing portfolio of EVs, some investors may still see value at these levels, particularly if GM can address its core challenges and continue its transition to the next generation of automotive technologies.
Conclusion: Tough Roads Ahead for GM
As it stands, NYSE:GM faces a confluence of challenges: increased competition, rising costs, and weakening demand in key markets like China. The technical outlook remains bearish, with further downside potential if the stock breaks below its support at $42. Fundamentally, NYSE:GM must navigate these hurdles while continuing its aggressive shift toward AI and EV technology. Whether or not the stock can recover from this dip will depend largely on its ability to adapt in this increasingly competitive landscape.
Investors should keep a close eye on GM’s next earnings report and market moves, as these will provide more insight into whether this sell-off represents a buying opportunity or the start of a larger downturn.


Morgan Stanley _ Chance to Make HUGE PROFIT + 442%.Morgan Stanley Trading within the Rising Channel Pattern and has Breakout the Triangle Pattern. If Breakout above the Resistance level, market significant Bullish Trend then the 1st Target is the Channel Top price around USD 350 or more, depending on the time. And 2nd Target is the Triangle Pattern Target price at USD 572. Offering a Chance to Achieve +442 % of HUGE PROFIT. This is Long-Term Analysis, must follow the Trend Continuation Technique.
Support me; I want to Help People Make PROFIT all over the "World".

#MS $MS98.30 ABOVE strong upmove possible
99.50/100.50/102/104 then will review again for new target
20 ema above close today

Morgan Stanley Surges on Q1 Profit Driven by Investment BankingMorgan Stanley ( NYSE:MS ), the stalwart of Wall Street, delivered a resounding victory in its first-quarter earnings report, surpassing analyst expectations and igniting a 3.7% surge in its shares. Buoyed by a robust resurgence in investment banking activities and impressive growth in wealth management, the bank's stellar performance underscored its resilience amidst a volatile economic backdrop.
Investment Banking Renaissance:
A standout performer in Morgan Stanley's ( NYSE:MS ) arsenal, investment banking revenue soared 16% year-over-year, propelled by a flurry of high-profile deals and a buoyant market for fixed-income underwriting. The bank's adept handling of bond issuance and strategic advisory services contributed to its formidable position in the competitive landscape.
Wealth Management Ascendancy:
Morgan Stanley's wealth and investment management divisions emerged as veritable pillars of strength, buoyed by a surge in client assets and robust revenue growth. CEO Ted Pick lauded the bank's momentum in investment banking and highlighted the prospects of a multi-year M&A cycle, buoyed by geopolitical dynamics and a shifting international footprint among corporations.
Navigating Economic Uncertainty:
Despite the backdrop of economic and geopolitical uncertainty, Morgan Stanley exuded confidence in its ability to navigate choppy waters. CFO Sharon Yeshaya emphasized the bank's strong backlogs and momentum across its diverse business lines, underscoring its resilience in the face of external headwinds.
**Regulatory Scrutiny and Strategic Focus:**
Amidst its triumph, Morgan Stanley faced heightened regulatory scrutiny in its wealth management division. However, CEO Ted Pick reassured investors of the bank's steadfast commitment to robust client onboarding and monitoring processes, underscoring its proactive approach to regulatory compliance.
Strategic Expansion and Future Prospects:
Morgan Stanley's investment management division showcased promising growth, with plans to double its private credit portfolio to $50 billion in the medium term. The bank's strategic initiatives underscore its commitment to capitalizing on emerging opportunities and bolstering its position as a global financial powerhouse.
Technical Outlook
Morgan Stanley ( NYSE:MS ) is up 4% in Tuesday's trading session with a moderate Relative Strength Index (RSI) which sits at 51.03 indicating bullish sentiment towards the stock. The 4-month price chart movement indicates a hanging hammerhead to validate the thesis, the stock's next candle stock will accentuate the bullish thesis.

Amidst Regulatory Scrutiny, Morgan Stanley Shares Drops 5.25%Morgan Stanley ( NYSE:MS ), one of the titans of Wall Street, finds itself under the regulatory spotlight as US authorities intensify scrutiny into its wealth management arm. Reports of probes by the Securities and Exchange Commission (SEC), the Office of the Comptroller of the Currency (OCC), and other Treasury Department offices have sent ripples through the financial world, causing the bank's shares to plummet by 5.3%—the steepest drop in five months.
The focus of these investigations? Allegations of inadequate measures to prevent potential money laundering by affluent clientele. With a sharp eye on the identities of high-risk clients, regulators are delving into whether Morgan Stanley ( NYSE:MS ) has upheld robust diligence protocols. Specifically, the SEC and the Treasury's Financial Crimes Enforcement Network (FinCEN) are seeking insights into dealings with international clients exhibiting suspicious financial behavior, some of whom had been flagged by E*Trade, a digital trading platform under Morgan Stanley's umbrella.
This regulatory scrutiny comes at a critical juncture for Morgan Stanley ( NYSE:MS ), as its wealth management division emerges as the cornerstone of its revenue stream, contributing nearly half of the company's earnings last year. The increased government pressure to fortify anti-money laundering controls reflects broader efforts to combat financial crimes and adhere to international sanctions.
Acknowledging the gravity of the situation, Morgan Stanley ( NYSE:MS ) has affirmed its commitment to bolstering internal controls and procedures. Meetings with Federal Reserve officials and detailed action plans submitted to regulatory bodies underscore the bank's proactive stance in addressing concerns raised by authorities.
Yet, challenges persist as the OCC issues formal warnings, signaling the urgency for executive intervention to rectify identified lapses. Such regulatory notices, which demand immediate attention, could potentially escalate into deeper investigations or enforcement actions if compliance standards aren't met satisfactorily.
As Morgan Stanley ( NYSE:MS ) navigates these turbulent waters, investors and industry observers keenly await developments, with the bank's reputation and financial stability hanging in the balance. Will the financial giant emerge unscathed, or are stormy days ahead for its wealth management division? Only time will tell as the regulatory saga unfolds.

📈 CITIGROUP GETS UP TO RECOVER, BREAKS THROUGH MULTI WEEK HIGHSCitigroup stocks hit highest since March 2022, last up 5% as brokerage Morgan Stanley upgrades NYSE:C to "overweight" from "underweight", as well as NYSE:BAC and NYSE:GS to "overweight" from "equal-weight".
Brokerage sees a rebound in capital markets amid growing signs of an imminent rebound in dealmaking. Also expects regulators to ease the Basel III Endgame proposals, a set of rules that will make capital requirements stricter for banks, which have been one of the flashpoints in the industry for months.
Brokerage says the proposals could be eased to be more aligned with Europe so that European banks do not have an unfair advantage.
Any easing of the draft rules will open the door for a significant increase in stock buybacks, as large-cap banks sit on the highest excess capital levels ever - NYSE:MS .
The main technical graph says that NYSE:C shares add +5.25% on Tuesday, break through multi week highs, with possible further recovery to multi year top $80 level.

MORGAN STANLEY Strong buy signal at the bottom of a Channel DownMorgan Stanley (MS) has been trading within a Channel Down pattern since the beginning of the year and on Friday hit again the Lower Lows (bottom) trend-line. Today it formed a MACD Bullish Cross on the 1D time-frame and is issuing a strong buy signal as every time it appeared, in the last 12 months, the price rose by a +8.16% to +27.31% margin.
Taking the +8.16% minimum, the price targets $83.50, which is above the 1D MA50 (blue trend-line) but still just below the (dashed) inner Lower Highs trend-line. On a 4-month horizon, we expect an even higher price at around $90 (within Fib 0.618 - 0.786 as the July 25 High).
-------------------------------------------------------------------------------
** Please LIKE 👍, FOLLOW ✅, SHARE 🙌 and COMMENT ✍ if you enjoy this idea! Also share your ideas and charts in the comments section below! This is best way to keep it relevant, support us, keep the content here free and allow the idea to reach as many people as possible. **
-------------------------------------------------------------------------------
💸💸💸💸💸💸
👇 👇 👇 👇 👇 👇

MS Morgan Stanley Options Ahead of EarningsIf you haven`t bought MS here:
Then analyzing the options chain and the chart patterns of MS Morgan Stanley prior to the earnings report this week,
I would consider purchasing the 85usd strike price Calls with
an expiration date of 2024-1-19,
for a premium of approximately $1.85.
If these options prove to be profitable prior to the earnings release, I would sell at least half of them.
Looking forward to read your opinion about it.

Morgan Stanley - Weekly AnalysisMorgan Stanley - Weekly time frame Analysis
Its traveling in a wedge pattern, once the TG1 is reached, there will be a small pull back, once it is broken, then it will travel towards TG2.
Note: This is only for educational purpose.

MS Morgan Stanley Options Ahead of EarningsAnalyzing the options chain of MS Morgan Stanley prior to the earnings report this week,
I would consider purchasing the 90usd strike price Calls with
an expiration date of 2023-8-18,
for a premium of approximately $0.82.
If these options prove to be profitable prior to the earnings release, I would sell at least half of them.
Looking forward to read your opinion about it.
