Keep scenario with downside retracementMorning everybody,
Although yesterday BTC has not started retracement that we've discussed, we still keep on the table this scenario with possible drop to 3950 area.
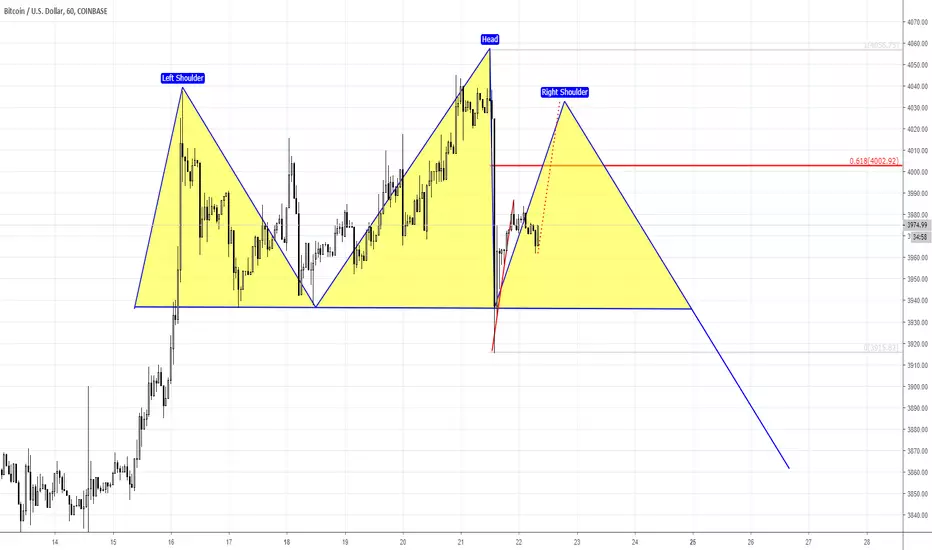
Now market turns to sideways action, formed butterfly "Sell" that could become a part of H&S pattern that we're placed here.
Morten

Pullback to 3950$Morning guys,
BTC keeps short-term bullish sentiment and we're still keep on the table 4085$ target.
Still, as bitcoin has formed bullish reversal swing on 1H chart - deep retracement is highly probable today, especially with DiNapoli DRPO "Sell" pattern on the back.
Thus, before upside continuation will start we expect pullback to 3950 area

Back to 4085$Morning guys,
BTC perfectly has responded on our conditions. As upside action on 1H chart has happened too far above neckline of former H&S pattern, it means that
this is not a retracement on a way down but re-establishing fo upside action on 4h chart. So, yesterday '222" Buy setup has worked perfect.
On this background we turn back to our major 4085$ target on 4H chart. Recent action suggests that it is not time to go short by far.

Perfect 3-Drive "Sell" startsGreetings, guys,
here is another insight from our day by day videos on ForexPeaceArmy. Perfect setup on gold that we were waiting for the whole week.
As soon as all upside targets have been hit around 1322 area - gold turns south. Nearest target is 1304-1307 area. But, potentially we will watch for downside action and large daily AB=CD pattern.

3950 is clue to short-term directionMorning guys,
our H&S setup has done well and market has hit minimal AB=CD H&S target. Now, price stands at strong 4H support area and we expect upside bounce today.
3950 should become a signal area. Since this is neckline of H&S pattern - BTC could show upside retracement, forming AB-CD and "222" Sell pattern. But, to keep bearish sentiment valid it should not break
above it. So this simultaneously entry point for bears and signal area for bulls. If, somehow BTC shows upside breakout of 3950 and keep going higher - it means that H&S is done and we are on the road to 4085$ target, which is still valid.
If no surprises happen and BTC turns south around 3950 - watch for XOP target around 3770$

BTC updateMorning guys,
Market shows contraction type of action and previous week was standing in very tight range. Last week we've discussed 1H chart H&S pattern.
Since we have 1.27 type of H&S we expect higher top of right arm. At first glance, H&S almost stands in place (just take a look at our Friday's post),
but the price action of right arm shows too slow and too gradual action that is not typical for H&S.
It makes us think that we still have chances to see BTC around 4000 area in a shape of upside AB-CD retracement.
Thus, bears have to look at two levels - 3915 is neckline. Once it will be broken it means that downside action has started, and ~4000$ - AB-CD target and potential top of right arm of H&S pattern.
What to do if 4000 level will be broken up? Recall 4H large AB=CD with 4085 target. In this case we should get upside butterfly and reversal down happens by not intraday but daily pattern around 4100 area.

Tricky H&S patternMorning guys,
BTC was not able to reach our 4085 target (at least right now) and dropped. Recent plunge creates potentially tricky situation when BTC leaves behind uncompleted targets.
This is additional risk factors for bears as market could return and hit targets before real downside reversal. Thus our task is to eliminate or minimize the impact of this risk.
On 4H chart (check previous update, guys), BTC was not able to complete butterfly erase it. Now we have H&S pattern on 1H. First step that we're watching for is deep upside retracement.
We probably will get "222" sell around 4000-4030 area and it also will be top of the right arm. Here is just two ways for taking short position. Either do it right at the top of the arm with stops above 4090 (because targets still could be hit). If it is too much - wait when H&S will start to work and BTC starts dropping below neckline. It is not as attractive but safer.
Still watching for 4085$Morning guys,
today we show the same scenario but at different scale - on daily chart. In recent 3-4 sessions market was standing quiet and
doesn't show any action that could harm our trading setup. So, we're still watching for completion our AB-CD target on 4H chart around 4085$
As you can see here, on daily chart - this should give us '222" Sell pattern and downside continuation.
Right now price action looks like flag or pennant consolidation which supports idea of upside continuation and completion of our AB-CD pattern.
Bearish tendency will be broken only if market will climb above recent tops and break even theoretical chances on butterfly pattern.

4085-4100$ is next targetMorning guys,
So, on Friday you could make shure how useful is high wave pattern. Our doubts on immediate downside continuation have been confirmed as BTC rallied up.
Today-tomorrow we will watch how BTC completes the XOP target around 4085 area. Currently it seems that it could be done by butterfly "Sell".
4100 area is also important for higher time frames, because if market is still bearish indeed - it has to turn down from 4100. If this will not happen - be prepared to more significant rally on daily chart.
As soon as BTC completes our 4085-4100 target - we will get "222" Sell pattern as on daily chart as on 4H.

All eyes on HWave patternMorning guys,
This update needs to be combined with our previous chart of 1H H&S pattern.
BTC action is becoming tricky because of too slow action after completing bearish patterns. As a rule, once bearish pattern is formed - trend accelerates down. But here we have another story, and
situation on daily charts starts getting signs of bullish dynamic pressure.
It means that chances on completing greater AB=CD pattern here are not zero, so we could get greater "222" Sell on daily around 4085$ area as I draw here.
High wave pattern could help us a lot, especially because it becomes the top of the right arm of our H&S pattern on 1H chart that we've discussed recently.
High wave is very useful pattern because its top and bottom point the direction once market will break it. And now we need to keep an eye on it. Action above the top of the HW pattern
tells that 1H H&S probably fails and we're going to 4085 while drop below 3800 lows of HW confirms validity of bearish trend.
Thus, bulls should wait upside breakout, while bearish - opposite action before taking position. Those who have taken shorts based on our 1H H&S pattern, now could move stops to breakeven.

3900$ again is the keyMorning everybody,
So yeterday we said that now it's time to search setups for short entry. Yesterday market has climbed a bit higher and now it is easy to identify H&S shape here.
It means that 3900 area - right arm top again will become the key. Upside breakout will mean H&S failure and upside continuation.
Downside turn around 3900 suggests validity of bearish sentiment and downside continuation. So, this is the level where as bulls as bears will make a decision on position taking.
We need just wait a bit, when market will be there.

Time for daily AB=CD?Morning guys,
yesterday we've agreed to keep an eye on major support area on 1H chart and use it as indicator of strength.
So this level has been broken down, which looks not natural for bullish market.
It means that overall sentiment is not very positive here and we suggest downside continuation. First target will be AB=CD based on daily black nasty candle

3840 is a keyMorning guys,
Situation on BTC changes slow right now. BTC has needed almost the whole week to complete our last target. In previous update we've talked about 4H "222" Sell pattern.
Now finally it has been completed. In general market shows good background for short-entry, but we need to get a bit more confidence.
Now, on 1H chart "222" Buy is forming and 3840 area is strong support. It is high probability that some upside bounce will happen. We need to watch how strong it will be.
If BTC jump up and move above recent tops - it is not time yet to go short. Minor, 30% bounce up and following downside breakout of 3840 area means that bearish trend continues.
Thus, we have multiple setups here. Scalptraders could work directly with "222" Buy, while daily traders search chances to go short - either against recent tops or after 3840 breakout using minor retracement.

3940-3980 is short term BTC targetMorning guys,
Although BTC has dropped a bit after our last discussion, it has not broken previous lows but returned back to 3/8 Fib resistance and keeps chances to show deep upside retracement that we've expected
to see initially. Still, this retracement happens by different pattern - not H&S that we've discussed, but possible "222" Sell.
Now price stands tight under Fib resistance, forming pennant pattern, which suggests buidling of an energy before breakout.
Thus, right now we expect AB=CD upside action to 3940-3980 major 5/8 Fib level and forming "222" Sell. After that we start watching for bearish entry.

Downward should start...Morning guys,
If you remember last week we were mostly focused on intraday setup, because there are no question to overall context - by our opinion it stands bearish and we still think that BTC has to hit chain of targets,
starting from daily 2800 and lower right to 1800-2000 weekly ultimate target.
While on intraday chart there was minor question - how far retracement could go. Once market has formed butterfly we've talked about possible H&S pattern with 3980 target around 5/8 Fib level.
Now, theoretically market still stands above the lows of left arm, but expect downside continuation by two reasons.
First is, this is not the way how bulls should control the market with H&S pattern. Now pattern shows clear signs of failure. The action mostly reminds indecision rather than wide H&S.
Second - "high wave" pattern inside the rectangle was broken down.
Thus, we expect re-establishing of our daily bearish trend.

4000$ retracement is still on the tableGreetings,
As soon as downside reversal has happened, we're watching for moderate retracement to get better price for short entry.
Initially we've expected to get upside AB=CD pattern, but as soon as CD leg can't get started and turned to flat action, it becomes obvious that something different has to be formed.
Now, with wash& rinse of recent lows, we've got potential reverse H&S pattern. Thus, upside retracement is still on the table, but with different patterns.
We're mostly focused on short entry, so do not intend to trade it long, as our context stands on daily chart. That's why we're waiting for either 4000$ level and completion of H&S target, or... H&S failure
Scalp traders who trades on 5-15 min chart could think on long position around right arm bottom.

Following trading planMorning everybody,
So, according to our trading plan that we've disussed yesterday - we wait for minor pullback to take short position on BTC.
Now upside action starts to take the shape and we're watching for AB=CD action right to 3/8 Fib resistance. This should give us "222" Sell pattern.

4140$ is done - time to go short?Morning guys,
On Friday we've missed a bit with downside retracement on 1H chart as BTC has not formed AB-CD pattern but turned up earlier. Still overall trading setup of 2 weeks was successful and
bet on reverse H&S pattern brought good result. Our 4140$ target that we've talked about has been hit.
Meantime, our long-term bearish setup stands intact as well. That is what we discussed in our videos. Despite solid rally to 4140 daily butterfly is valid and BTC has shown sharp reversal session, which suggests
at least further move down, or, as we hope, re-establishing of long-term bear trend, as our major 1800-2000$ has not been hit yet.
We suggest that pullback on 1H chart could reach 3/8 FIb level @ 3895$ which should be suitable for short entry.

Keep up with 3840 retracementMorning guys,
So, it seems our suggestion on deeper retracement was correct. Now we could identify and draw AB=CD pattern, which has a target right at 3820-3840 first 3/8 Fib support area.
Gradual retracement suggests possible upward reversal there, while sharp drop right to 3800 could mean that deeper retracement happens, right to XOP and next strong K-support area of 3700-3740 area.

Dow's last dance - 29'360 Greetings guys,
Here is update for our long-term DJIA and whole global stock market scenario.
We already talked about all time targets on DAX and NASDAQ that have been hit last year. But Dow has not touched it yet.
We expect last upside effort to ~29360 where all-time (since 1929 Great Depression lows) 1.618 target stands.
As you understand, as soon as this target will be hit - we expect long-term bear trend on all stock markets across the board.

4140 is on the table, but after minor pullbackMorning guys,
Two days ago we've said that BTC has hit valuable resistance of major 5/8 Fib level and AB-CD target. Thus, taking in consideration strong upside momentum we keep on the table
upside scenario with 1.618 AB-CD (XOP) target around 4140 which is based on 4H reverse H&S pattern.
Meantime, now we see clear signs of bearish pressure on 1H chart, as market can't continue upside action immediately. Stops above the top have been grabbed by the spike (wash& rinse)
Thus, we expect tactical retracement first to 3/8 Fib support area of 3800$ today.

4140$ is next BTC target Morning guys,
Well BTC has completed our short-term target rather fast. Unfortunately it is not possible to put all charts here to show you the whole picture. But, on 4H we have H&S pattern and first 3900 target has been hit. This is AB=CD objective point an major 5/8 FIb level. So, we're at Agreement resistance.
Rally shows very good momentum and trading volume. This lets us count on reaching ultimate 1.618 H&S target @ 4140$. But first, we expect minor pullback, somewhere to 3800$ area.
For us it seems logical solution trying to go long at first 3/8 Fib support @ 3800$ with stops below K-support (3700-3720) and profit around 4140 target.
No bearish setups exist by far.

3900 is a target of upside retracementMorning guys,
I keep the same picture intact, which we've placed week ago. Technical reason for short-term recovery is "222" Buy pattern. At the same time pullback makes no impact on longer-term
bearish context by far. To break it market needs to climb above 4300$ area. Now this upside action makes impact only on the daily butterfly shape, but not on its target.
So, as we've suggested - we could get reverse H&S pattern and its classical upside AB-CD action to ~3900$ area. Take a look that this level is also 5/8 Fib support.
Indeed, BTC was able to keep H&S shape and hold above 3500 area - bottom of the shoulder.
Now market stands at tricky area - neckline, trendline resistance and 3/8 Fib level. Good check for BTC bullishness.
Invalidation point stands the same, if market somehow will fail to break neckline up and start dropping below 3500$ - we're going to our major daily 2800$ target.
Otherwise, upside target, as we've said - 3900$. Thus, bearish traders should wait either AB=CD upside target completion of H&S failure.
For bulls we do not see yet long-term perspectives, only scalp trade could be done, using the same H&S with stops below the lows of right arm.
