Volatility - Nothing New Under The SunIdea for Volatility:
- Wyckoff Cycle Mapped.
- Wave Frequencies synced.
- Cause and Effect determined.
- Greater Cycle:
- Bonds Volatility looks ready:
- China Credit Impulse turns negative, consequently the global credit impulse turns negative.
- Liquidity Flow: Credit > Bonds/Currencies > Commodities > Stocks.
Fighting the Fed:
- Reading the Curve:
- Data Suppression:
- Volatility Suppression:
- DXY is in a rising Trend:
- Decision point for the Dollar:
- Dollar is goosed, but Yen seems to be telling, as the Yen is seen as a haven currency and AUD is correlated to inflation:
- Yuan is very telling for the global economy:
- Bond yields (CN & US) are telling:
- Forecast suggests a Volatility spike this summer.
- It is likely that a greater explosion in Volatility will follow... speculating the date to be September Quad Witching 2022 (September 16, 2022).
It's Black Swan season... Look out for them, but they are never the cause. It is all about the Credit Cycle.
GLHF
- DPT
Move


ETH next move consolidating next Up? Eth has since come down as predicted in my last analysis meeting the $2200 support zone.
Now Eth is pumping on the 1hr chart, while the 12 hourly seems bearish and the 4 hour seems to be reversing the bearish trend.
looking at the RSI and MACD here there is a convergence on the MACD while Eth had come down to $2200 indicating that Eth could re-trend upwards now.
So you can be looking for a breakout of the Trend line anywhere up to $2500 as indicated on the chart. Pay attention to the triangle formation, as it could come down to the right the bottom edge of the triangle point, meeting the major support zone approx $2244 again before begining the Bullish up.
Long entry $4200 SL $2390
Short entry $2425 SL $4230 or until buy signal .
*Disclaimer: Not a financial advise. Please inform your decision based on your own analysis.
Thanks
Marlene


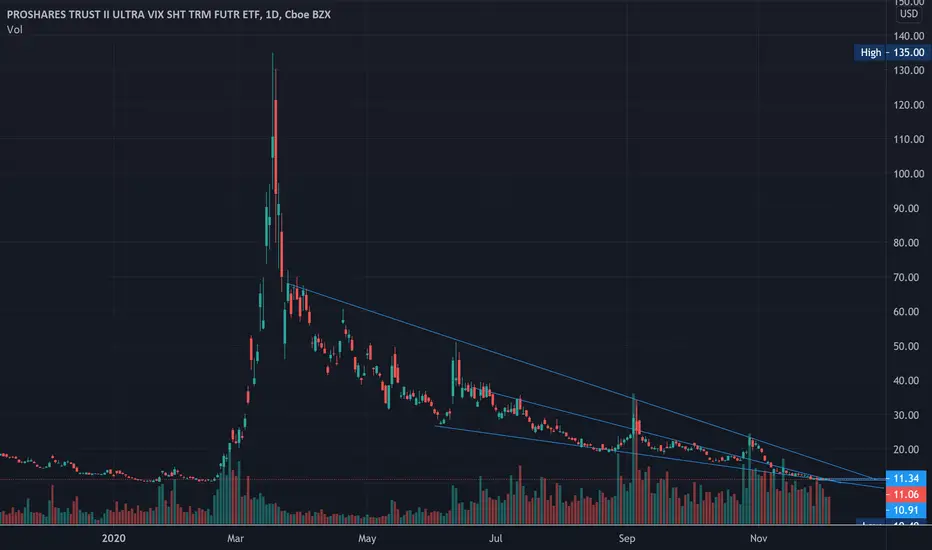
UVXY & VIX about to MOVE?Signs of an incoming swing upwards.
Move index showing signs of a big volatility spike.
UVXY money flow showing money is piling into the hedge as they did back in February 2020.
SPY CMF showing the big money has exited (not shown on this chart).
Bullish divergence marked on the charts RSI and CMF.
Higher lows on Thursday and Friday. Wednesday would have been the same if it weren't for the Powell Pump in the afternoon.
Not investment advice. I am not an expert. Good luck to all!


Ethereum is clearly bearish in the short term!I expect a correction in Ethereum before we push higher!
- Rising wedge
- Falling volume rising price
- Bearish histogram divergence
This is not trading/investment advice! Trade and invest at your own risk.
- Stay profitable

Big move is expected !Stock is consolidating for some days, Big move is expected in near future so be careful :- Opportunity ahead !!

Bitcoin - nowaday chart move and divergence - compare to historyBitcoin - nowaday chart move and divergence - compare to history

Lithium ETF - Needs a small pause to recharge 🔋🔋🔋Lithium has been one of our most successful 'explosive' trades and it has proven as right.
Our first post on June 17, 2020 was the beginning of a series of trades on our ETFs account and the price has over-doubled ever since.
Later on we posted this about how 'Lithium is power' and indeed we had a further rise of over 40% until then.
At this stage we have reduced our positions dramatically as we expect a correction as shown on our chart.
ps. we do a LOT of research on Lithium and others. We highly recommend this YouTube channel📺 for Lithium research, news and interesting facts, as well as plenty of Tesla research and analysis.
(and also this Lithium from the legend, Kurt Cobain👼🎸)

GBP/AUD Bullish BreakoutGood morning traders, today we bring you our short and medium term analysis in GBP/AUD, which we consider has good upside potential.
🔸As we see in the 4H chart, after the bounce in the Support Zone, there was a very clean upward movement, generating a breakout of the Descending Trendline.
🔸Now, what we expect is a corrective move, which can be towards the nearest support zone or a throwback to the broken trendline, before resuming the bullish movement.
🔸Regarding the target of the movement, the most imminent zone is the Resistance at 1.8200.
🔸If we look at the daily chart, we see that it supports the vision of the 4H chart, since the price generated a fakeout of the Descending Trendline, and then with the bullish momentum it managed to penetrate the long-term Descending Trendline.

Golds next moveGolds next move upward should be confirmed soon, as the consolidation pattern has already been damaged.
My suspicion is that we will see a close to 20% rise until April, followed by a retest of old highs.

KEY WEEKLY - UPDATE 12/22/2020 - There's a Bull Run? Had No IdeaWe're still seeing consolidation! This is a very long period of consolidation, obviously, which generally means a bigger move when it eventually comes because you have that much more accumulation that's taken place. More sideways movement means bigger eventually up movement. (hopefully that holds true here at least lol)
We did see our first substantial buy volume in some time on last weeks candle, though it was snuffed out fairly quick into this weeks. That said this week is very young and the alt's are moving like we stole them so there's an alright chance this candle or the next we'll start seeing a breakout.
We're closing in on the end of our wedge, so we gotta move somewhere!
I don't think we'll break down from here, Just can't see that in the cards with how many opportunities it has had in the past... well quarter really. But if it does our support levels are marked in yellow.
RSI is in an interesting spot, showing some strength for the first time since Mid September before stalling just outside oversold.
MACD is fairly neutral: strong position but stalled in a bearish cross.
Short term targets marked green on a breakout if you're trading it that way. If you're holding long term top TP would be good to secure SOME profit, but likely much more headroom long term (see prior ideas for potential targets there.)

UVXY is ready to move up within the next 30 days.The descending wedge is bullish and the coming to an end. This along with an over bought S&P and a 3 hammers showing on the daily charts indicates to me that as early as next week to the end of December we will see a major break to the upside.
CHMA - Long IdeaA close above $5.33 would be bullish. Target = 6.50
It may chop around until the wedge resolves itself which would be Oct 2nd = a time stop
A close below the break of the diagonal trendline or 21 EMA would negate the trade.

ROKU $165 or $130ROKU has major trend support coming up that could propel the stock to ATH. If it fails, we could see this fall pretty quick back to $130 and create a whole new channel. if this consolidation breaks 152, we should see a nice $8 run up


Called Top and it followed my plots for 48hrs!I knew I was on to something after I called the triple top and it followed suit with the long term bear trend I noticed. It started bouncing around in my channels and ranges as expected, so I drew a plot for shits and giggles. Damn if it didn't start following my plots as I drew them! Went to sleep and it followed everything perfectly for almost a whole day! It only diverged because the Bulls didn't put up as much fight as I thought they would. So it's even weaker. Today had all the signs of a classic bear trap. Dead all day, then an artificial run up in price at cash close to drum up some business and hand the bag to new retail investors. You gotta think bigger, never narrow. From 1min to max chart. To Infinity and Beyond! There's a lot of crazy meta fractal Fibonacci stuff going on here and the charts don't lie!
Even at a lower level it still followed my trend lines from past events, as well as getting general inflection points correct 2 days out. So I think I'm on to something here! What really made me smile is it hitting the same inflection point I called right before another big leg down. It looks like it's going to converge with my path again, perhaps. We'll see. Might be getting too distorted and I need to re-plot. It's possible we make another run back to the 311 area Friday, but I'm still calling it a continuation of the bull trap with lower highs and very low volume. P/C ratio has dropped, so volume will increase rapidly at first when they're convinced we're going back to 3200, that even they don't want to buy at that level themselves. I don't know why it's so hard for them to understand that there is always a limit, both ways, not just the ground. Actually with oil it can go negative, so think on that.

VISA INC chart analysis:On one day chart price is forming new high on the peak.
Below 186.36 confirm bearish.
The price has Strong internal support 186.36 near this level.
The volume declining but though, it has more volume then normal.
As it has a support price can move up.
If the price cross the 202.34 level it can still further move up-to 208.54

Do we really live in COMMUNISM?Hi traders,
we see a very strong UP movement in the pre-market now and my question is very simple: "Do we really live in communism?"
This strong move came after the FED´s meeting, where those guys created another anti-capitalist support mechanisms.
I have never thought, that it will happen in America.
Be careful of some price Action analysis, because the direction of the whole Stock Market is driven by the fundamental news, such as the FED announcement.
I hope you can find some good entries.
Jakub
FINEIGHT

BTCMOVE: Scalp long volatility Market is boring, bitcoin doesn't move, so, on the one hand I can only wait for some movement and react to it after, but on the other hand I can react on the waiting of the movement itself (or no movement), i.e long / short volatility.
I think there should be some kind of strong movement soon, so I've decided to long BTCMOVEWK0501 contract (straddle) on FTX with strike at $7483.
Hope to catch 10% movement, invalidation - falling 4-5% below, I follow the position closely.
Hit the "LIKE" button and follow to support, thank you.
Information is just for educational purposes, never financial advice. Always do your own research.

BTCMOVE0413: Bought Volatility (options trading)Expecting some volatility closer to the close of the day. Bought volatility via BTCMOVE0413 contract; i.e expiring today.
Will cut it if quickly volatility continue to dry down.
Hit the "LIKE" button or sign up with my ref links below to support, thank you.
Information is just for educational purposes, never financial advice. Always do your own research.
