MOVE (SPOT)BINANCE:MOVEUSDT
#MOVE/ USDT
Entry range(0.1530 - 0.1560)
SL 4H close below 0.1490
T1 0.17
T2 0.18
T3 0.20
T4 0.22
_______________________________________________________
Golden Advices.
********************
* collect the coin slowly in the entry range.
* Please calculate your losses before the entry.
* Do not enter any trade you find it not suitable for you.
* No FOMO - No Rush , it is a long journey.
MOVEUSDT
MOVE/USDT – Long-Term Breakout WatchTimeframe: 4H (Long-Term Setup)
MOVE is testing a long-term descending trendline. After months of consistently lower highs, we may be on the verge of a bullish breakout.
The previous breakout attempt in April was a fakeout, but the current consolidation near resistance looks healthier and more sustainable this time.
Key Levels to Watch:
Resistance Levels (Upside Targets):
$0.1446 (Current Zone / Breakout Level)
$0.2265 – Mid-term target
$0.3397 – Key structural resistance
$0.5449 – Long-term target if trend reverses fully
Support Levels:
$0.1312 – Immediate support
$0.1173 – Major long-term base support (strongest defense)
Suggested Stop-Loss:
Below $0.117 (invalidates breakout structure)
Outlook:
If MOVE breaks and holds above the descending trendline, a major trend reversal could follow.
The setup suggests accumulation at the bottom, and volume confirmation will be key.
Patience is crucial — this is a long-term opportunity, not a quick trade. Small caps often move explosively once supply zones are cleared.
DYOR | Not Financial Advice
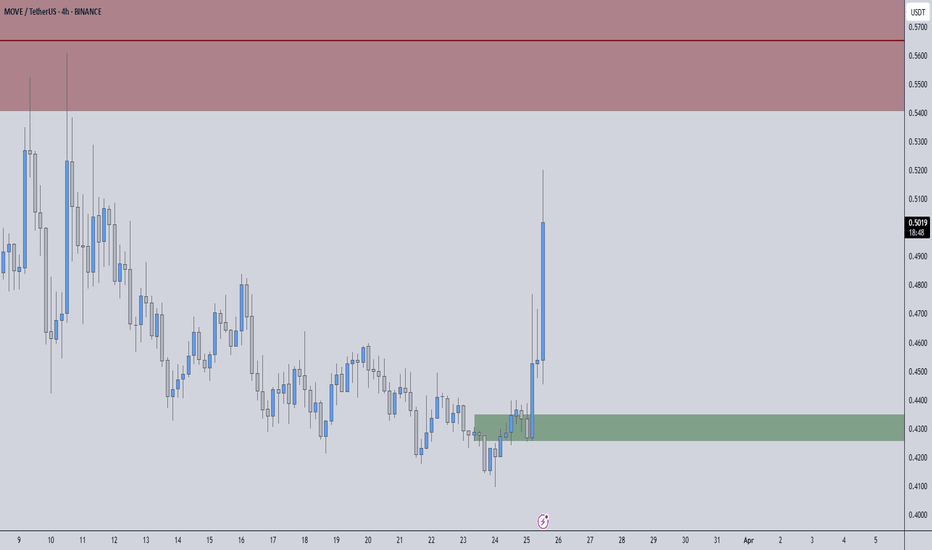
MOVEUSDT – High-Probability Setup, Stay Sharp📌 Key Levels Mapped Out – Now It’s About Execution.
🟢 Green Box = Strong Support – Buyers are showing interest, but confirmation is key.
🔴 Red Box = Major Resistance – A reaction here could lead to a solid rejection.
How We Approach This:
Support Holds? → We wait. LTF breakouts + CDV confirmation = high-confidence long. No guessing, just data.
Resistance Rejected? → No blind shorts. LTF shift bearish + CDV confirmation = strong setup.
Breakout? → We don’t chase. Retest + volume confirmation = real trade opportunity.
Most traders get caught in emotions—we don’t. We move with structure, volume, and confirmation.
Stay disciplined, execute the plan, and let the market do the work.
✅I keep my charts clean and simple because I believe clarity leads to better decisions.
✅My approach is built on years of experience and a solid track record. I don’t claim to know it all but I’m confident in my ability to spot high-probability setups.
✅If you would like to learn how to use the heatmap, cumulative volume delta and volume footprint techniques that I use below to determine very accurate demand regions, you can send me a private message. I help anyone who wants it completely free of charge.
🔑I have a long list of my proven technique below:
🎯 ZENUSDT.P: Patience & Profitability | %230 Reaction from the Sniper Entry
🐶 DOGEUSDT.P: Next Move
🎨 RENDERUSDT.P: Opportunity of the Month
💎 ETHUSDT.P: Where to Retrace
🟢 BNBUSDT.P: Potential Surge
📊 BTC Dominance: Reaction Zone
🌊 WAVESUSDT.P: Demand Zone Potential
🟣 UNIUSDT.P: Long-Term Trade
🔵 XRPUSDT.P: Entry Zones
🔗 LINKUSDT.P: Follow The River
📈 BTCUSDT.P: Two Key Demand Zones
🟩 POLUSDT: Bullish Momentum
🌟 PENDLEUSDT.P: Where Opportunity Meets Precision
🔥 BTCUSDT.P: Liquidation of Highly Leveraged Longs
🌊 SOLUSDT.P: SOL's Dip - Your Opportunity
🐸 1000PEPEUSDT.P: Prime Bounce Zone Unlocked
🚀 ETHUSDT.P: Set to Explode - Don't Miss This Game Changer
🤖 IQUSDT: Smart Plan
⚡️ PONDUSDT: A Trade Not Taken Is Better Than a Losing One
💼 STMXUSDT: 2 Buying Areas
🐢 TURBOUSDT: Buy Zones and Buyer Presence
🌍 ICPUSDT.P: Massive Upside Potential | Check the Trade Update For Seeing Results
🟠 IDEXUSDT: Spot Buy Area | %26 Profit if You Trade with MSB
📌 USUALUSDT: Buyers Are Active + %70 Profit in Total
🌟 FORTHUSDT: Sniper Entry +%26 Reaction
🐳 QKCUSDT: Sniper Entry +%57 Reaction
📊 BTC.D: Retest of Key Area Highly Likely
📊 XNOUSDT %80 Reaction with a Simple Blue Box!
I stopped adding to the list because it's kinda tiring to add 5-10 charts in every move but you can check my profile and see that it goes on..
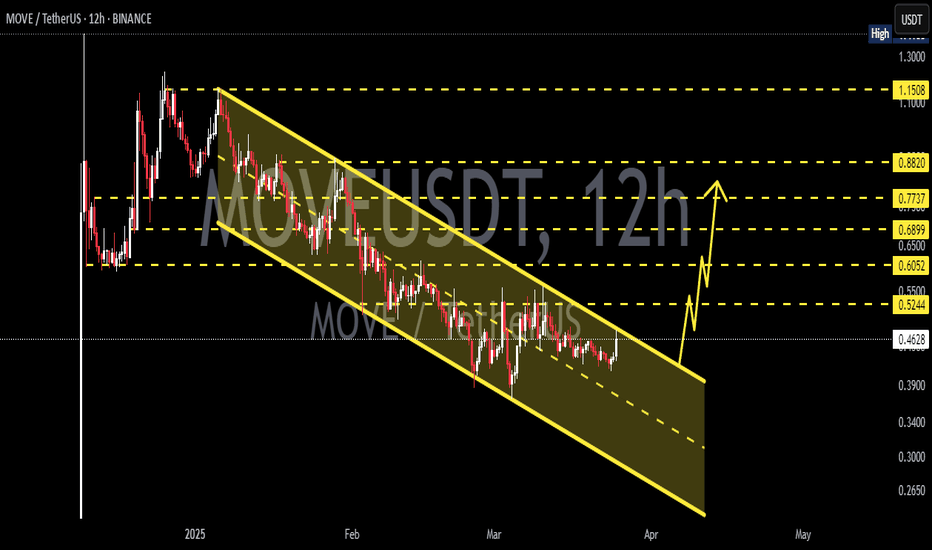
$MOVE Surge 35% Today Amidst a Falling Wedge PatternMovement Network Native token ( TVC:MOVE ) saw its value rise sporadically gaining about
37% today albeit the general crypto landscape saw notable uptick with Solana reclaiming the $140 zone.
As of the time of writing, TVC:MOVE is up 38% trading within a bullish engulfing pattern after breaking past a falling trend channel. With the RSI at 66, this hint at a possible 200% surge in sight- a level that aligns with the token's ATH.
Movement Network is an ecosystem of Modular Move-Based Blockchains that enables developers to build secure, performant, and interoperable blockchain applications, bridging the gap between Move and EVM ecosystems.
Movement Price Live Data
The live Movement price today is $0.586188 USD with a 24-hour trading volume of $447,749,157 USD. Movement is up 35.13% in the last 24 hours, with a live market cap of $1,436,160,695 USD. It has a circulating supply of 2,450,000,000 MOVE coins and a max. supply of 10,000,000,000 MOVE coins.
MOVE Price Analysis: Key Levels & Potential ScenariosCurrent Market Structure
Since mid-February, MOVE has been consolidating, with a critical support level forming around $0.4371.
This level aligns with a bullish daily gap and the midpoint of a previous candle tail, making it a key area to watch for a potential retest.
Following the mainnet launch, a "sell the news" reaction may test this support level before determining the next directional move.
Downside Risk: Key Support Levels
If $0.4371 support fails, there is minimal historical support below, making a drop more probable.
Possible profit-taking zones include:
$0.3705 (near bulls' stop levels)
$0.3500 (a major psychological support level)
Upside Potential: Resistance Levels to Watch
If MOVE rebounds off support and breaks above $0.4980 (previous rejection zone), the next bullish targets include:
$0.5573 (first major resistance level)
$0.5820 (historical rejection zone)
Conclusion & Strategy
Bullish Scenario: A strong bounce from $0.4371 could lead to a push toward $0.4980 and potentially $0.5573 if buying pressure sustains.
Bearish Scenario: A break below $0.4371 could accelerate losses toward $0.3705-$0.3500, where buyers may attempt to step in.
Key Watchpoint: How the price reacts at $0.4371 will dictate the next significant move. If it holds, bulls regain control; if it fails, further downside is likely.
Movement MOVE price analysisFor more than 3 months, #MOVE price has been steadily falling to the Buy Zone of $0.38-0.47 - did you buy it?
1️⃣ Well, now the first and foremost task is for #MOVEUSDT to confidently gain a foothold above $0.60
2️⃣ And then you can start dreaming about a rapid x3 growth to $1.80 per #Movement coin
Or is it too optimistic, don't you think?
_____________________
Did you like our analysis? Leave a comment, like, and follow to get more
ACHUSDT UPDATEACHUSDT is a cryptocurrency trading at $0.03285. Its target price is $0.06500, indicating a potential 90%+ gain. The pattern is a Bullish Falling Wedge, a reversal pattern signaling a trend change. This pattern suggests the downward trend may be ending. A breakout from the wedge could lead to a strong upward move. The Bullish Falling Wedge is a positive signal, indicating a potential price surge. Investors are optimistic about ACHUSDT's future performance. The current price may be a buying opportunity. Reaching the target price would result in significant returns. ACHUSDT is poised for a potential breakout and substantial gains.
MOVE Jumps 12% as Trump-Linked World Liberty Financial Buys InLayer-2 token MOVE has surged 12% in the past 24 hours, making it the market’s top gainer. The rally follows news that World Liberty Financial, a Trump-backed DeFi platform, purchased $2 million worth of MOVE tokens on Tuesday.
Arkham Intelligence reports that the purchase was made in multiple batches, with the first transaction settling at 14:22 UTC. Just minutes later, at 14:48 UTC, a crypto account on X, DB, claimed that Movement is in discussions with Elon Musk’s Department of Government Efficiency (D.O.G.E). However, Movement’s co-founder Rushi Manche denied any official communication.
Despite the surge, bearish sentiment remains strong. MOVE’s funding rate has plummeted to -0.084%, its lowest since January 7, signaling increased short positions. Additionally, the token has seen consecutive spot outflows totaling $19 million, with another $440,470 exiting the market on Wednesday.
Profit-taking could erase MOVE’s gains, pushing it down to $0.71 or even $0.55 if support fails. Conversely, if demand surges, MOVE could break past $0.87 and head toward $1.08.
The question now: is this just a hype-driven pump, or can MOVE sustain its momentum?
MOVE - 1H A Promising OpportunityTechnical Perspective: BINANCE:MOVEUSDT has successfully broken through a significant resistance zone, a bullish indicator of strong upward momentum. Following this breakout, the price has entered a consolidation phase above the previous resistance, effectively turning it into a robust support zone. This price action indicates accumulation and provides a solid foundation for further growth. With clear targets marked at $1.5000 and $1.7000, MOVEUSDT presents an excellent buying opportunity, offering significant potential for short-term gains.
Fundamental Perspective:
MOVE is gaining traction in the market as a project leveraging innovative decentralized finance (DeFi) mechanisms and gamification in crypto trading. Recent collaborations and updates from the MOVE team have amplified its utility, including integrations with high-performance blockchain networks. The increase in trading volume and growing community support highlight strong market confidence in the project.
Moreover, the overall bullish sentiment in altcoin markets, coupled with MOVE’s unique position in providing accessible DeFi solutions, supports a potential price rally. With these solid fundamentals aligning with the technical breakout, MOVEUSDT has the potential to reach higher price levels in the near future.
This setup provides both technical and fundamental justification for an upward move—don’t miss out on this opportunity! 🚀
Movement MOVE price predictionWhile the entire crypto market is adjusting, the price of TVC:MOVE is growing!)
Now, the capitalization of #Movement is $1.7 billion
However, as long as the OKX:MOVEUSDT price is below the conditional “sell zone” of $0.78-0.88, we are not ready to buy it.
But it would be very tasty to buy it for our portfolio at $0.38-0.47)
_____________________
Did you like our analysis? Leave a comment, like, and follow to get more
d Buy Signal for MOVE/USDT📈 Investment and Buy Signal for MOVE/USDT
✅ Suggestion: This asset is bullish, and you can open a market long position now.
🎯 Target Levels: The labeled price targets will be achieved soon. 🚀
📊 This is a great opportunity for investment and trading.
💬 To manage this signal effectively and access more opportunities:
1️⃣ Follow my TradingView page 📊
2️⃣ Send me a private message for personalized guidance.
💎 Let’s profit together from this bullish move! 💰


