Not another market timing theory....Okay, I get it. Timing the market < time in the market, but I can't argue with the results of this strategy. Here we're going to take a look at a timing model using the popular MACD / MA Cross combination, with a dash of stop loss and a pinch of momentum indication, so let's dive in.
This is "close" to what I use for my personal indicator, although done on a different platform. A while back, I took on the challenge of learning Pine Script for my first coding experience. A lot of copy/paste was used. I published an "Advanced MACD/MA Cross" indicator, with the intent on building it into this strategy.
So yes, first of all, the main signal is a combo MACD / MA Cross on the S&P 500 index ( SP:SPX ). Another important thing, likely the most important thing of all, is this strategy relies on the LOGARITHMIC movement of the S&P. This is very important. When looking at the log movement of a stock or index or whatever, you go from looking at the REAL PRICE to looking at MOMENTUM. In my years of trying to find a decent momentum indicator, I found just looking at the logarithmic movement was best.
Settings for MA Cross are fast 200 TEMA, slow 650 DEMA. I've found it best if the MA types are different (slow MA is also a slower "type") when looking at logarithmic movement. For instance, if your slow MA is an SMA, fast should be EMA. If slow MA is EMA, fast should be DEMA, so on and so forth. This will cause the slow MA to vertical shift down during bull markets and up during bear markets. The settings provided seem to give a good overall indicator of general market movements, but usually it's slow to respond to market entries. My MACD looks at exponential moving averages of 200 and 500 on the S&P, and then applies a 100 day EMA signal line. This provides good entry points in general.
When evaluating these long term trends, sometimes, unexpected things happen in the market that give potential to lose a lot of money. This strategy also implements a stop loss and market "bounce" finder. Stop loss is straight forward. If the strategy detects that the log movement of S&P has dropped by 10 points, a "bond market alert" will trigger. Conversely, the "bounce" finder looks at log movement of S&P from a rolling 17 day period, and if it's moved upwards by 10 points, a "stock market alert" will trigger.
The strategy tester is pretty good, although the equity holds a flat line through the Bond market. This is where a true portfolio backtest would come into play. Look at the list of trades from the strategy tester, input them into a spreadsheet or whatever, and see how this movement indicator would work for your favorite stock over the past several years. Chances are, it'll work pretty well, and a lot better than a buy and hold strategy. While looking, you may want to investigate leveraged long term treasury bonds ( AMEX:TMF ) during the indicated downtime, or index LETF's during the uptrends ( AMEX:UPRO , NASDAQ:TQQQ , etc.), depending on your risk tolerance.
The chart above shows the S&P compared to Vanguard's Long Term Treasury ETF ( NASDAQ:VGLT ), as well as market entry and exit positions, in the first pane. Second pane is the Logarithmic movement of the S&P, and the strategies MA Cross lines. Third pane is MACD (MACD MA's not shown for clarity). Fourth pane shows the "bounce" indicator. Strategy tester goes all the way back to 1950, or the beginning of daily data for the S&P 500. You'll see a few trades missed the mark, but the profit factor is important to note (and keep in mind, this doesn't take into effect BONDS!)
P.S. disclaimer, this isn't 100% exactly what I use for my personal market entry / exit indicators. My personal bounce entry and stop-loss methodologies are slightly different, and I also track an underlying portfolio that will initiate a stop loss if neither stocks or bonds are working (i.e. 2022). And also, I'm not a financial professional, this isn't financial advice, yada yada yada.
P.P.S. please forgive me if the formatting doesn't end up right here, never published a strategy before!
Moving_average

BBY - emerging uptrendConfluence of factors to support this view:
1. golden crossed on 4Jan23
2. 200 day MA is now flattening out
3. beginining to break out of a 2 month sideway consolidation (>86.89)
It is possible that the stock could dip back briefly into the consolidation range in the near future but we are likely to see a higher low should this happen.
Disclaimer: Just my 2 cents based on pure TA and not a trade advice. Kindly do your own due diligence and trade according to your own risk tolerance and don't forget that money management is important! Take care and Good Luck!

Cardano Bullish BreakoutHey Trader!
This analysis is based on an Ascending Triangle. Since the price of Cardano has been moving in a bull market lately, it is not uncommon to see a formation like an Ascending Triangle that will have a bullish breakout. Below the price and the triangle are two notable support levels which have a major impact on Cardano's buying power. These two support levels are located at 0.3295 , & 0.2657 . Based on the recent price action, Fibonacci indicates a target at 0.5562 which can be reached as a result of a potential bullish outbreak from the triangle. In addition, Cardano's market price has crossed the 50-day moving average which in itself indicates a buy recommendation (the 50-day moving average is visualized by the grey line).
I hope this analysis was instructive and can be used for future consideration of Cardano's situation and the potential that can be exploited.

BTC/USD Death Cross on the weekly MA.Just a simple observation without too much fuzz. A mega pump could avoid the cross over, but it feels more likely than unlikely to happen. A crossover would place downward pressure on price in my opinion.

TOST - Emerging from BaseTOST hit bottom 8.5 months ago on 12 May 2022 and began a 2 stage basing, lasting 3 and 5+ months respectively (pink and blue box shown on chart).
During its basing, there were high volume accumulations on numerous occasions.
Stage 2 basing occurred over 5.5 months with the stock whip-sawing around its 200 day moving average until the MA is no longer downward sloping but completely flat now (and ready to turn up...).
Yesterday the stock finally pierced above the a critical neckline @ 22.50 and has remained above so far. The odds of this being a successful breakup is much greater now owing to the shift in overall market sentiment.
An aggressive trader would enter on the breakof the neckline (Entry 1) with initial stop loss placed just below the most recent pivot low @20. The more conservative trader could wait until the uptrend is slightly more established and enter at #2.
Watch out for earnings expected on 14 Feb.
Disclaimer: Just my 2 cents and not a trade advice. Kindly do your own due diligence and trade according to your own risk tolerance and don't forget that money management is important! Take care and Good Luck!

Cardano Moving Average crossHey trader!
This analysis is based on a bullish development for Cardano. The analysis uses the EMA Moving Average which indicates that the 50 day moving average (orange line) has just hit the price indicating a current good buying opportunity for Cardano now. With some support levels at 0.2437, 0.3292 , & 0.3637 providing a good safety net where price can potentially pick up support. In addition, the fibonacci indicates that the price can reach the new target at 0.4997 which will give a nice return of 23.93% .
I hope this analysis was instructive and that it can be taken into account in future considerations about Cardano.

USD/JPY Massive Sell 250 PipsBasically after the BOJ decided to increase the interest rate we have seeing the yen gaining strength again the dollar and break bellow the weekly support and now price is testing it as resistance, daily and H4 we see a nice respect of market structure to downside continuation and H1 we clearly see price respecting the 50% fib level, and broke the counter trendline and in confluence with triple test. which give is more momentum to push down
Nice risk to reward
Follow me for more breakdown
Leave a comment with your ideas

Usd/chf potential continuation sellSo basically we have 3 retest for the 61.8% fib level confirming a solid a resistance and nice grab of liquidity that push price lower, let wait for price to come to at least 38.2% or to 61.8% fib for a continuation to downside
Nice risk to reward
Follow me for more update
Thank you so much

NZD/USD potential buy 70pips we have seen price is still on upward trend, structure is till maintaining the 78.8% fib level and continuing to our target of -21%, currently we see price retesting the 38.2% twice , and support still respect , lower timeframe like 15min we see break of neckline indicating transition from pullback to bull contiunation
Nice risk to reward
Follow me for more breakdown like this
Thank you so much

AUD/NZD Buy setup 200 pipsAfter a massive Selloff, we now seeing finally finding support and we begin the rally to upside, we see a nice respect of 61.8% fib level and breaking the neckline of of double bottom and massive bullish momentum which give as a nice confirmation for a nice continuation to -21% level
wait for a nice retest of the broken neckline for entry to upside
Follow me for more setup

GBP/CHF massive Buy opportunity 100pipsBasically the market structure is still in upward trend, we see a nice pull back to 38.2% fib level and nice triple bottom, we already got a nice confirmation on H4 candlestick (engulfing candle ) that indicate a nice bullish momentum, which is in confluence the the triple bottom,
So we need price to break the neckline to continue to our target 1 of 100pips
we have a nice risk to reward
Follow me for more breakdown like this
Thank you so much

Let the FOMC front running begin.It's not Deja Vu that brings us back here.
It certainly feels like Ground Hog day in the markets every time Jerome Powell speaks.
All the Trend Lines and Moving Averages Converge for the next FOMC meeting.
Bond Bears are calling this latest move in markets as a mistake to price in 2 rate cuts in 2023.
The game has changed in the past year.
In fact, It's no longer a game but a single flat line at 4k
Hedged Equity Funds are positioned with supportive flows.
And S&P Dealer Directional Gamma Exposure remains supportive and consistently positive.
A Pull back overnight in Futures indicates to me that FOMC will be done at around ~3960 ES. At or around the 20D converges with 50D and 200D.
9D VIX has been telling a different story than stocks and this pullback was expected days ago.
9D VIX is up 50% in the last 7 days from a Low of 14.82 up to 21.84
30D Vix is down 10% in the last 7 days from a High of 21.21 down to 19.19
Naive SPX (total open interest) gamma is 3990 and should be considered a volatility trigger below.
Volatility is expected below 4000 and I'll update if S&P dealer directional gamma exposure goes negative this week.

SPX - expect short term pullback (bearish divergence)The markt has been more bullish than bearish lately. However it is getting overbought in the near term and a bearish divergence is now seen on the daily chart. Hence some pullback from here will not be too surprising. Bearing in mind divergence usually result in only a short term trend change lasting several candles. I am looking at possible near term SPX support at 3885 (recent pivot low).
While SPX managed to break above its 200 day moving average and even the longer term trendline resistence that had proven to be a tough one to crack in the past few months, there are still a lot of skepticism especially when "bad" news (eg mass layouts by big techs) still abound.
The fact remains that the bigger picture (say 2 monthly chart) remains in a sideway "diamond pattern" consolidation. Assuming the market is indeed on the recovery, It will be weeks (or even months) more before the 200 day moving average can flatten and turn up. Hence, SPX could continue to whip saw around the 200 day MA for a while.
There are more and more stocks that are forming/have formed basing patterns, ready (or have already begun) to reverse into an uptrend. The way to navigate this market is to trade those stocks showing high conviction technicals. The more we see such stocks, the more we will be convinced the market is probably turning the corner (albeit it will still be volatile for a while until it becomes too obvious). More importantly is also to have strict exit rules (ie stop losses) in place in case we are wrong. Keeping losses small and letting winners run is the way to go although it is definitely easier said than done.
Disclaimer: Just my 2 cents and not a trade advice. Kindly do your own due diligence and trade according to your own risk tolerance and don't forget that money management is important! Take care and Good Luck!

CHFJPY possible scenarios Okey guys, soo CHFJPY is at veery delicate level, tbh I don't have any idea what this pair will do from here, that's why I will wait for more price action and then i'll react to it.
So let me go in details about these setups:
Setup 1:
So 50EMA is on the same level on 1H and 4H, so if we see a breakout to the downside be sure to enter short on the next adequate pullback, maybe something like I've shown on the chart.
Setup 2:
So, this one is obvious for reasons, BUT if price reach this zone, enter only if candle rejection is shown, that means wicks to the upside especially, in other words be sure to see seller pressure at this level, because there is a big chance to see a continuation to the upside.
Setup 3:
IF price breaks the DTL, the last significant high and the daily 4HEMA, I'll be looking for any pullbacks for long for sure.
I know it is a bit confusing, but right now the price stays at very unclear level, so make sure to react if price manages to do something from above :)

GBPAUD short term longAlright, here is one cheeky setup that can possibly be played out.
So we have POI with:
1. 4H 50EMA
2. zone of S/R
3. 3rd touch of ATL
4. 61.8% fib level
All we need is 1H-4H rejection candles to be sure that this zone is respectable, so we can make entries from there ;)

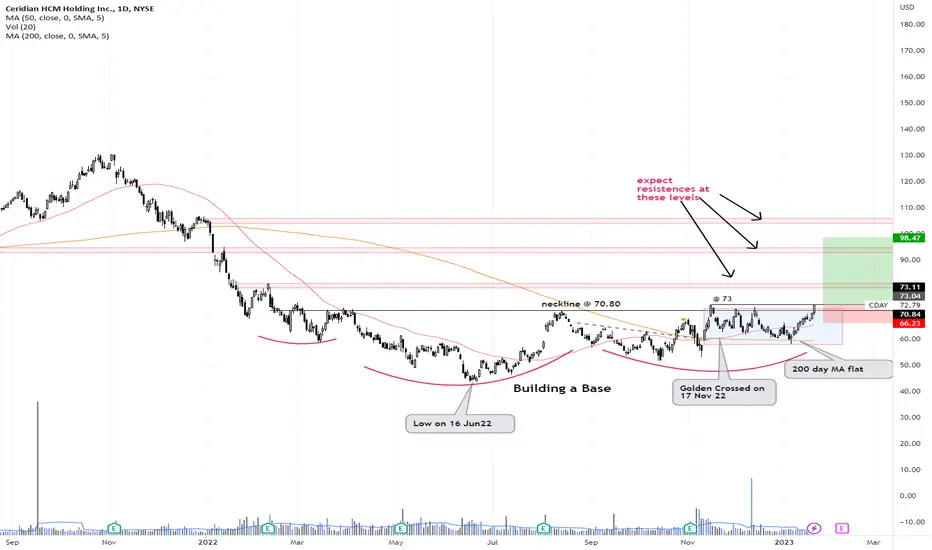
CDAY - on the verge of trending up?CDAY had been basing since hitting low on 16 June 2022 (7 months now). It formed a Golden Cross on 17Nov 2022 (2 months+ ago) but continued to trade flip flopped within a sideway range while it's 200 day moving average began to flatten out.
With it's 200 day MA having shifted from a downtrend to a flat line, the odds have increased for start of a sustainable up trend in the near future esp when it can start trading above it's last recent hi @ 73.
Let see!
Disclaimer: Just my 2 cents and not a trade advice. Kindly do your own due diligence and trade according to your own risk tolerance and don't forget that money management is important! Take care and Good Luck!
NVDA - approaching neckline (bull watch)NVDA was gyrating in a wild and wide base in the last 6 months. On 14 Dec it even went above the 200 day moving average but alas it proved to be shortlived as it began to retace 61.8% of the swing (AB) , forming what is now apparent a potential inverse Head & Shoulders pattern.
As of now NVDA is trading above it's 200 day moving average again (a postiive) and a golden cross could happen (although not yet) in the near future (2nd positive if and when it does happen). The odds of a successful breakup is higher than it was earlier.
An aggressive trader would buy the next breakup @ 184 (#1 in chart) with initial stop loss below 170 while a more conservative approach is to wait for the 1st pullback after the breakup and only enter the trade as it rebound and starts to surpass the first high above the neckline (#2).
The #2 or more conservative way of going long is to wait for the upside momentum to be firmer such that retracements are likely to be less steep by then.
Disclaimer: Just my 2 cents and not a trade advice. I may or may not enter into this trade. Kindly do your own due diligence and trade according to your own risk tolerance and don't forget that money management is important! Take care and Good Luck!

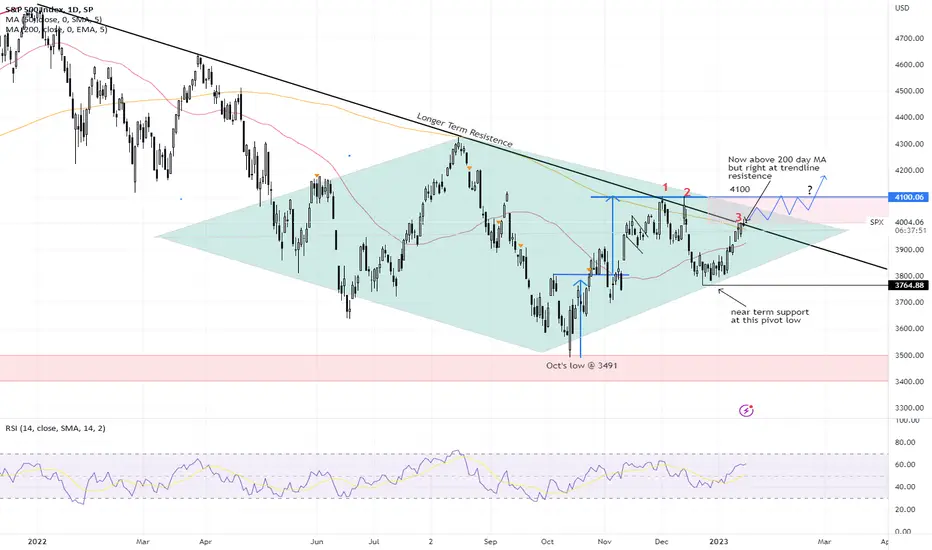
SPX - case for optimismOn Jan 3, I posted that SPX had been trading in a diamond pattern since late May, a potentially bottoming formation in a bearish market. It has been 2 weeks since and this pattern continues to play out.
2 days ago, SPX managed to close above its 200 day moving average and stopped right at the critical longer term trendline resistence again. This is the 3rd attempt testing the 200 day MA as well as the trendline resistence in the past 1.5 months.
The odds have increased that it will eventually test the 4100 level in the not too distant future, We may face some resistence at 4100 but the next pullback could be an opportunity to buy the dips, especially if pull backs do not bring it below the 200 day moving average again or formed a higher low.
Signs that a new bull could have returned (in the following order):
1. trading above both longer term trendline resistence (black) AND 200 day moving average
2. Golden cross, ie 50day MA crossing above 200day MA. May happen within the next couple of weeks? However, the market could continue to gyrate wildly for weeks more until the 200 day MA can flatten out
3. finally, trading above the 4100 level and by then the 200 day MA could be starting to slope upwards
Let's see.
Disclaimer: Just my 2 cents and not a trade advice. I may or may not enter into this trade. Kindly do your own due diligence and trade according to your own risk tolerance and don't forget that money management is important! Take care and Good Luck!
Bitcoin update 17-01-'23Bitcoin is still playing around at the liquidity zone... Patiently waiting for 1 of these scenarios...
This is consistent with DXY, which is still roaming the range...Expecting to see a clean BIAS today...

NATURALGAS: Buying Oversold Market
Time to buy very oversold Natural Gas.
Suggested Trade:
Swing Trade
Entry - 3.398
Stop loss - 3.11
Target - 3.91
Risk 1% of your trading account.
Good luck, traders!
Please, support this signal with like and comment!

ETSY- Flag formationETSY has been trading above it's 200 day MA since 10 Nov22 and a Golden Cross since 30 Nov22. The trend is still up despite the steep pullbacks that this stock is prone to. At the moment we are seeing yet another "flag" formation, the next buy will be triggered should it start to break above this flag (124-127 depending on when the breakup occur, if it happens).
So let's see!
Disclaimer: Just my 2 cents and not a trade advice. Kindly do your own due diligence and trade according to your own risk tolerance and don't forget that money management is important! Take care and Good Luck!

DIS - Long term support heldA look at the monthly chart revealed that DIS has establised a strong support between 79 - 84 since 2015. This zone has been tested several times (2015, 2016, 2020) and the last time being just recently in the last week of Dec2022.
A bullish divergence is seen on it's monthly chart, increasing the odds of a bounce lasting a couple of (monthly) candles. (bullish divergence usually predicts a short term reversal that may last 2-3 candles and does not necessarily predict a longer term trend change).
It's probably a good opportunity for long term investors to accumulate at current levels or at any near term dips (as long as it does not breach $79). Bear in mind that it could remain volatile as it has yet to clear above its 200 day moving average.
In the unlikely even of the stock breaking below the long term support of 79, then all bullish bets will be off.
Disclaimer: Just my 2 cents and not a trade advice. Kindly do your own due diligence and trade according to your own risk tolerance and don't forget that money management is important! Take care and Good Luck!

Moving average playPrice has fallen bellow the 200 EMA for more than 3 consecutive days, Price is struggling beneath the 200 EMA signaling potential trend reversal. price target Is based off of Fib levels.
