NIFTY DAILY 12/2/2024Indian shares settled lower in today’s session and formed bearish candle with upper and lower shadow.
Which indicates bears were aggressive and took Nifty to low of the day that is 21574.
Today's Candle is closed below 9 days Simple Moving Average line.
we may see bear run till 21515 with resistance of 21747 level.
⚠️ Important: Always maintain your Risk & Reward Ratio.
✅Like and follow to never miss a new idea!✅
Disclaimer: I am not SEBI Registered Advisor. My posts are purely for training and educational purposes.
Eat🍜 Sleep😴 TradingView📈 Repeat 🔁
Happy learning with trading. Cheers!🥂
Moving_average

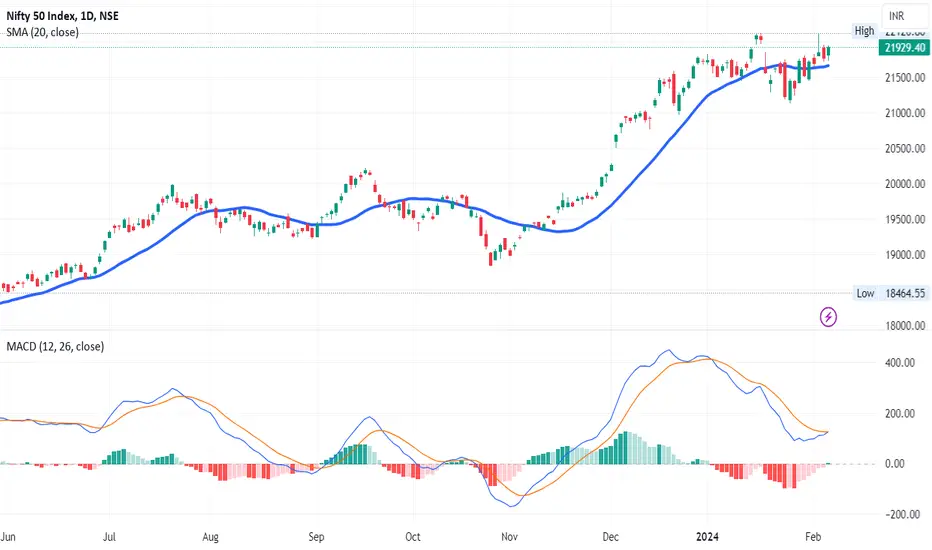
NIFTY DAILY - 6/02/2024Indian indices open with negative note and made days low that is 21737.55 but after wards bull’s takeover the market and made days high that is 21951.40.
Index has form green body candle with upper and lower shadow which indicates Buyers were buying from lower end because lower shadow is long as compare to upper shadow.
MACD has given Crossover which shows bullishness into market.
Candle is trading above on 20 days SMA line. we may see bullish run till 22124 with support of 21893 level.
SOL.X in upward trendSOL.X in upward trend: 10-day moving average broke above 50-day moving average on February 03, 2024
The 10-day moving average for SOL.X crossed bullishly above the 50-day moving average on February 03, 2024. This indicates that the trend has shifted higher and could be considered a buy signal. In 11 of 14 past instances when the 10-day crossed above the 50-day, the stock continued to move higher over the following month. The odds of a continued upward trend are 79%.
Technical Analysis (Indicators)
Bullish Trend Analysis
The Momentum Indicator moved above the 0 level on January 28, 2024. You may want to consider a long position or call options on SOL.X as a result. In 71 of 108 past instances where the momentum indicator moved above 0, the stock continued to climb. The odds of a continued upward trend are 66%.
The Moving Average Convergence Divergence (MACD) for SOL.X just turned positive on January 29, 2024. Looking at past instances where SOL.X's MACD turned positive, the stock continued to rise in 35 of 53 cases over the following month. The odds of a continued upward trend are 66%.
Following a +3.52% 3-day Advance, the price is estimated to grow further. Considering data from situations where SOL.X advanced for three days, in 243 of 335 cases, the price rose further within the following month. The odds of a continued upward trend are 73%.
SOL.X may jump back above the lower band and head toward the middle band. Traders may consider buying the stock or exploring call options.
BINANCE:SOLUSDT
New Robot factory from Tickeron Trading Results for last 12 months
SOL.X
AI Robots (Signals Only)
AI Robot's Name P/L
Swing Trader: Crypto Pattern Trading at Trend Reversal Points (TA) 14.01%
Day Trader: Crypto Pattern Trading in Low-Volatility Markets (TA) 5.39%
Day Trader: Crypto Pattern Trading in High-Volatility Markets (TA) 4.15%
Market Cap
The average market capitalization across the group is 41.64B. The market cap for tickers in the group ranges from 41.64B to 41.64B. SOL.X holds the highest valuation in this group at 41.64B. The lowest valued company is SOL.X at 41.64B.
High and low price notable news
The average weekly price growth across all stocks in the group was -0%. For the same group, the average monthly price growth was -5%, and the average quarterly price growth was 294%. SOL.X experienced the highest price growth at -0%, while SOL.X experienced the biggest fall at -0%.
Volume
The average weekly volume growth across all stocks in the group was -46%. For the same stocks of the group, the average monthly volume growth was -57% and the average quarterly volume growth was 163%

EDUCATIONAL VIDEO ON MOVING AVERAGE AND EXPONENTIAL MOVINGKindly check this Educational video on Moving Average and Exponential Moving Average

Bitcoin Bull Flag forming, BTC to 40k?Bitcoin is possibly forming a continuation Bull Flag pattern. Target ~40200
Price is respecting nicely 12H 9EMA as we can see from the chart (same with Total marketcap).
If we break the 9EMA support I think we will go test the Daily 9EMA and Flags bottom level where probably some buyers would show up. (Picture below)
This price action is quite fascinating and the trend seems strong (haven't broken down yet).
Much people are hoping for a Break and Retest on the 32k breakout level, so they can buy their positions. Could be that we won't even get there.
Not financial advice.
My analysis on Crypto Total Marketcap , the most important level I'm following on crypto
-PalenTrade

Big pump for EOSThis is a unique situation. After 770 days, the price has reached above the average of the last 400 days. First, we will attack the $1.2 resistance. Then we reach the resistance of 3 and 4 dollars and that is the end of the upward movement

Bitcoin Temporary SWING but also Long Term LONGThis Long on Bitcoin is very much LONG TERM due to the fact that the halving and so many of our indicators and others are pointing towards it.
However, this Long in our opinion does have a temporary swing to it. We may be suspecting a temporary increase to ~48-50k in the upcoming 2 - 3 weeks BEFORE a Correction back to the 44.5-45k mark by February.
After this mark around early to mid February we are projecting parabolic movement on the trajectory of our BTC Halving Indicator of 198.4k by June 29th, 2025. If this is indeed to happen, the slope/trajectory the price will need to take to reach its predicted High by its predicted Date will be exponentially parabolic.
We understand that many other Halving's analysis is anticipating April to be the Halving. If this is indeed true; this doesn't forgo our Trajectory; if anything it simply may make it more Parabolic in Nature.
So stay tuned; the volume within the Crypto Market itself, along with BTC may become parabolic and exponential in the upcoming months. Now may still be a great time to enter if our prediction of 198.4k by June 29th, 2025 is correct.
Likewise by this slope of movement, if correct, we will see a new BTC ATH by Early May 2024.

AAVE/USDT Trading IdeaWe're discussing the development idea in the accumulation phase for the AAVE/USDT crypto pair.
In June 2022, there was a notable decline in the asset, hitting a local bottom of the existing bearish trend at $45.80. However, it confidently surged from this level, reaching $115.27, showing over a 150% increase . Later on, the asset chart displayed the formation of a descending triangle, accompanied by significant trading volumes.
Currently, we observe AAVE's price breaking out of the described triangle and starting to trade within an ascending channel , confined by values from $115.27. This might indicate a potential continuation of the accumulation phase with a possible price squeeze toward the local maximum. Hence, the present trends and price chart structure suggest interesting dynamics in the asset's movement.
Considering these trends, it's conceivable that the asset is preparing to surpass the local maximum of $115.27, paving the way for further upward movement. The initial target for this upward trend could be the strong resistance level at $200. If this level is successfully breached and bullish pressure is sustained, the subsequent potential target could be around $260.

Bitcoin technical analysis _ 2023-12-19Long position
After breaking the 43334 resistance
Entry: 436000
Stop Loss: 42890
Risk Free: 44312
Save profit 1:45100
Save profit 2: 45750
Save profit 3: 46440
Save profit 4: 47145
Profit limit: 48000
-----------------------------------------------------------------
Short position
After breaking the 4790 support
Entry: 40,500
Stop Loss: 41330
Risk Free: 39670
Profit limit: 38300

Dogecoin(DOGE): First Bounce After Nice Drop? We are back with Doge coin, which has a very nice rejection from the upper resistance zone as of now, leading the price towards a lower support of $0.09113.
With that being said, we see that the price has had a volumetric bullish movement, which can lead the price back to the upper resistance zone. We are looking closely for market price movement, and once we see the price back near the upper resistance, we will be shorting it again with a much bigger size!

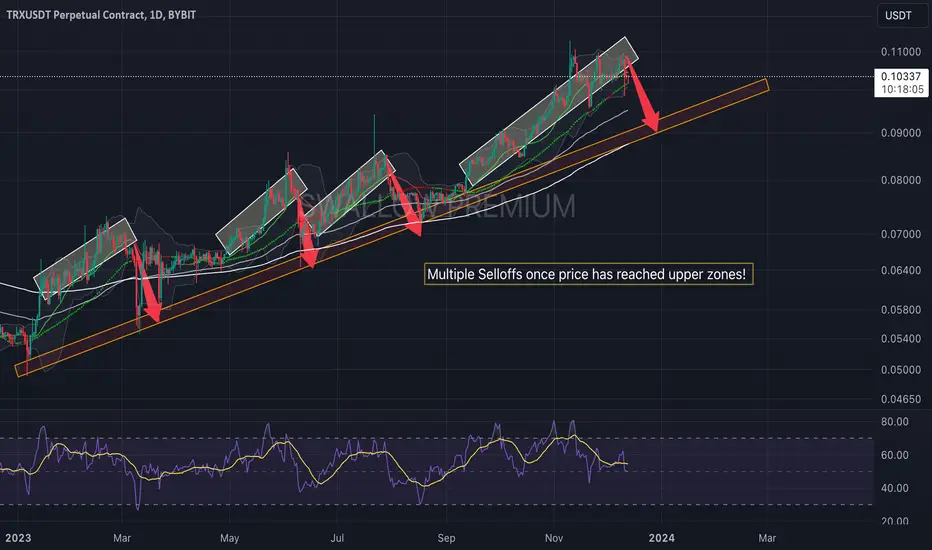
Tron(TRX): Similar Pattern = Drop IncomingTRX has caught our attention with a similar pattern to happen soon. First things first, the price of TRX has had an amazing bullish trend, moving and rebounding from it from time to time, but what is more interesting is how it is testing that zone.
A similar pattern might happen soon, so keep your eyes open for a potential downward movement towards that trend line!
#AUDCAD potential bullish continuationAs you can see in the 4-hour timeframe chart, there are several different bullish confluences that we are currently observing.
Firstly, the price is retesting a bullish trendline that has supported this recent bullish move since October 16th. Secondly, the price is also finding support from the 200EMA , and the price formed a nice rejection off this overlay indicator. Thirdly, we have bullish divergence between price and the stochastic oscillator, suggesting that momentum has shifted to the upside. Also, from a market structural point, the price is forming higher highs and higher lows and is currently testing the previous resistance, which has now turned into support.
After observing all these bullish confluences, the price then formed a bullish engulfing candle, suggesting that bulls are active in the market.
To participate in this market, there are two things that we can do. Either we can engage in this market by executing a buy order at the current price or place a buy limit order at 50% of the bullish engulfing candle, of which I prefer to use the second method.

Sell XAUUSD (H1)XAUUSD (H1) has reacted with a reduced SMA50
Sell at current price: 1981.33
Stop loss above the SMA50 resistance line (1984.79)
Profit taking near newly created bottom (1974.62)
Capital management 2%

December E-Mini Russell 2000 Index Futures Weekly Chart: 12/7/23Last week we saw the December E-mini Russell 2000 Index futures continues its bullish run with its third consecutive green candle closing into the Ichimoku cloud and above its 52-week moving average. With this move up, the MACD showed a bullish cross indication by crossing its signal line. RSI is trending up along with price. A continuation of this uptrend might find resistance at the top of the Ichimoku cloud (~1,906) and at the 200-week moving average (~1,930). A reversal to the downside might find support at the recent lows at the end of October (~1,640).
Please Note:
Commentary and charts reflect data at the original time of analysis (12/01/23). Market conditions are subject to change and may not reflect all market activity.

Trick to make your single MA strategy effectiveI’m going to show you a simple trick you can use to make your MA strategy effective.
For most traders, identifying the trend is hard. Using a moving average might be the best solution because of its objectiveness. (because we are using pure math when using MAs)
The common way to trade MAs is to buy if price is above the MA and to sell if price is below the MA.
This is a basic strategy.
Entries
Now, I’m going to show you the tweak you can add to make it effective. Use the 30 period SMA this time.
I HIGHLY recommend you use this strategy on high timeframes like 4H or Daily. Trading on a low timeframe chart might put the odds against you because of all the noise.
Also, if there's a big gap messing with your entry or exit, wait for the market to stabilize and give you clearer signals. Patience is key.
👉 For a buy:
Buy on the first close above the SMA whenever price crosses above it (unless this is steeply pointing downwards). This signal can also be used to add to your existing positions.
👉 For a sell:
Sell on the first close below the SMA whenever price crosses below it (unless this is steeply pointing upwards). This signal can also be used to add to your existing position.
Exits
There are 2 exits you can use: Stoploss and condition-based exit.
👉 Buy exit
1. For a condition-based exit, there should be 2 closes below the MA. Find the 2 latest significant relative lows. Find the one which is lower. Exit when any of those 2 closes is below that lower one.
What are relative lows?
Relative lows are lows which have their left & right bar higher than them. Example of relative lows:
Exit example:
In the picture above, we can see a buy at the left of the chart. Then, we see 2 closes below the MA and the 2nd bar which closed below the MA broke the lowest significant relative low.
2. For the SL based exit, it is below the lowest low of the two latest relative lows. Example:
👉 Sell exit
1. For a condition-based exit, there should be 2 closes above the MA. Find the 2 latest significant relative highs. Find the one which is higher. Exit when any of those 2 closes is above that higher one.
What are relative highs?
Relative highs are highs which have their left & right bar lower than them. Example of relative highs:
Exit example:
In the picture above, we can see a sell at the left of the chart. Then, we see 2 closes above the MA and the 2nd bar which closed above the MA broke the highest significant relative high.
2. For the SL based exit, it is below the highest high of the two latest relative highs. Example:
👉 SL Tip: trail the stop based on the next significant relative lows/highs as the trend progresses. This locks in profits and provides more room for the trend to unfold.
This strategy can be used on any type of MA with any period. The principles still remain the same.
Use an Exponential MA or a Weighted MA for intraday trading because these MAs are more sensitive to recent price action. They give more importance to the most recent prices.
This strategy works best in a trending market. This will fail in a sideway market.
So, to lessen the chances of that happening, always use this strategy with proper price analysis. Use the Elliot Wave Theory or Smart Money Concepts or anything else to understand the context of the market.
Then after you've understood the context of the market, you can perhaps use this strategy as an entry trigger.
Remember, no strategy is foolproof. I encourage you to backtest and experiment this thoroughly.
I hope you got value from this!

LRC Loopring - Quiet before the STORM ?Hi Traders, Investors and Speculators 📈📉
Ev here. Been trading crypto since 2017 and later got into stocks. I have 3 board exams on financial markets and studied economics from a top tier university for a year. Daytime job - Math Teacher. 👩🏫
Loopring / LRCUSDT has been trading under its 50 day moving average for a few weeks now (this is the weekly chart). This means that the chart is heavily oversold from the MA perspective and a correction is due.
This is bullish, because a correction back towards the 50d MA is expected , even if we get rejected there it will still be an easy, low risk high reward setup that could provide +140%. Keep an eye out on this altcoin and the price action along the moving averages !
Have a great weekend, the charts will be here on Monday 🥂
_______________________
📢Follow us here on TradingView for daily updates and trade ideas on crypto , stocks and commodities 💎Hit like & Follow 👍
We thank you for your support !
CryptoCheck

MOVR :Parabolic upside potential +1600%Hi Traders, Investors and Speculators of the Charts 📈📉
Ev here. Been trading crypto since 2017 and later got into stocks. I have 3 board exams on financial markets and studied economics from a top tier university for a year.
With the BTC Dominance drooping, I expect to see a rally in altcoins over the next few days until Bitcoin starts to increase again. One of the altcoins I'm keeping a close eye on is MOVRUSDT. It's fairly new, finished the nasty dump and now trading sideways in accumulation phase meaning next up - the parabolic run.
Taking a quick look at RSI, LSMA, EMA and Momentum in the Phoenix Ascending indicator as well as the moving averages, with the 200d MA giving us our first potential target of HKEX:13 for the near term.
_______________________
📢 Show us some LOVE 🧡 Follow for daily updates and trade ideas on Crypto , Stocks , Forex and Commodities 💎
We thank you for your support !
CryptoCheck

Bitcoin - BTC Logarithmic RoadmapHi Traders, Investors and Speculators of Charts📈📉
I love the logarithmic view of BTC. It gives a clearer indication of price increases alongside growth. Although inflation and value factors aren't physically calculated into the price, seeing the upwards curve makes more sense from a "holistic view" that would include things such as growth and inflation.
A logarithmic chart view displays price changes as a percentage of the previous price . This means that equal vertical distances on the chart represent equal percentage changes, regardless of the absolute price level.
This is in contrast to a regular chart view , which displays price changes on an arithmetic scale. This means that equal vertical distances on the chart represent equal absolute price changes.
With help of great technical indicators, we can use the logarithmic chart as a sort of "roadmap".
The logarithmic trendline indicator (log trend channel) shows possible support and resistance zones. The logarithmic moving averages show possible support zones, and help identify if the price is generally trading bearish (under) or bullish (over).
Logarithmic Moving averages / support zones :
Just for interest sake, I mapped out the date-ranges, as well as how far the price fell logarithmically after each top. You'll see the word "clicks" on the chart. This simply indicates the amount of diagonal trendlines it has fallen. By using this pattern-dedicated approach, a commonality is found which may be useful in speculating a future price. Because if not for past history, how else would we speculate on the future?
It's interesting to note that the past 3 ATH's (all time high's) are each lower than the previous if you compare it not to price but to the "click lines". Even the fourth high (the one coming next) will be on a lower click-line than the previous, and that estimate is already over 300k. This is a really helpful way to speculate a future high because usually on a regular-view chart, the zone above the ATH is uncharted territory. You could use a Fibonacci trend-based extension , but this is limited to the cycle that you're using for input points. Logarithmic chart + indicators factor in the entire history of the price.
What are your thoughts, do you think 300K is realistic by September 2025?
_______________________
📢Follow us here on TradingView for daily updates and trade ideas on crypto , stocks and commodities 💎Hit like & Follow 👍
We thank you for your support !
CryptoCheck
BITSTAMP:BTCUSD

#DXY more downside outlook
Hello, dear traders. I hope you're all having a great week.
Last week, we were looking to buy the DXY in two areas, which turned out to be very successful, and you can review those details in the attached chart.
However, on Friday, the price managed to break below our important daily low, shifting the market structure to the downside. Now, in the 4-hour timeframe, we are exploring potential areas for selling.
As the price has been moving higher in the last two days in a corrective manner, it's approaching the first resistance area, which previously acted as support. This area also coincides with the 38% Fibonacci level.
Nevertheless, we are more inclined to see the price rise further to test our second resistance area, as it offers a better Risk-to-Reward ratio and aligns perfectly with more bearish confluences.
It's important to note that while the 4-hour timeframe has shifted to a bearish market structure, with expectations of further downward movement, the daily timeframe still displays a bullish trend, and this 4-hour move is essentially a corrective move within the daily timeframe.
If you've found this analysis helpful, please take a moment to like, comment, or share your thoughts with me.

Gala Games possible 130% move?KUCOIN:GALAUSDT testing a key level of significance (marked by red arrows). Trying to get above the 2100 area. If we stay above it and get on top of the 200MAs on daily (picture added) the next big resitance level is 5 cents. Possible 130% move for the patient.
XRP trade just hit our first target after breakout, 22% move.
And DYDX to stop loss, if you are intested about a losing trade and how to take a loss

XRPUSDT 25% to 70% Bull move??Sunday analysis.
Seems like XRP is trying to break the first resistance which is the last previous highs (closer picture below). Price action looks like it would like to breakout and go 0.68 cents.
Good Risk/Reward here.
Ascending Triangles target is around 0.83 cents, 50% move.
Price has respected nicely the 9EMA support (picture below)
Check out my analysis about DYDX or GOLD which are still active DYDX GOLD
-PalenTrade

#GBPJPY buying opportunityHello, traders and friends. Let's analyze the GBPJPY 1-hour timeframe chart and explore a potential buying opportunity in this pair.
Yesterday, the price successfully broke above a Daily bearish channel that had been pushing the price lower since August 21st. This impulsive breakout to the upside suggests the potential for the price to move higher, possibly reaching at least the high established yesterday.
Another factor supporting our belief in a potential buying opportunity is the bearish corrective move that followed the breakout, indicating no strong overall bearish bias in the price for now.
There are several bullish confluences that reinforce our bias, including:
The bearish channel's upper line, now acting as support.
A demand area on the 1-hour timeframe, coinciding with a static support zone.
The price is currently above the 4-hour, 1-hour, and 30-minute 200EMA, all of which serve as critical support levels.
The price is currently at the 38% Fibonacci level, and if it reaches the support line, the 50% Fibonacci level will also provide significant support.
To consider a long position, we recommend waiting for the price to break the short-term bearish trendline to the upside or looking for candlestick confirmation around the supporting area.
by the way If you've found this analysis helpful, please take a moment to like, comment, or share your thoughts with me.

BTC/USDT - Short term SHORT with 2 Target ZonesThere is a potential for a short term SHORT trade on BTC/USDT. If todays bar closes < 34.7k (~3.5 hours till close) there is potential for a short. There are two target zones:
Yellow zone, this is the most likely zone it may dump to between 32.5 and 32.8k
White zone, between 30.3k and 31.8k, this may happen if the lower level of 32.5k in the Yellow zone fails to hold. Please note that the upper level of this zone at 31.8k may also act as a Support.
There are many reasons why this short may happen:
The price faced resistance at the trend line.
The price has closed above the upper purchase zone level since October 16th, and it MAY close below it today.
We are currently in a Blood Diamond which has been confirmed (white circle within the YinYang Momentum Oscillator).
YinYang RSI is at 98.08 and very Overbought and is closing in with the YinYang RSI MA which is now at 94.94.
The Buy Volume is bending towards the Sell Volume.
YinYang Momentum is very Overbought, the predictive mountain is already angling towards the regular and may dump inside of it soon. Likewise we can see the Confirming Blood Diamond appeared on the current bar (white circle).
YinYang Momentum Trend Line has turned Bearish.
The reason it may correct to these zones specifically:
Yellow Zone:
The Basis line is here.
There is a Downwards Trend Line within here.
The Fourth level of the Purchase Zone is there.
White Zone:
The high of 31.8k was a long lasting Resistance Pivot.
the low of 30.3k is where the Volume Profile is.
the low of 30.3k faced lots of resistance recently.
Please note this is a short term short, on the long term BTC may remain bullish.
Indicators used to make this analysis:
YinYang Trend
YinYang Volume
YinYang Momentum
YinYang RSI
