CARR – Bullish Breakout Toward Gap and ATHCarrier Global NYSE:CARR has closed above a key resistance zone near $76.50–$77.00 , indicating a possible breakout setup in progress. This move comes after a Golden Cross , where the 50 SMA crossed above the 200 SMA — a long-term bullish signal.
🔍 Technical Highlights:
✅ Golden Cross: Bullish momentum building.
✅ Breakout level: Price broke above horizontal resistance zone.
🔄 Next step: Wait for a potential retest of the breakout zone.
🔊 High volume on the breakout and retest would increase the strength and reliability of the setup.
🎯 Target Levels:
First Target (TP1): ~$80.00 — near the top of the existing gap.
Second Target (TP2): ~$83.32 — the current All-Time High (ATH).
🛡 Trade Plan:
Entry idea: After a clean retest of the breakout level with supportive volume.
Stop-loss: Below the retest zone or under 50 SMA (~$72-74 area).
Invalidation: If price falls back below resistance on high volume.
Conclusion:
CARR shows a strong breakout setup after a Golden Cross. A confirmed retest with volume could open the door toward the gap fill and new all-time highs.
DYOR – This is not financial advice.
Movingavarage

War is a Racket | DFEN | Long at $28.00The war machine keeps turning. Profits will reign. Direxion Aerospace and Defense 3x AMEX:DFEN never fully recovered from pandemic lows, but world peace is (unfortunately) far from reach. The uptrend in the chart has commenced. Personal entry point at $28.00.
Target #1 = $37.00
Target #2 = $50.00
Target #3 = $64.00

Bitcoin Probabilistic Analysis in the 4-Hour TimeframeIf Jerome Powell lowers interest rates today, we will likely see this trend.
Based on MAKER buy/sell signals and the High/Low of the EMA 200 indicator.

Inverse H&S Breakout! EURGBP Eyes Resistance Zone Amid Eurozone EURGBP ( OANDA:EURGBP ) is moving between two Support zone(0.83870 GBP-0.83500 GBP) and Resistance zone(0.8511 GBP-0.8470 GBP) .
In terms of Classic Technical Analysis , EURGBP has managed to break the Neckline of the Inverse Head and Shoulders Pattern .
I expect EURGBP to rise to at least 0.84911 GBP and attack the Resistance zone(0.8511 GBP- 0.8470 GBP) .
-----------------------------------------------------------
EURGBP Fundamental Analysis:
1. Eurozone (EUR) Overview :
The Eurozone economy has shown moderate recovery signs after pandemic disruptions.
Inflation remains a concern, but the European Central Bank (ECB) is expected to maintain or even tighten monetary policy gradually to combat inflation.
Economic data such as GDP growth and industrial production are mixed but generally indicate slow growth.
Political stability in the Eurozone is relatively steady compared to the UK.
The ECB’s forward guidance leans towards cautious optimism, supporting EUR strength over time.
2. United Kingdom (GBP) Overview :
The UK economy faces several challenges, including slower growth prospects compared to the Eurozone.
Inflation has been high but the Bank of England (BoE) has been raising interest rates aggressively to control it.
Political uncertainties related to Brexit aftermath, trade deals, and fiscal policies have created some volatility.
Consumer confidence and retail sales have shown signs of weakness in recent months.
Overall, the BoE’s hawkish stance is strong, but economic fundamentals are less robust compared to the Eurozone.
3. Comparative Factors Favoring EUR Long :
The Eurozone's relatively better economic stability and growth prospects support EUR strength.
UK economic challenges and political uncertainties weaken GBP.
ECB’s more gradual tightening approach may prevent shocks, making EUR attractive.
Brexit-related trade issues continue to pose risks for GBP.
4. Risks to Consider :
Unexpected ECB dovish moves could weaken EUR.
Positive UK economic surprises or faster-than-expected BoE tightening might strengthen GBP.
External shocks like geopolitical tensions can affect risk sentiment, impacting both currencies.
-----------------------------------------------------------
Note: Stop Loss(SL)= 0.84221 GBP
Euro/British Pound Analyze (EURGBP), 4-hour time frame.
Be sure to follow the updated ideas.
Do not forget to put a Stop loss for your positions (For every position you want to open).
Please follow your strategy; this is just my idea, and I will gladly see your ideas in this post.
Please do not forget the ✅' like '✅ button 🙏😊 & Share it with your friends; thanks, and Trade safe.

$ETH Pressing Resistance – A Break Above Could Fly!CRYPTOCAP:ETH Update
Ethereum is looking strong right now.
The price is pushing against a key resistance zone near $2,725 and forming higher lows showing pressure is building for a breakout.
If it breaks above this zone clearly, ETH could rally toward $4,000 (that’s a 55% upside).
Support to watch on the downside is around $2,465 if price pulls back.
Keep an eye on ETH, this breakout could be big.
DYOR, NFA
#ETH #Ethereum

Bitcoin MA 50 crosses 100If history repeats, this could be even bigger gains soon ahead. The blue MA 50 just crossed the orange MA 100 which happened in Oct '24 as well as Oct '23 -- this time happening so soon could defy historical pattern, but with a possible Fed interest rate cut in the works, this could be huge.
After the recent Fed announcement that there would be no interest rate cuts at this time, the reason given was that the market was holding steady, though a recession was not entirely ruled out. If a recession starts to rear its ugly head before June 17th Fed meeting, they may change their outlook and enact interest rate cuts to ensure the economy can continue unscathed. Since Trump has walked back tariffs on China and is still working with the rest of the world to lower tariffs, the interest rates may not be cut in June.
What does this mean for Bitcoin?
A recession is still on the horizon, even without rate cuts and with lowered tariffs. The damage has already been done by tariffs, enough so that reports of impending empty shelves soon to hit stores this month is still a concern. People flock to other investment strategies when the market is so uncertain, hence Gold and Bitcoin getting their boosts recently.
It's my opinion that Bitcoin will continue to grow in price as investors scramble to keep their portfolios on an uptrend. The MA 50 and MA 100 crossing is a great signal and gives me confidence in a continuing uptrend.

PEPE | BULLSH | ALT can +150%PEPE seems to have bottomed out after flashing bullish signs on the chart.
Once we close ABOVE the 50 day moving averages (green line) in the weekly timeframe, that's when we'll know the bullish action is full steam:
Make sure you don't miss the update on BTC here:
______________________
BINANCE:PEPEUSDT

Copper | $6 ProjectionLike mentioned in my last copper post price has been holding up very well and is heading to $6.
Similar ABC fractal pattern to what we saw in '08 is still valid for this current price structure as well.

41K is Coming?Will the 200-week simple moving average waiting around 41K meet us or will we continue to rise with a reaction from the fib levels? My personal opinion is that the bull never started. We just made a new high. Now it's time for a new low.

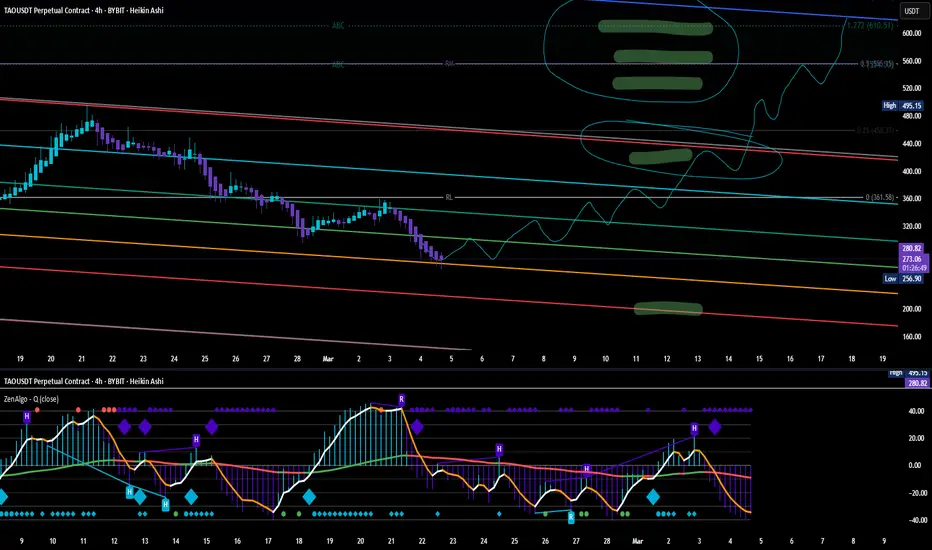
TAO/USDTBittensor ( BYBIT:TAOUSDT.P ) is a decentralized network that merges blockchain technology with AI, enabling a peer-to-peer marketplace for machine learning models. Launched in 2021, TAO has quickly gained traction for its innovative approach. The project operates with a capped supply, ensuring transparency and fair distribution of rewards. As of now, TAO trades at approximately $319, with a market capitalization of $4.09 billion and a circulating supply of 7.38 million tokens.
Bittensor (TAO) is currently trading within a downward channel. Before any potential upward movement, a retest of the $300 level is likely. Once the price reclaims the range, the next target stands at $420, where an unchecked VWAP awaits. The following key technical level is positioned at $520. In green higlited areas are untested VWAP.
On the bottom of chart you see super Q indicator.
Description
ZenAlgo - Q is an oscillator based on the QQE (Quantitative Qualitative Estimation) method. This version incorporates refinements for additional visualization and interpretation options. It is designed to help traders observe momentum changes and divergence patterns in price movements.
GBPNZD / looks good to buy Given the overall market direction, which remains extremely bullish across multiple timeframes, this trade has a high probability of continuing its upward trajectory.
Looking specifically at the 4-hour timeframe, price initially made a strong push to the downside, retested a key area of interest, yet ultimately closed above critical levels—including the monthly and weekly pivots, Fibonacci levels, and the 50-period moving average—forming a high-confluence zone.
With recent signs of exhaustion, price may once again retest the previous 4-hour resistance zone, as its identified on the chart.

SOL - Bullish or Bearish?SOL seems to be facing an unstable head-and-shoulders pattern, with the possibility of striking key support levels. The Moving Average Convergence Divergence (MACD) shows that SOL struggles to cross the zero line, indicating bearish sentiment. The Relative Strength Index (RSI) has been coming down from overbought conditions since December 3rd. The 20-day moving average (20ma) and the 200-day moving average (200ma) are converging, potentially undoing the golden cross formation observed on October 13th. This could signal a possible reversal. It's possible that we might see a shakeout followed by a bounce to the upside, or SOL may consolidate at key support levels before bouncing. Keep an eye on its movements.
Support - $215
Resistance - $246
Fear and Greed Index - 78 (Greed)

XRP will RunXRP is currently in a consolidation phase as it seeks to establish new highs and lows. The Relative Strength Index (RSI) indicates that XRP is undervalued, suggesting it is aiming to find new lows at higher price levels. The candlestick patterns are following an upward trend line, and both the 20-day and 200-day moving averages remain positive after experiencing a golden cross around November 10th. There are many positive signals that support a bullish outlook for XRP.
Fundamental analysis indicates that XRP has a promising future, with new leadership at the Securities and Exchange Commission (SEC) and fresh partnerships fostering the institutional adoption of blockchain technology. These initial price movements are just the start of increased exposure for XRP.

XAUUSD Forecast Dec 2024Hi all Traders!
In the XAUUSD H4 chart, it is observed that after breaking the support zone, the price is currently in a correction phase and pulling back towards low level fibonacci or continue to above.
Considering the price structure and hit fibo 50%, it is expected that after reaching the identified resistance area, the price will resume its downward movement and target lower levels or after rejection in fibo 61.8% will be uptrend and then continue to downtrend.
Key Points:
Forecast 1 :
Sell Entry 1 : Consider entering a Short Limit position around Fibs 50% with price of 2663.27, positioned close to the breakout level. This offers an entry point near the perceived shift in momentum.
Target Levels: 2560.75
Sell Entry 2 : Consider entering a Short Limit position around Fibs -0.382% with price of 2765.78, positioned close to the breakout level. This offers an entry point near the perceived shift in momentum.
Target Levels: 2516.35
Buy Entry : Consider entering a Long Limit position around Fibs 1.382% with price of 2560.75, positioned close to the breakout level. This offers an entry point near the perceived shift in momentum.
Target Levels: 2765.78
Forecast 2 :
Sell Entry 1 : Consider entering a Short Limit position around Fibs -0.382% with price of 2765.78, positioned close to the breakout level. This offers an entry point near the perceived shift in momentum.
Target Levels: 2516.35
Buy Entry : Consider entering a Long Limit position around Fibs 61.8% with price of 2649.55, positioned close to the breakout level. This offers an entry point near the perceived shift in momentum.
Target Levels: 2765.78
Forecast 3 :
Sell Entry : Consider entering a Short Limit position around Fibs 50% with price of 2663.27, positioned close to the breakout level. This offers an entry point near the perceived shift in momentum.
Target Levels: 2516.35
like and share your thoughts in the comments thank you

Easyjet ready to fly?Easyjet records better financial statements, looking at the report is possible to read that LSE:EZJ flew about 5% increase in seats when compared with last year.
The revenue increased by 14% this mainly because of the increase of 8% in capacity. Looking over the financial indicator it's noticeable an increase in revenue and the difference compared to 13 week moving average.
The price breakout for the second time above the top of ascending triangle following for a cross over the 200ema. The yellow resistance is the strongest one that still needs to be broken.
ADX is already above DMI- and being at 19,49 can show some strength confirming the DMI+.
EFI barely dropped below zero when the price failed to cross the EMA changing direction above zero rapidly.

Benchmarking a trend with a moving average (Example: Gold)They say a bad workman blames his tools.
Quite often, good work means using the right tools.
In a trend you need to use trend-following tools - and the most famous indicator is the moving average.
When it's a fast-moving trend, you need to use averages taken over shorter periods (e.g. 20 day SMA > 200 day SMA). Likewise a slower trend needs averages taken over longer periods (e.g. 20 week > 50 day).
Gold has just bounced off the 20 week moving average for the fourth time. The market is clearly benchmarking this trend according to this specific average.
So while the price is above this moving average the trend is intact - and when it eventually breaks below it will be an important signal that the strength of the trend has weakened - and could be about to reverse.
On the daily chart a rising trendline has broken but we would argue the reason the rebound off the low has been so strong is because the price rebounded off the 20 week moving average.
For now our bias is bullish but there are no good risk:reward opportunities to buy and it remains unclear whether the short term uptrend can continue after the trendline break

$BTC It is still bolish but needs to be correctedI'm still bullish on Bitcoin
But in order for the price to go up, you need to make corrections first
The target area for price reversal is specified on the chart
Also, I remind you that ema50 is on Fibonacci 61, which is an important zone

BTC Macro Outlook (Regression, SMA)Long-term price analysis using confluence of Log regression bands, SMA's, and Fibonacci retracements.
Possible case for a test of the 400w SMA, based on % distance to previous all-time highs.

Uptrend in Play or Drop Incoming? Key Price Zones!OANDA:GBPJPY
Current Price: 195.150
Chart Timeframe: 1-Hour
Bullish Outlook:
The price tested the Ascending Channel’s lower trendline as support and is now heading toward the 196.049 target.
Minor resistance at 195.714 may cause a pullback to 195.339 before the price resumes its move toward the 196.049 target.
Alternatively, if the price breaks below the channel’s lower trendline, it could lead to a decline towards 193.708.
Resistance Levels:
• 195.714 (Minor resistance)
• 196.049 (Primary target)
Support Levels:
• 195.339 (Expected pullback level)
• Lower trendline of the Ascending Channel (Current support)
• 193.708 (If the price breaks below the channel)
Happy Trading!

Head and Shoulders with price retestA drastic dip occurred with week buy action. FTM value has been reset to the low 0.60 zone. I expect a price bounce from the head and shoulder retract. I called a head and shoulder earlier this week on the XRP chart, and FTM has also followed that trend. 20MA and 200MA are still playing the break for all long positions. The moving average holds uptober excitement, but we will have to wait and see if it will hold strength and value next week.
Support - 0.56
Resistance - 0.65
Momentum - Low
Volume strength - Sell
Fear & Greed Index - Greed (73)
Fundamental analysis—With new price discoveries, it has been a rough week for all cryptocurrencies. I've noticed that the world crisis events will determine crypto price bounces. A lot of selling occurred with whale accumulation.

XRP LongXRP is finally having its rally. Saturday, 9/28, hit a milestone as it broke its previous high (resistance). It will most likely retest with a pullback balancing itself between 0.62 and 0.67 in the coming days. On the weekly chart, a golden cross formed on Monday, 9/15. 200 MA is playing the break. Resistance - $0.74 Support - $0.50

Will UKOIL continue its decline?The U.S. Energy Information Administration (EIA) announced that global oil demand will reach a higher level this year, while noting that the increase in production will be lower than previously forecasted. Additionally, the EIA reduced its price forecast for Brent crude oil in 2024 by 2.4%, from $84.44 per barrel to $82.80 per barrel. As a result, Brent crude oil prices fell to the $70.0 level.
Technically, if the 69.30 support level is broken, further declines toward 67.50 and 65.60 are possible. On the upside, if the 71.50 resistance is surpassed, buying momentum could accelerate toward the 73.0 and 74.30 resistance levels.

“The Nasdaq Index Extends Losses”In the U.S., the JOLTS job openings decreased by 237,000 in July compared to the previous month, dropping to 7.673 million. This marks the lowest level since January 2021. Following this data, expectations have increased that the Federal Reserve (Fed) could reduce the policy rate by a total of 125 basis points across its three remaining meetings this year. Additionally, the likelihood of a 50 basis point rate cut at the Fed’s September meeting has risen to 45%.
The release of U.S. macroeconomic data, which has triggered recession concerns, has led to increased selling pressure on the indices.
Technically, the Nasdaq index, which has retreated to the 18,780 level, could experience further selling pressure, potentially reaching the support levels of 18,450 and 17,900. In the event of a potential buying movement, if we see a close above the 18,900 level, the upward trend could extend to the resistance levels of 19,520 and 19,970.
