De la Rue Stock Quote | Chart & Forecast SummaryKey Indicators On Trade Set Up In General
1. Push Set Up
2. Range Set up
3. Break & Retest Set Up
Notes On Session
# De la Rue Stock Quote
- Double Formation
* (Diagonal) - *77.00 GBP - Uptrend Bias On Entry Support | Completed Survey
* (P1)) - *100.00 GBP - *Retest Area | Subdivision 1
- Triple Formation
* 50 EMA - *Upper & Lower Band | Subdivision 2
* (TP1) | Subdivision 3
* Daily Time Frame | Trend Settings Condition
- (Hypothesis On Entry Bias)) | Regular Settings
- Position On A 1.5RR
* Stop Loss At 123.00 GBP
* Entry At 128.00 GBP
* Take Profit At 137.00 GBP
* (Uptrend Argument)) & No Pattern Confirmation
* Ongoing Entry & (Neutral Area))
Active Sessions On Relevant Range & Elemented Probabilities;
European-Session(Upwards) - East Coast-Session(Downwards) - Asian-Session(Ranging)
Conclusion | Trade Plan Execution & Risk Management On Demand;
Overall Consensus | Buy
Moving Averages

BTC Breakdown Confirmed – Time to Buy the Dip or Bail Out? 📉 Bitcoin has officially broken out of its bullish channel.
We are no longer in an uptrend – the structure now signals a **downtrend or sideways consolidation**.
🟢 My Buy Entry Zones:
- First Buy: $104,306
- Second Buy: $98,111
- Third Buy: $93,672
- Last Buy: $89,061
🎯 Target Shorts are marked on the chart – short-term resistance zones.
🚨 Final Stop Loss (Buy Setup): $74,189
I’m dollar-cost averaging into these zones with strong risk management.
Do you think BTC will bounce before $90K?
👇 Drop your thoughts and like if you're buying the dip!

ANGEL ONE - Potential Cup Pattern Breakout!Timeframe: Daily (1D)
Pattern: Cup Formation (shown with arc)
Setup:
Price is forming a classic cup pattern.
The neckline (arc resistance) is near 2538.40.
Price has recently approached but faced resistance around the neckline.
Once the price breaks above the arc line with strong volume, a bullish breakout could be confirmed!
Targets After Breakout:
🎯 Target 1: 2800
🎯 Target 2: 3000
Stop-loss suggestion: As per your risk management.
Notes:
Price is currently below the 200 EMA. For a strong confirmation, look for a close above the arc and the 200 EMA with volume spike.
Disclaimer
This analysis is for educational and informational purposes only. It does not constitute financial advice or a recommendation to buy or sell any securities. Always do your own research and consult with a qualified financial advisor before making any investment decisions. Trading involves substantial risk.


REGN // The yellow line is our support point. It is best to stop at possible closings below the yellow line.

CAPT // The yellow line is our support point. Let's wait for the 22 exponential average to cut upwards to the 50 exponential average.

QNTM // The yellow line is our support point. Let's wait for the 22 exponential average to cut upwards to the 50 exponential average.

BIDU //The yellow line is our support point. Let's wait for the 22 exponential average to cut upwards to the 50 exponential average.

PATH // The yellow line is our support point. Let's wait for the 22 exponential average to cut upwards to the 50 exponential average.

BLNK // Let's wait for the exponential average of 22 to cut upwards from the 50 exponential average.

S // Our first support point is the green line. Our second support point is the yellow line. The upward movement accelerates when closings above the red line. You can accept the moving average we use.

DJT // Our support point of 11.95 is suitable for buying. The upward movement accelerates in closings above the green line. You can accept the moving average we use as trailing average. In closings below 11.95, stop is the best decision.

Nu Holdings, Rolling Stock Quote | Chart & Forecast SummaryKey Indicators On Trade Set Up In General
1. Push Set Up
2. Range Set up
3. Break & Retest Set Up
Notes On Session
# Nu Holdings, Rolling Stock Quote
- Double Formation
* (Diagonal) - *240.00 USD | Completed Survey
* (Box Thinking Bias)) - *Area Of Value | Subdivision 1
- Triple Formation
* (P1) & (P2) | Subdivision 2
* (TP1) | Subdivision 3
* Daily Time Frame | Trend Settings Condition
- (Hypothesis On Entry Bias)) | Indexed To 100
- Position On A 1.5RR
* Stop Loss At 83.00 USD
* Entry At 105.00 USD
* Take Profit At 140.00 USD
* (Uptrend Argument)) & No Pattern Confirmation
* Ongoing Entry & (Neutral Area))
Active Sessions On Relevant Range & Elemented Probabilities;
European-Session(Upwards) - East Coast-Session(Downwards) - Asian-Session(Ranging)
Conclusion | Trade Plan Execution & Risk Management On Demand;
Overall Consensus | Buy

NATGATE - Attractive RISK REWARD RATIO ?NATGATE - CURRENT PRICE : RM1.57
On 08 MAY 2025, the stock made a small gap up and closed higher at RM1.58 - with high trading volume. From there the share price rises few days and touched intraday high at RM1.81 on 15 MAY 2025.
Then the stock retrace and now it bounced from the small gap zone. The small gap zone may acts as strong support level. At the same time, there is also EMA-50 support. STOCHASTIC OSCILLATOR shows an oversold situation (which indicates rebound may happens in near term) while RSI is still above 50 (BULLISH).
At current moment this trade gives an attractive RISK REWARD RATIO. My entry price will be RM1.55 - RM1.58.
For target price, there are two strong resistance.
1. EMA 200
2. The high of LONG BLACK CANDLESTICK (03 MARCH 2025 candle)
One of my trading technique is I would take profit one or two bids below the actual RESISTANCE LEVEL. As such, my 1st target for NATGATE will be RM1.73 (below EMA 200) and 2nd target is RM1.85 (below actual RESISTANCE RM1.87 - The high of 30 MARCH 2025 long black candlestick).
ENTRY PRICE : RM1.55 - RM1.58
TARGET PRICE : RM1.73 and RM1.85
SUPPORT : RM1.50
Notes : Please be aware also that the company is going to announce its QUARTER EARNINGS approximately end of month.

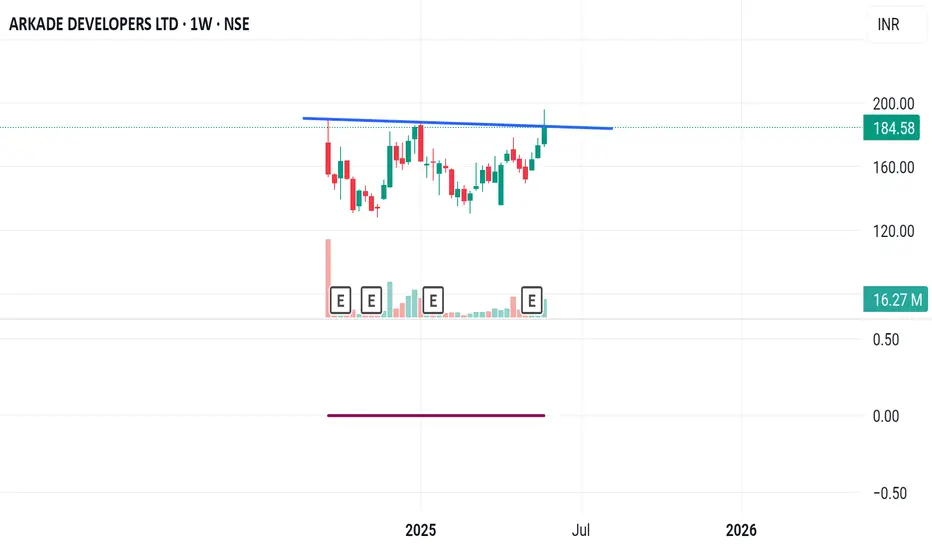
ARKADE DEVELOPERS LTDBreakout happend in this stock.
Keep your risk and reward ratios according to your own preferance.
This is for educational purpose, do your own research before investing.
Pullback time?As it seems, the pullback might be here. I'm looking at one interesting level, if the price doesn't drop to that level, it's super bullish. GAP and Ma 200 area 300-310 ish

Regeneron Pharmaceuticals | REGN | Long at $502.28Regeneron Pharmaceuticals NASDAQ:REGN stock dropped more than 17% today due to mixed Phase 3 trial results for itepekimab, a potential COPD drug. However, the company has an extensive drug pipeline, raked in over $14 billion last year, and is currently trading at a price-to-earnings of 15x. Debt-to-equity is 0.09x (extremely healthy) and earnings are forecast to grow 7.5% per year. While 2025 is anticipated to be its "worst" earnings year, the outlook through 2028 looks like steady growth in revenue and cash flow.
From a technical analysis view, the stocks entered my "crash" simple moving average zone today (currently between $466 and $502). More often than not, this area signals a bottom in the near-term, but it's not guaranteed. I wouldn't be surprised if the $450s-$460s get hit before a reversal if the market shifts negatively - which will be another entry for me. If it moves into my "major" crash zone in the $300s to close more gaps on the daily chart, I will be piling into this stock heavily (like I did with NYSE:UNH ) for a longer-term hold - of course, unless fundamentals change. I'm going to keep my target small unless there is a "major crash" and eye the closing of the nearest price gap on the daily. There is another between $883-$914...
Targets:
$590 (+17.5%)

Golden Cross vs. Death Cross: What Do They Really Tell Us?Hello, traders! 🤝🏻
It’s hard to scroll through a crypto newsfeed without spotting a headline screaming about a “Golden Cross” forming on Bitcoin or warning of an ominous “Death Cross” approaching. But what do these classic MA signals can really mean? Are they as prophetic as they sound, or is there more nuance to the story? Let’s break it down.
📈 The Basics: What Are Golden and Death Crosses?
At their core, both patterns are simple moving average crossovers. They occur when two moving averages — typically the 50-day and the 200-day — cross paths on a chart.
Golden Cross: When the 50-day MA crosses above the 200-day MA, signaling a potential shift from a bearish phase to a bullish trend. It's often seen as a sign of renewed strength and a long-term uptrend.
Death Cross: When the 50-day MA crosses below the 200-day MA, suggesting a possible transition from bullish to bearish, hinting at extended downside pressure.
📊 Why They Work (and When They Don't)
In theory, the idea is simple: The 50-day MA represents shorter-term sentiment, while the 200-day MA captures longer-term momentum. When short-term price action overtakes long-term averages, it’s seen as a bullish signal (golden cross). When it drops below, it’s bearish (death cross).
This highlights a key point: moving average crossover signals are inherently delayed. They’re based on historical data, so they can’t predict future price moves in real time.
🔹 October 2020: Golden Cross
On the weekly BTC/USDT chart, we can clearly see a Golden Cross forming in October 2020. The 50-week MA (short-term) crossed above the 200-week MA (long-term), marking the start of Bitcoin's explosive rally from around $11,000 to its then all-time high above $60,000 in 2021. This signal aligned with growing institutional interest and the post-halving narrative, reinforcing the bull case.
🔹 June 2021: Death Cross
Just months after Bitcoin’s peak, a Death Cross emerged around June 2021, near the $35,000 mark. However, this was more of a lagging signal: by the time it appeared, the sharp pullback from $60K+ had already taken place. Interestingly, the market stabilized not long after, with a recovery above $50K later that year, showing that Death Cross signals aren’t always the end of the story.
🔹 Mid-2022: Another Death Cross
In mid-2022, BTC formed another Death Cross during its prolonged bear market. This one aligned better with the broader trend, as price continued to slide towards $15,000, reflecting macro pressures like tightening monetary policies and the collapse of major players in the crypto space.
🔹 Early 2024: Golden Cross Comeback
The most recent Golden Cross appeared in early 2024, signaling renewed bullish momentum. This crossover preceded a significant rally, pushing Bitcoin above $100,000 by mid-2025, as seen in your chart. While macro factors (like ETF approvals or regulatory clarity) also played a role, this MA signal coincided with a notable shift in sentiment.
⚙️ Golden Cross ≠ Guaranteed Rally, Death Cross ≠ Doom
While these MA crossovers are clean and appealing, they’re not foolproof. Their lagging nature means they often confirm trends rather than predict them. For example, in June 2021, the Death Cross appeared after much of the selling pressure had already played out. Conversely, in October 2020 and early 2024, the Golden Crosses aligned with genuine upward shifts.
🔍 Why Care About These Signals?
Because they help us contextualize market sentiment. The golden cross and death cross reflect collective trader psychology — optimism and fear. But to truly understand them, we need to combine them with volume, market structure, and macro narratives.
So, are golden crosses and death crosses reliable signals, or just eye-catching headlines?
Your chart tells us both stories: sometimes they work, sometimes they mislead. What’s your take? Do you use these MA signals in your trading, or do you prefer other methods? Let’s discuss below!

Oil Bears May Look to PounceCrude oil futures have teetered for weeks, and the bears may be getting ready to pounce.
The first pattern on today’s chart is the sharp drop in early April after President Trump announced higher-than-expected tariffs. CL1! quickly broke the 65.27 level where it bounced in September and early March. Prices have stayed there since, which may reflect a lack of buying interest.
Second is the recent consolidation zone above the May 8 high of 60.29. Could a close below that level trigger selling?
Third, prices have remained consistently below their 50-day simple moving average since early February. That may suggest the intermediate-term trend is bearish.
Finally, the 8-day exponential moving average (EMA) recently crossed below the 21-day EMA. That may suggest the short-term trend is getting bearish.
These patterns could be important to watch heading into this weekend’s OPEC+ meeting.
Check out TradingView's The Leap competition sponsored by TradeStation.
TradeStation has, for decades, advanced the trading industry, providing access to stocks, options and futures. If you're born to trade, we could be for you. See our Overview for more.
Past performance, whether actual or indicated by historical tests of strategies, is no guarantee of future performance or success. There is a possibility that you may sustain a loss equal to or greater than your entire investment regardless of which asset class you trade (equities, options or futures); therefore, you should not invest or risk money that you cannot afford to lose. Online trading is not suitable for all investors. View the document titled Characteristics and Risks of Standardized Options at www.TradeStation.com . Before trading any asset class, customers must read the relevant risk disclosure statements on www.TradeStation.com . System access and trade placement and execution may be delayed or fail due to market volatility and volume, quote delays, system and software errors, Internet traffic, outages and other factors.
Securities and futures trading is offered to self-directed customers by TradeStation Securities, Inc., a broker-dealer registered with the Securities and Exchange Commission and a futures commission merchant licensed with the Commodity Futures Trading Commission). TradeStation Securities is a member of the Financial Industry Regulatory Authority, the National Futures Association, and a number of exchanges.
TradeStation Securities, Inc. and TradeStation Technologies, Inc. are each wholly owned subsidiaries of TradeStation Group, Inc., both operating, and providing products and services, under the TradeStation brand and trademark. When applying for, or purchasing, accounts, subscriptions, products and services, it is important that you know which company you will be dealing with. Visit www.TradeStation.com for further important information explaining what this means.

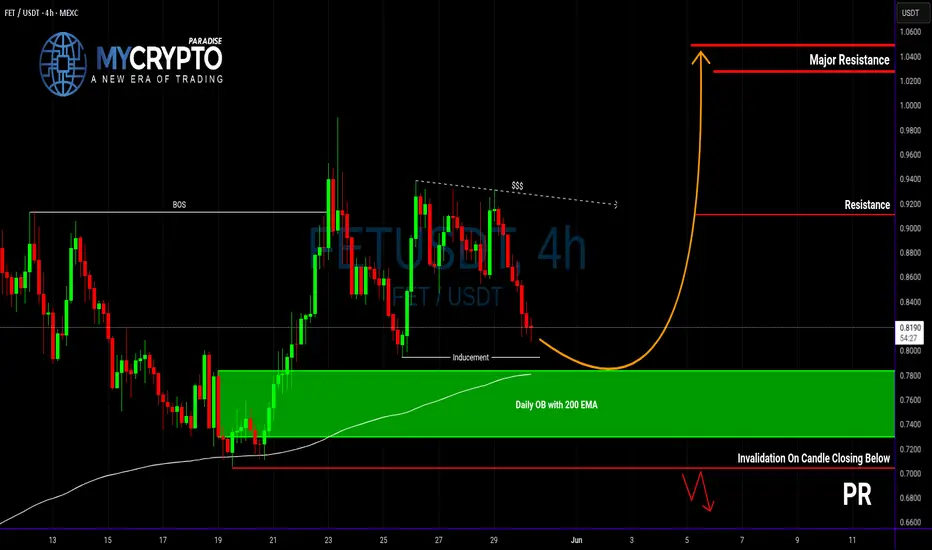
FET at a Make-or-Break Level... Will It Bounce or Break Down?Yello Paradisers, are you watching FET closely right now? If not, you might miss a textbook high-risk, high-reward setup that could play out very soon—just like we’ve been anticipating in our previous updates.
💎FETUSDT is currently respecting a bullish market structure, and price action is aligning for a potential inducement grab.
💎If this inducement occurs, and we start to see bullish confirmation signals from the Daily order block, backed by the 4H 200 EMA, then the probability of a strong bounce increases significantly. From a risk-reward perspective, this zone is shaping up to offer a solid long entry with clean invalidation.
💎But here’s the other side of the coin: if the price breaks down through the order block and closes a candle below our invalidation level, the bullish bias will be completely invalidated. In that case, patience becomes the strategy, and we’ll be waiting for more convincing and clearer price action to realign with a new setup.
🎖Strive for consistency, not quick profits. Treat the market as a businessman, not as a gambler.
MyCryptoParadise
iFeel the success🌴
NVIDIA 1D — When “Head & Shoulders” Aren’t Just for the GymOn the daily chart, NVDA has broken out of the descending channel and reclaimed the 50-day moving average (MA50), triggering a classic inverted head and shoulders formation. Price is now holding above the key $113–$114.50 zone, confirming a structural shift. As volume picks up, buyers are eyeing the next levels of resistance.
Near-term upside targets: – $119.80 (0.5 Fibonacci) – $127.62 (0.382) – $137.28 (0.236) — primary resistance zone – Extended target — $152.91 (1.0 Fibonacci projection)
Technical setup: — Breakout from channel + above MA50
— Inverted head and shoulders pattern completed
— $114.50–$118.00 now acts as buyer support
— EMA and MA convergence supports trend reversal
— Increasing volume on rallies supports bullish momentum
Fundamentals: NVIDIA remains the AI and semiconductor sector leader. Growing demand for high-performance GPUs in AI and data centers positions NVDA as a core tech play. Expectations of strong earnings and continued institutional accumulation support the bullish narrative.
The confirmed breakout and inverted H&S setup mark a clear structural reversal. As long as price stays above $114.50, the path toward $127–$137 remains the primary target zone, with $152.91 in sight if momentum continues.

$BTC Trend Broken - $102k NextThe trend has broken.
₿itcoin respects thy squigglets 🤓
$102k CRYPTOCAP:BTC here we come 🥸
If that doesn't hold, the 200DMA prophecy ~$95k will be fulfilled 🥲

#BTCUSDT #4h (Bitget Futures) Ascending trendline breakdownCRYPTOCAP:BTC lost 50MA that may act as resistance now, retracement down to 200MA support seems next.
⚡️⚡️ #BTC/USDT ⚡️⚡️
Exchanges: Bitget Futures
Signal Type: Regular (Short)
Leverage: Isolated (19.0X)
Amount: 5.0%
Current Price:
107480.5
Entry Zone:
108234.7 - 109274.5
Take-Profit Targets:
1) 106010.9
2) 103944.6
3) 101878.3
Stop Targets:
1) 111050.5
Published By: @Zblaba
CRYPTOCAP:BTC BITGET:BTCUSDT.P #4h #Bitcoin #PoW bitcoin.org
Risk/Reward= 1:1.2 | 1:2.1 | 1:3.0
Expected Profit= +47.9% | +84.0% | +120.1%
Possible Loss= -40.1%
Estimated Gaintime= 1-2 weeks
