US 100 – Further Moves Await NVIDIA Earnings UpdateGlobal stock indices have reacted positively at the start of this new trading week to President Trump’s decision to extend a deadline which would impose a tariff of 50% on EU goods imported into the US from June 1st to July 9th.
Taken alongside a new willingness being signalled from the EU side to speed the negotiating process along in key areas, means trader hopes have increased that a deal between the first and third largest of the world’s economies can be agreed in principle within the allotted time.
Focusing on US stock indices, the US 100 has risen 2.4% this week, taking it only a small step away from its recent highs at 21493 seen on May 20th. However, later today, the rally is about to face possibly its biggest challenge of the week in the form of earnings from the second biggest company on the planet ($3.3 trillion mkt cap) and AI bellwether NVIDIA, which are released after the market close.
Traders will not only be looking to judge company’s actual performance against expectations but will be eager to receive updates on the impact of President Trump’s tariffs on future revenue, chip deals with the Middle East, competition and its outlook for AI demand moving forward.
Answers to these questions and others may well impact sentiment towards technology stocks and the US 100 moving into the end of the week, and month, on Friday.
With increased volatility a possibility, knowing the technical outlook can also be helpful.
Technical Update: Focus on the May Highs at 21493
While last week did see correction themes develop within the US 100 index, there appears to be no clear-cut signs of a negative sentiment shift yet, as fresh buying developed above support provided by the rising Bollinger mid-average, currently at 20772 (see chart below).
However, looking forward, if the NVIDIA earnings prompt an increase in US 100 price volatility, what are the levels traders may be watching for clues to the next directional themes?
Potential Support Levels:
It is possible the rising Bollinger mid-average, currently at 20772, represents a first support for traders, and as such, closing breaks below this level might lead to a more extended phase of price weakness.
Such moves while not a guarantee of declines, could lead to a deeper sell-off towards 20001, which is equal to the 38.2% Fibonacci retracement of April 21st to May 20th 2025 price strength.
Potential Resistance Levels:
With this week seeing fresh price strength emerge from above the rising Bollinger mid-average, a positive price pattern of higher highs and higher lows, may still be evident. This reflects buyers currently being willing to pay higher prices, each time a setback materialises.
However, to maintain this uptrend pattern in price, the focus could now be on resistance provided by the May high at 21493 (May 20th), with closing breaks above this level required to suggest further strength might then be on the cards, towards what could prove to be the next potential resistance level at 22226, which is the February 18th 2025 all-time high.
The material provided here has not been prepared in accordance with legal requirements designed to promote the independence of investment research and as such is considered to be a marketing communication. Whilst it is not subject to any prohibition on dealing ahead of the dissemination of investment research, we will not seek to take any advantage before providing it to our clients.
Pepperstone doesn’t represent that the material provided here is accurate, current or complete, and therefore shouldn’t be relied upon as such. The information, whether from a third party or not, isn’t to be considered as a recommendation; or an offer to buy or sell; or the solicitation of an offer to buy or sell any security, financial product or instrument; or to participate in any particular trading strategy. It does not take into account readers’ financial situation or investment objectives. We advise any readers of this content to seek their own advice. Without the approval of Pepperstone, reproduction or redistribution of this information isn’t permitted.
Moving Averages

NE //Let's look for closings above the green line. Targets are determined according to Fibonacci. Pay attention to the wedge resistance in the weekly time frame.

IBM: Sneaking Toward a Breakout?International Business Machines is the top-performing member of the Dow Jones Industrial Average this year, and some traders may think it will keep climbing.
The first pattern on today’s chart is the push above $269 last week. The IT company pulled back after hitting that record peak, but found support at its rising 21-day exponential moving average (EMA).
It also closed above its 8-day exponential moving average (EMA), which is additionally above the 21-day EMA. Those signals may be consistent with a short-term uptrend.
Next, IBM is above $261.64, the previous weekly closing high from early March. That may suggest a breakout is being attempted.
Third, MACD is rising.
Fourth, you have some longer-term patterns. The 50-, 100- and 200-day simple moving averages (SMAs) are in a potentially bullish sequence, with faster SMAs above the slower. IBM also held its January low in April, avoiding the deeper declines experienced by the broader market.
Those patterns may be consistent with long-term strength.
Check out TradingView's The Leap competition sponsored by TradeStation.
TradeStation has, for decades, advanced the trading industry, providing access to stocks, options and futures. If you're born to trade, we could be for you. See our Overview for more.
Past performance, whether actual or indicated by historical tests of strategies, is no guarantee of future performance or success. There is a possibility that you may sustain a loss equal to or greater than your entire investment regardless of which asset class you trade (equities, options or futures); therefore, you should not invest or risk money that you cannot afford to lose. Online trading is not suitable for all investors. View the document titled Characteristics and Risks of Standardized Options at www.TradeStation.com . Before trading any asset class, customers must read the relevant risk disclosure statements on www.TradeStation.com . System access and trade placement and execution may be delayed or fail due to market volatility and volume, quote delays, system and software errors, Internet traffic, outages and other factors.
Securities and futures trading is offered to self-directed customers by TradeStation Securities, Inc., a broker-dealer registered with the Securities and Exchange Commission and a futures commission merchant licensed with the Commodity Futures Trading Commission). TradeStation Securities is a member of the Financial Industry Regulatory Authority, the National Futures Association, and a number of exchanges.
TradeStation Securities, Inc. and TradeStation Technologies, Inc. are each wholly owned subsidiaries of TradeStation Group, Inc., both operating, and providing products and services, under the TradeStation brand and trademark. When applying for, or purchasing, accounts, subscriptions, products and services, it is important that you know which company you will be dealing with. Visit www.TradeStation.com for further important information explaining what this means.

$QST Bullish flag QST QuStream shows strong bullish momentum on crypto market. It s based on Quantum Encryption narattive. Next month will be the testnet and will migrate to 1:1 own token on their network. Keep the eyes on it ...

PARA // Even though there are interruptions in the weekly time period, the prices are above the 03 03 2025 line 50 exponential average. Let's wait for the 22 exponential average to cut upwards from the 50 exponential average.

Breakout is next?Shaded red looks like a tough nut to crack (being in a confluence of resist zone for some major channels), but with the majority of price action over the last 5 years below (shaded blue), and weekly EMA30 as the wind on its back (red line), it may look possible now. AMEX:SILJ #silver

SelectQuote | SLQT | Long at $2.18SelectQuote NYSE:SLQT is currently resting within my historical simple moving average zone. This often signals consolidation and a future move (in this case, let's hope up). Looking at the company's financials, NYSE:SLQT is currently profitable. For Q3 2025 (ended March 31, 2025), the company reported a net income of $26.0 million, up from $8.6 million in Q3 2024. This follows a strong Q2 2025 with a net income of $53.2 million. While like most companies there are likely headwinds in 2025 (earnings are projected at a loss of -$0.20 per share due to seasonal fluctuations and investments in 2025 (e.g., new Kansas facility)), profitability is likely to stabilize in 2026, with EPS forecasts of $0.05, supported by improved Medicare reimbursement rates and operational efficiencies. Ongoing Department of Justice allegations could pose risks... but SelectQuote’s recent $350M investment and cost management suggest profitability may continue if legal issues are resolved favorably.
Thus, at $2.18, NYSE:SLQT is in a personal buy zone. There is a potential for the price to dip to the bottom of the historical simple moving average channel (near $1.25) in the near-term, but time will tell.
Targets:
$2.64
$4.24

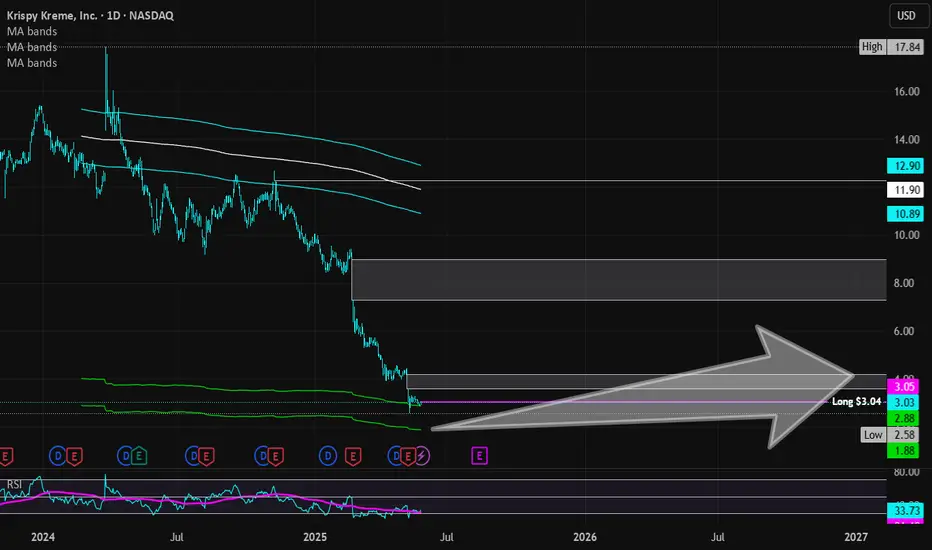
Krispy Kreme | DNUT | Long at $3.04Krispy Kreme NASDAQ:DNUT has entered and slightly exited my simple moving average "crash" indicator. More often than not, this zone (currently between $1.88 and $2.88) is a bottom indicator. However, this means there is a still a probability that stock could drop to a value less than $2 in the near future (and I wouldn't be surprised if it gets there). But predicting a "true" bottom is a fool's game. Building a position using data-driven decisions is the best strategy.
Fundamentally, NASDAQ:DNUT has many economic headwinds and a relatively high probably of bankruptcy in the next 24 months. It brought in $1.6 billion in revenue in 2024 and is a great target for takeover, but that requires a crystal ball. Earnings are anticipated to become positive by 2026, but growth is slow. The dividend yield, currently around 4.8%, may get cut in the near-term to help the company financially (again, crystal ball needed). Short interest is 30% with a float of 78 million... Debt to Equity = 0.90x. Essentially, if it can get through 2025, the company predicts it can turn things around into 2026 and beyond.
So, is this a good investment? Fundamentally, many better options are out there. From a technical analysis perspective, a potential opportunity. Thus, a gamble. I'm not betting the farm here, but at $3.04, NASDAQ:DNUT is in a buy zone - with a warning for potentially better entries to emerge in the near future in the $1-$2 range.
Targets:
$3.60
$4.20
Let's break down your Bitcoin (BTC/USD) 4-hour chart analysisBitcoin (BTC/USD) 4-hour chart analysis:
Chart Summary:
1. Descending Channel Formation:
Price is moving within a downward sloping channel (lower highs and lower lows).
Currently, price is testing the upper boundary of this channel near $109,800.
2. Liquidity Zone (Downside):
Clearly marked liquidity zone between ~$100,000–$102,000.
This suggests potential interest from large players in this area — stop hunts or accumulation possible.
3. Indicators:
RSI (Relative Strength Index): Around 56, which is neutral-bullish. Not overbought, so there's still room for upside, but no strong momentum.
MACD: Bullish crossover is forming; histogram showing momentum shift to the upside.
Key Insights:
Price Rejection or Breakout: Price is at a critical point at the upper trendline. If it breaks above with strong volume, it could indicate a bullish continuation.
Bearish Case (High Probability for Now):
The descending channel is intact.
Price may get rejected and revisit lower bounds near $104,000 or even the liquidity zone near $100,000.
Bullish Case (Breakout Setup):
Break above the channel with a strong bullish candle and retest confirmation may trigger longs.
Target could be previous highs around $112,000–$114,000.
current price: 109580
Suggested Trade Plan:
1. Conservative Short Entry:
If price rejects the upper trendline (around $109,800–$110,000)
Stop-loss above $110,500
Target near $104,000 or $100,000

$SPY May 27, 2025AMEX:SPY May 27, 2025
15 Minutes.
Below 577 target is 571-572 levels.
Above 582 target is 586-587 levels being 200 averages.
Since value below 200 averages am biased towards lower levels.
582 is 200 in 5 minutes which needs to be taken out first for 586 587 level.

Chevron Corp Stock Quote | Chart & Forecast SummaryKey Indicators On Trade Set Up In General
1. Push Set Up
2. Range Set up
3. Break & Retest Set Up
Notes On Session
# Chevron Corp Stock Quote
- Double Formation
* (Entry Bias Hypothesis)) - *170.00 USD | Completed Survey
* Wave Feature - *ABC Entry| Subdivision 1
- Triple Formation
* (EMA Settings)) - *146.00 USD | Subdivision 2
* (TP1) | Subdivision 3
* Daily Time Frame | Trend Settings Condition
- (Hypothesis On Entry Bias)) | Regular Settings
- Position On A 1.5RR
* Stop Loss At 140.00 USD
* Entry At 136.00 USD
* Take Profit At 130.00 USD
* (Downtrend Argument)) & No Pattern Confirmation
* Ongoing Entry & (Neutral Area))
Active Sessions On Relevant Range & Elemented Probabilities;
European-Session(Upwards) - East Coast-Session(Downwards) - Asian-Session(Ranging)
Conclusion | Trade Plan Execution & Risk Management On Demand;
Overall Consensus | Sell

Potential Reversal and Breakout Retest.Entry Zone: We recommend initiating a BUY position in AIA Engineering Ltd. around the current levels, ideally between ₹3,280 - ₹3,320. This area represents a retest of the recent trendline breakout.
Target 1 (T1): ₹3,400
Target 2 (T2): ₹3,480
Target 3 (T3): ₹3,580 (If momentum sustains above T2)
Stop Loss (SL): ₹3,200 (Strictly on a closing basis)
Trendline Breakout & Retest: The stock recently broke out of a significant descending trendline, indicating a potential end to the corrective phase. The current price action appears to be a successful retest of this broken trendline, which often acts as new support, presenting a lower-risk entry point.
Volume Confirmation: The initial breakout was accompanied by higher volumes, and while the retest phase has lower volumes (typical), sustained buying interest on subsequent upward moves would confirm strength.
RSI Bounce from Support: The Relative Strength Index (RSI) is showing a bounce from the 40-50 zone, indicating that momentum is regaining strength and potentially moving towards the bullish territory.
Positive Structure: The overall chart structure suggests that the stock is attempting to reverse its short-term downtrend and potentially resume its broader upward trajectory.
Favorable Risk-Reward: The current setup offers a reasonable risk-to-reward ratio for a short-term trade, with potential for upside gains outweighing the defined risk.
Key Risk: A close below ₹3,200 would invalidate the bullish retest scenario and could lead to further downside, bringing the previous lows into play. Traders should adhere strictly to the stop-loss.

MRDIY - Low RISK ?MRDIY - CURRENT PRICE : RM1.62
MRDIY is BULLISH because :
1. Price is above EMA 50
2. Price is above ICHIMOKU CLOUD
3. RSI is above 50
4. The high is getting higher and the low also getting higher
ENTRY PRICE : RM1.60 - RM1.62
TARGET PRICE : RM1.72 , RM1.80 , RM1.90
SUPPORT : RM1.51 (The low of bullish HAMMER candle)

BTC/USDT Technical Analysis, 2025-05-23 15:30 UTC💹 BTC/USDT – Technical Analysis (5-min Chart | Binance Spot)
Date: May 23, 2025 | Time: 15:30 UTC
📈 Market Structure & Outlook:
Bitcoin is currently exhibiting a neutral-to-bullish intraday structure, with confirmation bias leaning toward accumulation amid short-term consolidation. The price action is positioned just above key intraday support, with a visible tightening range between major liquidity zones. MACD bullish crossover and candlestick strength indicate persistent buying interest, despite RSI flattening.
📊 Key Indicators:
MACD: Positive histogram (+98.62) confirms bullish crossover; momentum remains constructive.
RSI (14): Neutral at 62.0 — no overbought pressure, leaves room for upside.
ATR (14): Elevated at 368.77 — indicative of high-volatility regime; adjust risk accordingly.
OBV: Net-negative (-1,662) but recovering; suggests quiet accumulation underway.
EMA/SMA:
200-period SMA acting as dynamic support at 109,162.
Price above 50/100 EMA, showing intraday bullish posture.
Bollinger Bands:
Lower Band: 107,968.77 (support zone convergence).
Upper Band: 110,355.26 (immediate resistance ceiling).
🔑 Key Levels:
Support:
109,525–109,550 → EMA/Bollinger convergence zone.
109,162 → 200 SMA acting as institutional anchor.
Resistance:
110,000 → Psychological + stacked ask liquidity zone.
110,280–110,355 → Bollinger top + structural rejection zone (last seen at 14:25 UTC).
🔑 Candlestick Confluence:
Bullish Marubozu (14:30 UTC): Full-bodied candle indicating aggressive buying.
Piercing Line (14:25 UTC): Reversal cue reinforcing dip-buy narrative.
🎯 Trade Setup (Institutional Playbook):
Position Type: Intraday Tactical Long
Entry Zone: 109,525–109,600
Stop-Loss: 109,150 (below SMA-200 + volatility buffer)
Take-Profit: 110,280
Risk/Reward: ~1.8x
Execution Note: Watch for bid thinning below 109,550. Size down to accommodate ATR-adjusted slippage (1.5x).
📌 Summary:
Momentum favors bulls above 109,525; technical alignment supports continuation toward 110,280. However, volatility and macro headlines demand surgical execution and proactive risk control. Maintain discipline around liquidity pockets.

Back at 1st..BITSTAMP:ETHUSD Back to retest 2500 lower than expected. Now reactivating 1st Idea for 2nd attempt with newly fresh target 28xx-31xx. zbee!

ETH Staying Bullish – Break Above Could Target $3K+$ETH/USDT Update
ETH is moving strong, forming clear higher highs and higher lows. Right now, it’s ranging in an accumulation zone just below key resistance.
As long as it holds above the 50 EMA and recent low, the trend looks bullish. A breakout here could send it flying toward $3,000+.
Still healthy, still in play.
DYOR, NFA

SNX About to Explode or Collapse?Yello Paradisers, are you watching SNXUSDT closely? Because if not, you might be missing one of the cleanest opportunities for bulls in this current market cycle. The setup is forming right at a critical decision point — and how price reacts here could define the next major move.
💎SNXUSDT is currently showing a bullish internal CHoCH (Change of Character) while trading directly inside a strong support zone. This zone isn’t just standing alone — it’s backed by the powerful 200 EMA and a well-respected support trendline. This confluence of support significantly increases the probability of a bullish bounce from this level, making it a high-reward setup for those paying attention.
💎Zooming out to the higher timeframe, the structure becomes even more interesting. SNXUSDT appears to be forming a bull flag pattern — a bullish continuation signal that often precedes explosive upside moves. When such a formation aligns with key support zones, it suggests that the market is simply consolidating before the next leg up.
💎However, traders must proceed with caution. If price breaks down and closes below the current support zone, this would invalidate the entire bullish scenario. In such a case, it’s best to step aside and wait for better confirmation rather than rushing into a compromised setup. Emotional decisions are the fastest way to ruin sound trading strategies.
🎖Strive for consistency, not quick profits. Treat the market as a businessman, not as a gambler. Discipline, patience, and strategic entries will always outperform emotional trades. Stay focused, Paradisers — the opportunity will always favor those who are prepared.
MyCryptoParadise
iFeel the success🌴

AVAXUSDT 📊 BINANCE:AVAXUSDT Chart Analysis
AVAX price, after breaking the key resistance at 22.20, is showing a strong upward move 📈 toward the next resistance at the end of the second leg at 30.00 USD. The 22.00 level could act as a pullback and provide strong support 🔄. If it consolidates above 30.00, the uptrend may continue to 37.00 🚀.
Support and Resistance Levels:
Supports:
• 22.20 🛡️
• 20.00 🛡️
• 17.50 🛡️
Resistances :
• 30.00 🚧
• 37.00 🚧

Two MAs, One Ribbon: A Smarter Way to Trade TrendsSome indicators aim to simplify. Others aim to clarify. The RedK Magic Ribbon does both, offering a clean, color-coded visualization of trend strength and agreement between two custom moving averages. Built by RedKTrader , this tool is ideal for traders who want to stay aligned with the trend and avoid the noise.
Let’s break down how it works, how we use it at Xuantify, and how it can enhance your trend-following setups.
🔍 What Is the RedK Magic Ribbon?
This indicator combines two custom moving averages:
CoRa Wave – A fast, Compound Ratio Weighted Average
RSS_WMA (LazyLine) – A slow, Smooth Weighted MA
When both lines agree on direction, the ribbon fills with:
Green – Bullish trend
Red – Bearish trend
Gray – No-trade zone (disagreement or consolidation)
Key Features:
Visual trend confirmation
No-trade zones clearly marked
Customizable smoothing and length
Works on any timeframe
🧠 How We Use It at Xuantify
We use the Magic Ribbon as a trend filter and visual guide .
1. Trend Confirmation
We only trade in the direction of the ribbon fill. Gray zones = no trades.
2. Entry Timing
We enter near the RSS_WMA (LazyLine) for optimal risk-reward. It also acts as a dynamic stop-loss guide.
🎨 Visual Cues That Matter
Green Fill – Trend is up, both MAs agree
Red Fill – Trend is down, both MAs agree
Gray Fill – No-trade zone, MAs disagree
This makes it easy to:
Avoid choppy markets
Stay aligned with the dominant trend
Spot early trend shifts
⚙️ Settings That Matter
Adjust CoRa Wave length and smoothness
Tune RSS_WMA to track price with minimal lag
Customize colors, line widths, and visibility
🧩 Best Combinations with This Indicator
We pair the Magic Ribbon with:
Structure Tools – BOS/CHOCH for context
MACD 4C – For momentum confirmation
Volume Profile – To validate breakout strength
Fair Value Gaps (FVGs) – For sniper entries
⚠️ What to Watch Out For
This is a confirmation tool , not a signal generator. Use it with structure and price action. Always backtest and adjust settings to your asset and timeframe.
🚀 Final Thoughts
If you want a clean, intuitive way to stay on the right side of the trend, the RedK Magic Ribbon is a powerful visual ally. It helps you avoid indecision and focus on high-probability setups.
What really sets the Magic Ribbon apart is the precision of its fast line—the CoRa Wave. It reacts swiftly to price action and often aligns almost perfectly with pivot reversals. This responsiveness allows traders to spot potential turning points early, giving them a valuable edge in timing entries or exits. Its accuracy in identifying momentum shifts makes it not just a trend filter, but a powerful tool for anticipating market moves with confidence.
Try it, tweak it, and let the ribbon guide your trades.

$BTC to Retest .786 Fib Next ~$102k - BTFD!timberrrrr
the crypto gods shall giveth one last chance.
buy the fckn dip!!!

AAVE (Aave): 100EMA Holding Price Down | Another Sell Incoming?Aave is seeing a good decline in price after each touch of the 100EMA, which we recently had again. We are going to look here for a decent movement to lower zones, which should give us at least 15% of market price movement; this, of course, only as long as we stay below the EMAs.
Swallow Academy

ETH (ethereum) – Massive Flag Pattern After 100% RunCRYPTOCAP:ETH – Bullish Flag After Monster Run
Ethereum ( CRYPTOCAP:ETH ) has nearly doubled since April, and now it’s cooling off — but in the best way possible: a bullish flag consolidation.
🔹 After a nearly 100% move, ETH has been consolidating tightly for two weeks — textbook flag behavior.
🔹 The trend remains strong, and this type of structure often leads to another leg higher.
🔹 Volume has tapered off during the flag — exactly what you want to see before a breakout.
Setup Overview:
Pattern: Large bull flag
Support/Risk: Defined risk to the $2500 zone
Measured Move Target: Breakout could push to $3100–$3500 based on the prior leg
Why I like this setup:
Healthy consolidation after a parabolic run
Risk/reward is favorable with structure and measured target
Potential breakout fuel from the ETH ETF narrative + BTC dominance rotation

CME Gap Aligns with 4h 200 EMAThe CME Gap around 5710-5730 is beginning to align with the 4h 200 EMA.
4h RSI has been diverging bearish 3 times with each leg up within the channel above.
Also, a breakdown of that channel has measured moves down that align with both the 4h 50 and 200 EMA:
- 50 EMA an 0.5x measured move down
- 200 EMA a 2.5x measured move down
Pre-req on targeting the gap is a breakdown of the parallel channel shown above, and then loss of the 4h 50 EMA.
Good luck!
