#SUIUSDT #1D (Bitget Futures) Rising wedge near breakdownSui got drained from Cetus LP and is about to print a spinning top candle on daily.
A retracement down towards 100EMA / descending trendline support seems likely.
⚡️⚡️ #SUI/USDT ⚡️⚡️
Exchanges: Bitget Futures
Signal Type: Regular (Short)
Leverage: Isolated (4.0X)
Amount: 4.8%
Current Price:
3.9642
Entry Zone:
3.9947 - 4.2035
Take-Profit Targets:
1) 3.5901
1) 3.2068
1) 2.8235
Stop Targets:
1) 4.5250
Published By: @Zblaba
CRYPTOCAP:SUI BITGET:SUIUSDT.P #1D #SuiNetwork #L2 sui.io
Risk/Reward= 1:1.2 | 1:2.1 | 1:3.0
Expected Profit= +49.7% | +87.1% | +124.5%
Possible Loss= -41.6%
Estimated Gaintime= 1-2 months
Moving Averages


NEAR’s Pullback Zone Found — Is $4 Next?NEAR just pulled off a +50% rally from the 0.618 Fibonacci retracement at $2.224 — a strong show of force from the bulls. After that explosive move, price is now cooling off in a consolidation phase, preparing for the next leg higher.
🟢 Long Setup — Dip Before Lift?
The next high-probability long zone lies between:
$3.026 – $2.94
Possible but less likely of a deeper dip to $2.78 (0.5 Fib of the recent move)
Long entries can be laddered between $3.00 and $2.90 (even $2.80 if volatility kicks in).
Stop-Loss: Below the daily 21 EMA ($2.7344) and 21 SMA ($2.6739)
Target: $4.00
R:R: ~4:1 — clean and structured
This setup aligns with standard continuation behaviour after strong impulses — consolidation, retrace, and resume.
🔴 Short Setup (on Rejection at $4.00)
Entry: ~$4.00
Stop-Loss: Above $4.25
Target: Yearly open (~$3.65)
R:R: ~1.5:1 — not ideal, but valid on confirmation
🎯 Summary
NEAR is consolidating after a strong move — either ready to continue higher or retest deeper into Fib support
Long zone: $3.00–$2.90 (poss. $2.80)
Short zone: $4.00 (on rejection only)
Simple structure, clean risk, and nothing forced — exactly how it should be.
Sometimes, less is more. Let price show the next move. Stay ready. 📈
___________________________________
If you found this helpful, leave a like and comment below! Got requests for the next technical analysis? Let me know.

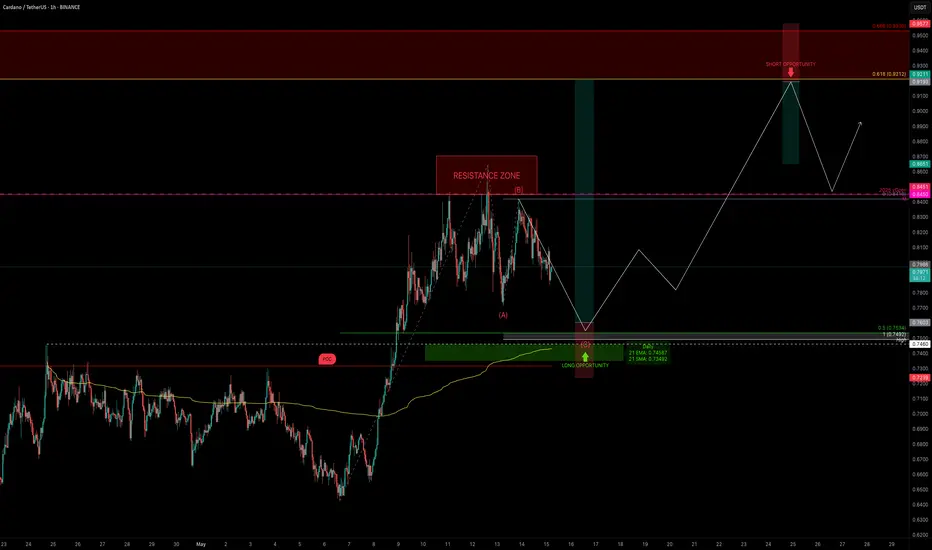
ADA Correction Nearing Completion — Trade It Like a ProADA is respecting structure beautifully and currently consolidating after completing a 5-wave impulse move. The key question now is: where are the next high-probability trade setups?
Let’s break it down step by step.
Market Structure & Elliott Context
ADA has completed a full 5-wave bullish sequence, and—as expected—is now in a correction phase. This appears to be forming a classic ABC correction.
Using the Fibonacci retracement tool:
0.5 retracement of the entire move sits at → $0.7534
This aligns perfectly with the previous swing high at $0.746 — a level that has yet to be retested
The 1:1 trend-based Fib extension of a potential ABC correction puts Wave C at → $0.7492
Confluence Check:
This entire support zone (~$0.75) is stacked with technical alignment:
✅ Previous swing high: $0.746
✅ 0.5 Fib retracement: $0.7534
✅ 1:1 extension: $0.7492
✅ Daily 21 EMA: $0.7455
✅ Daily 21 SMA: $0.7347
✅ Point of Control (POC): ~$0.7318
✅ Anchored VWAP: Also sitting in this zone
✅ Pitchfork golden pocket: Aligns as dynamic support
All of these support indicators point to one thing: this ~$0.75 zone is a high-probability long entry area.
🟢 Long Setup
Entry zone: Ladder between $0.77 – $0.75
Average entry: ~$0.76
Stop-loss: Below $0.7318 (under POC)
Target: $0.9212 (0.618 retracement of the recent down wave)
R:R: ~5:1
Potential upside: +22%
🔴 Short Setup (on Rejection Only)
Entry: $0.9212 (0.618 Fib retracement of downtrend)
Stop-loss: Above 0.666 Fib → ~$0.958
Target: previous swing high or yearly open
R:R: ~1.4:1 (it can be adjusted tighter upon confirmation)
This short setup isn’t ideal in terms of R:R unless we see clear rejection. But with confirmation — like an SFP, bearish engulfing, or divergence — the stop can be tightened, making the risk-to-reward much more favourable.
📘 Educational Insight: Why Structure Beats Emotion
In trading, the strongest setups occur where multiple tools converge—Fib levels, EMAs, VWAP, volume zones, and past price action. When these align, it’s not about guessing—it’s about preparing.
The key is to wait for structure to come to you, not the other way around. Patience allows clarity. Clarity allows precision. And precision pays.
💡 Final Thoughts
The plan is clear. Levels are set. Now it’s just observation and discipline.
Good trades don’t chase attention — they present themselves to those who wait.
___________________________________
If you found this helpful, leave a like and comment below! Got requests for the next technical analysis? Let me know.
XLM Short Trade (Second Attempt) - Initiated on May 15, 2025 On May 12, 2025, our initial Stellar Lumens (XLM) short position was closed after a stop-loss trigger two days into the trade. Despite bullish market sentiment, primarily driven by the anticipated year-end launch of the Valour Stellar ETP, which is expected to attract significant institutional interest
, we are confidently pursuing a contrarian, short-term bearish strategy by initiating a second short position on XLM. While Bitcoin’s rise to $104,018 as of May 16, 2025, reflects market strength CoinMarketCap - Bitcoin, we believe it is approaching cycle highs, potentially leading to a market pullback that could pressure altcoins like XLM. We anticipate a 28% price drop in XLM to $0.2128 from its current level of $0.2964, capturing liquidity at lower levels to fill orders. This decline is expected to set the stage for a subsequent upward move to absorb liquidity above and meet year-end demand at higher price levels, fueled by the Valour ETP launch and an anticipated bull run peak. Our bearish outlook is supported by an expected increase in USDT dominance (USDT.D), currently stable at 4.55% but poised for a potential rise, and a bearish technical signal from the four-day moving average crossing below the five-day moving average at 8:58 PM PDT on May 15, 2025, as observed on TradingView charts TradingView - XLMUSD.

$BTC.D + $USDT.D + $USDC.D = Flight to Safety Breaking DownFLIGHT TO SAFETY chart is breaking down.
Once the 20WMA breaks under the 50WMA the flood-gates are open.

Engineering the Hull‑style Exponential Moving Average (HEMA)▶️ Introduction
Hull’s Moving Average (HMA) is beloved because it offers near–zero‑lag turns while staying remarkably smooth. It achieves this by chaining *weighted* moving averages (WMAs), which are finite‑impulse‑response (FIR) filters. Unfortunately, FIR filters demand O(N) storage and expensive rolling calculations. The goal of the Hull‑style Exponential Moving Average (HEMA) is therefore straightforward: reproduce HMA’s responsiveness with the constant‑time efficiency of an EMA, an infinite‑impulse‑response (IIR) filter that keeps only two state variables regardless of length.
▶️ From FIR to IIR – What Changes?
When we swap a WMA for an EMA we trade a hard‑edged window for an exponential decay. This swap creates two immediate engineering challenges. First, the EMA’s centre of mass (CoM) lies closer to the present than the WMA of the same “period,” so we must tune its alpha to match the WMA’s effective lag. Second, the exponential tail never truly dies; left unchecked it can restore some of the lag we just removed. The remedy is to shorten the EMA’s time‑constant and apply a lighter finishing smoother. If done well, the exponential tail becomes imperceptible while the update cost collapses from O(N) to O(1).
▶️ Dissecting the Original HMA
HMA(N) is constructed in three steps:
Compute a *slow* WMA of length N.
Compute a *fast* WMA of length N/2, double it, then subtract the slow WMA. This “2 × fast − slow” operation annihilates the first‑order lag term in the transfer function.
Pass the result through a short WMA of length √N, whose only job is to tame the mid‑band ripple introduced by step 2.
Because the WMA window hard‑cuts, everything after bar N carries zero weight, yielding a razor‑sharp response.
▶️ Re‑building Each Block with EMAs
1. Slow leg .
We choose αₛ = 3 / (2N − 1) .
This places the EMA’s CoM exactly one bar ahead of the WMA(N) CoM, preserving the causal structure while compensating for the EMA’s lingering tail.
2. Fast leg .
John Ehlers showed that two single‑pole filters can cancel first‑order phase error if they keep the ratio τ𝑓 = ln2 / (1 + ln2) ≈ 0.409 τₛ .
We therefore compute α𝑓 = 1 − e^(−λₛ / 0.409) ,
where λₛ = −ln(1 − αₛ).
3. Zero‑lag blend .
Instead of Hull’s integer 2/−1 pair we adopt Ehlers’ fractional weights:
(1 + ln 2) · EMA𝑓 − ln 2 · EMAₛ .
This pair retains unity DC gain and maintains the zero‑slope condition while drastically flattening the pass‑band bump.
4. Finishing smoother .
The WMA(√N) in HMA adds roughly one and a half bars of consequential delay. Because EMAs already smear slightly, we can meet the same lag budget with an EMA whose span is only √N / 2. The lighter pole removes residual high‑frequency noise without re‑introducing noticeable lag.
▶️ Error Budget vs. Classical HMA
Quantitatively, HEMA tracks HMA to within 0.1–0.2 bars on the first visible turn for N between 10 and 50. Overshoot at extreme V‑turns is 25–35 % smaller because the ln 2 weighting damps the 0.2 fs gain peak. Root‑mean‑square ripple inside long swings falls by roughly 15–20 %. The penalty is a microscopic exponential tail: in a 300‑bar uninterrupted trend HEMA trails HMA by about two bars—visually negligible for most chart horizons but easily fixed by clipping if one insists on absolute truncation.
▶️ Practical Evaluation
Side‑by‑side plots confirm the math. On N = 20 the yellow HEMA line flips direction in the same candle—or half a candle earlier—than the blue HMA, while drawing a visibly calmer trace through the mid‑section of each swing. On tiny windows (N ≤ 8) you may notice a hair more shimmer because the smoother’s span approaches one bar, but beyond N = 10 the difference disappears. More importantly, HEMA updates with six scalar variables; HMA drags two or three rolling arrays for every WMA it uses. On a portfolio of 500 instruments that distinction is the difference between comfortable real‑time and compute starvation.
▶️ Conclusion
HEMA is not a casual “replace W with E” hack. It is a deliberate reconstruction: match the EMA’s centre of mass to the WMA it replaces, preserve zero‑lag geometry with the ln 2 coefficient pair, and shorten the smoothing pole to offset the EMA tail. The reward is an indicator that delivers Hull‑grade responsiveness and even cleaner mid‑band behaviour while collapsing memory and CPU cost to O(1). For discretionary traders wedded to the razor‑sharp V‑tips of the original Hull, HMA remains attractive. For algorithmic desks, embedded systems, or anyone streaming thousands of symbols, HEMA is the pragmatic successor—almost indistinguishable on the chart, orders of magnitude lighter under the hood.

LTC - bull flag LTC (litecoin) breakout of the bull flag and getting on top of sma200D. Target 129 for long position.

Advanced Auto Parts | AAP | Long at $64Advanced Auto Parts NYSE:AAP has gone through an exquisite shakeout of shareholders. Currently trading near $64, the stock is currently testing my "stock crash" simple moving average (seen green SMA lines). From a technical analysist standpoint, it's in a personal buy zone. This stock has tested this simple moving average level a few times in the past and recovered very well. Will history repeat?
Target #1 = $88.00
Target #2 = $110.00

AAPL SwingYou can get in when it hits the trend support line then get out when it's in that resistance zone.

BTC Building Strength – Breakout Ahead?$BTC/USDT Weekly Analysis
Bitcoin continues to respect the 50 EMA on the weekly timeframe — a key dynamic support level that has consistently held throughout this bullish structure.
Each time BTC corrected, it found support near the 50 EMA before bouncing back with strength. The current structure mirrors past price action, with price again rebounding from the EMA after a consolidation phase.
We’re also seeing a pattern of lower highs forming a potential descending resistance line. A breakout above this trendline could trigger a fresh rally, possibly taking BTC to new highs.
As long as Bitcoin stays above the 50 EMA, the mid-to-long-term bias remains bullish. A confirmed breakout above the descending resistance could open the door for a strong upside continuation.
DYOR, NFA
Thanks for following along — stay tuned for more updates!

Las Vegas Sands May Show Signs of PeakingLas Vegas Sands bounced sharply in recent weeks, but some traders may think its longer-term downtrend will resume.
The first pattern on today’s chart is the decline from mid-December through early April. The casino stock retraced half that move before stalling. It also seems to be hitting resistance at a weekly close from March 21.
Second, the 50-day simple moving average (SMA) is under the 100-day SMA. Both are declining. That may be consistent with a longer-term downtrend.
Third, the stock has fallen back below its 8-day exponential moving average. That may suggest its short-term trend is no longer bullish.
Finally, stochastics are dipping from an overbought condition.
Check out TradingView's The Leap competition sponsored by TradeStation.
TradeStation has, for decades, advanced the trading industry, providing access to stocks, options and futures. If you're born to trade, we could be for you. See our Overview for more.
Past performance, whether actual or indicated by historical tests of strategies, is no guarantee of future performance or success. There is a possibility that you may sustain a loss equal to or greater than your entire investment regardless of which asset class you trade (equities, options or futures); therefore, you should not invest or risk money that you cannot afford to lose. Online trading is not suitable for all investors. View the document titled Characteristics and Risks of Standardized Options at www.TradeStation.com . Before trading any asset class, customers must read the relevant risk disclosure statements on www.TradeStation.com . System access and trade placement and execution may be delayed or fail due to market volatility and volume, quote delays, system and software errors, Internet traffic, outages and other factors.
Securities and futures trading is offered to self-directed customers by TradeStation Securities, Inc., a broker-dealer registered with the Securities and Exchange Commission and a futures commission merchant licensed with the Commodity Futures Trading Commission). TradeStation Securities is a member of the Financial Industry Regulatory Authority, the National Futures Association, and a number of exchanges.
TradeStation Securities, Inc. and TradeStation Technologies, Inc. are each wholly owned subsidiaries of TradeStation Group, Inc., both operating, and providing products and services, under the TradeStation brand and trademark. When applying for, or purchasing, accounts, subscriptions, products and services, it is important that you know which company you will be dealing with. Visit www.TradeStation.com for further important information explaining what this means.

$SPY May 22, 2025AMEX:SPY May 22, 2025
15 Minutes.
Last week I expected the retracement towards 580 levels as numbers were far away from moving averages. But AMEX:SPY kept moving towards595 and suddenly broke yesterday towards 582 levels.
I expect it to settle down around 579 - 581 levels then a pull back is on cards as now we have the reverse on the cards with the 200 being away again.
On left side we have a big gap around 570 - 577 levels which I feel will be sorted out before a consolidation.
The weakness below 590 has keto 582 levels.
At the moment if 578 is broken i see support around 573 574 levels.

NG 5/22/25 - Re-engaging the Short side!Here is an update on NG (Natural Gas Futures) via analyzing Cumulative Delta Volume (CDV), divergence between price and the Money Flow Index (MFI), and the 4h and D McGinley Moving Averages!
Happy trading, and I hope the video was helpful!

AVAX 5/22/25 - Long trade working out. So far, so good.Here is an update on AVAX (Avalanche) via analyzing Cumulative Delta Volume (CDV), divergence between price and the Money Flow Index (MFI), and the 4h and D McGinley Moving Averages!
Happy trading, and I hope the video was helpful!

Empress Royalty – Undervalued Precious Metals Royalty🔹 Fundamental Outlook:
Empress Royalty offers exposure to gold and silver through a diversified portfolio of streaming and royalty agreements, with a focus on earlier-stage producers and developers. Backed by strategic partnerships with Endeavour Financial and Terra Capital, the company leverages deep deal flow and structuring expertise, while keeping overhead lean.
Cash flowing from several active royalties
EV/EBITDA (TTM): ~2.3 – indicating deep value
Free Cash Flow: ~$33M
Float: Only ~43M shares – tightly held
No major debt concerns (cash/debt ratio ~1.44)
The recent appointment of Mark Ashcroft as Business Development Advisor (North America) further boosts Empress’ ability to scale its portfolio with quality assets in the region.
✅ Undervalued vs peers on cash flow and earnings
✅ Royalty model limits operational risk
✅ Exposure to gold and silver (a rare mix)
✅ Insiders and partners with long-standing mining credentials
✅ Benefiting from a rising silver sentiment and the search for non-dilutive capital by small/mid-tier miners
🔹 Risks:
Operator dependency (as a royalty company)
Exposure to early-stage projects with potentially higher execution risk
Thin trading volume at times, which may increase volatility
📈 Conclusion:
Empress Royalty is a fundamentally solid, technically bullish small-cap royalty play. With silver sentiment turning and precious metals investors rotating into high-leverage names, EMPR offers both growth potential and asymmetric reward/risk.

#FETUSDT #4h (Bitget Futures) Falling wedge breakout and retestFetch just regained 100EMA support and looks good for bullish continuation from here.
⚡️⚡️ #FET/USDT ⚡️⚡️
Exchanges: Bitget Futures
Signal Type: Regular (Long)
Leverage: Isolated (4.0X)
Amount: 5.0%
Current Price:
0.7863
Entry Zone:
0.7806 - 0.7504
Take-Profit Targets:
1) 0.8561
1) 0.9244
1) 0.9926
Stop Targets:
1) 0.6897
Published By: @Zblaba
NYSE:FET BITGET:FETUSDT.P #4h #Fetch #AI fetch.ai
Risk/Reward= 1:1.2 | 1:2.1 | 1:3.0
Expected Profit= +47.3% | +83.0% | +118.7%
Possible Loss= -39.6%
Estimated Gaintime= 1-2 weeks

Color Your Trades: MACD 4C vs the Classic📊 Coloring Momentum: Comparing Standard MACD vs MACD 4C
Momentum indicators are a trader’s compass—but not all compasses are created equal. In this post, we compare the classic MACD with the visually enhanced MACD 4C , a four-color histogram tool that adds clarity and nuance to trend and momentum analysis.
Let’s break down how both tools work, how we use them at Xuantify, and how you can decide which one fits your strategy best.
🔍 What Are These Indicators?
Standard MACD (Moving Average Convergence Divergence) is a time-tested momentum indicator that plots the difference between two EMAs (typically 12 and 26) and a signal line (usually a 9 EMA of the MACD line). It’s simple, effective, and widely used.
MACD 4C , developed by vkno422 , builds on the classic MACD by introducing a four-color histogram and divergence detection , making it easier to interpret momentum shifts and trend strength visually.
Key Differences:
Standard MACD: Two lines + histogram (single color)
MACD 4C: Histogram only, but with four colors to show trend strength and direction
MACD 4C includes bullish/bearish divergence detection
🧠 How We Use Them at Xuantify
We use both indicators—but for different purposes.
1. Standard MACD – Clean Confirmation
We use it for classic trend confirmation and crossover signals . It’s great for traders who prefer minimalism and are comfortable interpreting line-based momentum.
2. MACD 4C – Visual Momentum Clarity
We use MACD 4C when we want a more intuitive, color-coded view of momentum. The four-color histogram helps us quickly spot trend strength, exhaustion, and divergence.
🧭 Color Coding in MACD 4C
MACD 4C uses four histogram colors (default settings):
Lime/Green : Bullish momentum building or continuing
Red/Maroon : Bearish momentum building or continuing
This makes it easier to:
Spot momentum shifts
Identify trend continuation
Detect divergence at a glance
⚙️ Settings That Matter
Both indicators allow customization, but MACD 4C offers more visual tuning:
MACD 4C:
Adjustable fast/slow MA and signal smoothing
Toggle divergence detection
Color-coded histogram for quick reads
Standard MACD:
Clean, minimal, and widely supported
Best for traders who prefer traditional setups
🔗 Best Combinations with These Indicators
We combine MACD tools with:
Structure Tools – BOS/CHOCH for context
Liquidity Zones – To spot where momentum may reverse
Volume Profile – To confirm strength behind moves
Fair Value Gaps (FVGs) – For precision entries
⚠️ What to Watch Out For
Both indicators are lagging by nature—they rely on moving averages. MACD 4C’s divergence detection can help anticipate reversals, but it’s still best used as a confirmation tool , not a standalone signal.
🔁 Repainting Behavior
Both the standard MACD and MACD 4C are non-repainting . Once a histogram bar or crossover is printed, it remains fixed. This makes them reliable for real-time trading and backtesting .
⏳ Lagging or Leading?
These are lagging indicators , designed to confirm trends—not predict them. MACD 4C’s divergence feature adds a leading element , but it should always be used with structure and price action for confirmation.
🚀 Final Thoughts
If you’re a visual trader who wants more clarity from your momentum tools, MACD 4C is a powerful upgrade. If you prefer simplicity and tradition, the standard MACD still holds its ground.
Try both, test them in your strategy, and see which one sharpens your edge.

$ETH / $BTC Inverse Head and Shoulders Confirmed! NGL pretty much every chart i'm looking at rn looks crazy bullish 🐂
Inverse Head and Shoulder confirmed on ETH / BTC 🤯
The real test comes at the 200DMA as CRYPTOCAP:ETH has not traded above it in the past 307 days.

$BTC Historic Daily Close Above ATH - Pullback Warning*HISTORIC Daily Close for ₿itcoin marking a new ATH 🥇
Some hefty volume poured in as the Golden Cross nears.
If CRYPTOCAP:BTC breaks down from this impulsive trend we should see a pullback to the .786 Fib ~$102k to confirm this new ATH.
Bulls need the Weekly Close above $109k to prevent that.
Nonetheless, this confirms the start of the parabola I’ve mentioned over the past month in my analysis 💯
Next big target is the 1.618 Fib ~$130k 🤑
Congrats Hodlers 🥳

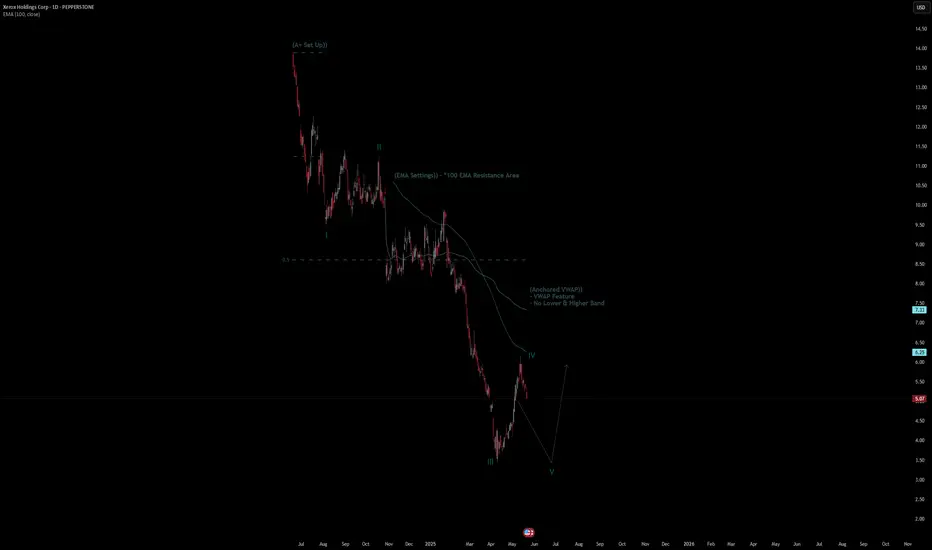
Xerox Holdings Corp Stock Quote | Chart & Forecast SummaryKey Indicators On Trade Set Up In General
1. Push Set Up
2. Range Set up
3. Break & Retest Set Up
Notes On Session
# Xerox Holdings Corp Stock Quote
- Double Formation
* (A+ Set Up)) At 14.00 USD | Completed Survey
* Wave Feature - *012345 / Entry & Retest | Subdivision 1
- Triple Formation
* (EMA Settings)) - *100 EMA Resistance Area | Subdivision 2
* (TP1) | Subdivision 3
* Daily Time Frame | Trend Settings Condition
- (Hypothesis On Entry Bias)) | Regular Settings
- Position On A 1.5RR
* Stop Loss At 6.00 USD
* Entry At 5.00 USD
* Take Profit At 3.00 USD
* (Downtrend Argument)) & No Pattern Confirmation
* Ongoing Entry & (Neutral Area))
Active Sessions On Relevant Range & Elemented Probabilities;
European-Session(Upwards) - East Coast-Session(Downwards) - Asian-Session(Ranging)
Conclusion | Trade Plan Execution & Risk Management On Demand;
Overall Consensus | Sell
BTC Hits New All-Time High: Is a $128K Blow-Off Top Next?Bitcoin's Meteoric Ascent: New All-Time Highs Fuel $128K "Blow-Off Top" Predictions Amidst Unprecedented Adoption
The digital gold rush of the 21st century is reaching a fever pitch. Bitcoin (BTC), the pioneering cryptocurrency, has not only shattered previous records but is now tantalizingly close to new, stratospheric all-time highs, with analysts eyeing a potential "blow-off top" as high as $128,000. This electrifying surge, which saw BTC climb to within 1.5% of new peaks as bullish sentiment decisively overcame final resistance, is underpinned by a confluence of factors: soaring institutional and retail adoption, particularly in the United States, booming ETF inflows, growing political and regulatory support, and a shifting macroeconomic landscape that increasingly favors non-traditional assets. As of May 21, 2025, Bitcoin has firmly established itself above the $109,000 mark, a testament to its resilience and burgeoning mainstream acceptance.
The recent price action has been nothing short of spectacular. Bitcoin bulls have been relentlessly "grilling sellers," pushing the price to historic milestones. On May 21, 2025, Bitcoin etched a new all-time high (ATH) above $109,000, a landmark achievement that notably placed 100% of BTC holders into profit. This surge saw Bitcoin's market capitalization briefly surpass that of e-commerce giant Amazon, a symbolic victory highlighting its growing financial clout. Specific figures around this period include a climb to a record $109,302, and another peak at a historic $109,500, demonstrating the intense buying pressure and bullish conviction in the market. Analysts are now recalibrating their upside targets, with many calling for $116,000 as the next significant milestone on the path to even loftier valuations.
This bullish momentum isn't occurring in a vacuum. It's the culmination of years of development, increasing understanding, and a series of pivotal events that have collectively propelled Bitcoin into the financial limelight.
The American Bitcoin Boom: Adoption Surpasses Gold, Institutions Dive In
One of the most compelling narratives driving Bitcoin's current rally is its explosive growth in the United States. A staggering 50 million Americans now own Bitcoin, a figure that notably surpasses the 37 million gold holders in the country. This demographic shift signifies a profound change in investment preferences, particularly among younger generations who are increasingly comfortable with digital assets. Bitcoin is no longer a niche interest for tech enthusiasts; it's becoming a recognized component of diversified investment portfolios across a broad swathe of the American population.
The institutional embrace within the US is equally, if not more, impactful. US firms now hold an astonishing 94.8% of the Bitcoin reserves held by publicly traded companies globally. This concentration underscores the confidence American corporations have in Bitcoin as a treasury reserve asset, a hedge against inflation, and a potential source of significant returns. Furthermore, the United States is solidifying its position as the global epicenter of the Bitcoin industry, with 40% of all Bitcoin companies headquartered domestically. This robust ecosystem of miners, exchanges, wallet providers, and ancillary service companies fosters innovation and provides a strong foundation for continued growth.
The advent and subsequent success of Bitcoin Exchange Traded Funds (ETFs) have been a game-changer. These regulated financial products have opened the floodgates for a new wave of capital, allowing retail and institutional investors to gain exposure to Bitcoin through traditional brokerage accounts without the complexities of direct ownership and custody. The "booming ETF inflows" are a direct contributor to the recent price surge, creating sustained buying pressure and signaling widespread market acceptance.
Macroeconomic Tailwinds and Regulatory Optimism
Beyond direct adoption, broader economic and political factors are playing a crucial role. The recent new all-time high of $109,000 was notably set just nine days after the US and China closed a 90-day trade agreement. This resolution eased economic uncertainty and market jitters that had previously weighed on global markets. In such an environment, assets perceived as hedges against traditional market volatility or fiat currency devaluation, like Bitcoin and gold, often thrive. Indeed, concurrent with Bitcoin's rise, concerns such as Japan's debt woes have contributed to gold surpassing the $3,300 mark, indicating a broader flight to alternative stores of value.
Furthermore, there's growing optimism around US regulations concerning cryptocurrencies. While the regulatory landscape is still evolving, recent pronouncements and actions suggest a move towards greater clarity and a more accommodative stance, rather than outright prohibition. This "growing political support" is crucial for long-term institutional commitment, as regulatory uncertainty has historically been a significant barrier to entry for larger, more conservative investors. The fact that Bitcoin climbed to a record of $109,302, breaching a previous high set around the time of a major political event like a presidential inauguration (specifically referenced as Trump's inauguration on Jan. 20 in a historical context for a previous ATH), often correlates with market sentiment interpreting political or regulatory shifts as favorable.
The "Bitcoin Strategic Reserve" (BSR): A Paradigm Shift for National Economies?
An intriguing, albeit more speculative, concept gaining traction is the idea of a "Bitcoin Strategic Reserve" (BSR). While not yet a formal policy in any major nation, the discussion itself highlights Bitcoin's evolving perception from a purely speculative asset to one with potential strategic geopolitical and economic importance.
A BSR would involve a nation-state, such as the United States, acquiring and holding Bitcoin as part of its national reserves, much like it currently holds gold or foreign currencies. The rationale behind such a move could be multifaceted:
1. Hedging Against Fiat Devaluation: As central banks globally continue to engage in monetary expansion, concerns about the long-term purchasing power of fiat currencies persist. Bitcoin, with its fixed supply, offers a potential hedge against this inflation.
2. Participating in a New Financial System: If Bitcoin continues its trajectory towards becoming a globally recognized store of value or even a medium of exchange for certain international transactions, holding it in reserve would position a nation to participate actively in this emerging financial infrastructure.
3. Technological Leadership: For a country like the US, which already leads in Bitcoin company headquarters and corporate holdings, establishing a BSR could further cement its leadership in the digital asset space, attracting talent and capital.
4. Economic Resilience: In a future where digital currencies play a more significant role, a BSR could offer a degree of economic resilience and autonomy, reducing reliance on traditional financial systems or the currencies of other nations.
The implications of a major economic power like the US even seriously considering, let alone implementing, a BSR would be monumental for Bitcoin's legitimacy and price. It would signal ultimate institutional acceptance and could trigger a wave of similar considerations by other nations, creating immense demand for a limited supply of BTC. While the "Bitcoin Strategic Reserve Explained and What BSR Means for the US Economy" remains a topic of forward-looking discussion, its emergence in financial discourse is a testament to how far Bitcoin has come.
The Path to $128K: Understanding the "Blow-Off Top"
With Bitcoin having decisively broken past $109,000 and upside targets of $116,000 now in common parlance, the ultimate bull-case scenario being discussed is a "blow-off top" potentially reaching $128,000 or even higher.
A "blow-off top" is a chart pattern that signifies a steep and rapid price increase in an asset, often on high volume, followed by an equally sharp reversal. It typically occurs at the end of a prolonged bull market or a parabolic advance. The psychology behind it involves:
1. Euphoria and FOMO (Fear Of Missing Out): As prices accelerate, media attention intensifies, and stories of quick riches abound. This draws in a flood of retail investors who don't want to miss out on the gains.
2. Exhaustion of Buyers: The parabolic rise eventually becomes unsustainable. The last wave of enthusiastic buyers enters at or near the peak.
3. Smart Money Distribution: Experienced traders and institutions, who may have accumulated positions much lower, begin to sell into this heightened demand, taking profits.
4. Sharp Reversal: Once buying pressure is exhausted and selling pressure mounts, the price can fall dramatically as latecomers panic-sell and stop-losses are triggered.
Predicting the exact peak of a blow-off top is notoriously difficult. However, analysts use a combination of technical analysis (chart patterns, momentum indicators, Fibonacci extensions), on-chain data (network activity, holder behavior), and market sentiment to identify potential price targets and warning signs. The $128,000 figure is likely derived from such analyses, representing a significant psychological level or a projection based on previous market cycle behavior.
Navigating the Bull Market: Indicators for Identifying a Cycle Top
While the current sentiment is overwhelmingly bullish, savvy Bitcoin traders and investors are always mindful of market cycles and the potential for corrections or trend reversals. The question, "Is Bitcoin price close to a cycle top?" is one that prudent market participants constantly evaluate. Several indicators can help traders gauge whether a market might be overheating:
1. Moving Average Convergence Divergence (MACD): This trend-following momentum indicator can show bearish divergences, where the price makes new highs, but the MACD fails to do so, signaling weakening momentum.
2. Relative Strength Index (RSI): An RSI reading above 70 is generally considered overbought, and readings above 80 or 90 in a strong bull market can signal extreme conditions, though Bitcoin can remain overbought for extended periods. Bearish divergences on the RSI are also key.
3. On-Chain Metrics (e.g., MVRV Z-Score, Puell Multiple, SOPR):
o MVRV Z-Score (Market Value to Realized Value): Compares Bitcoin's market cap to its realized cap (the price at which each coin last moved). High Z-scores indicate the market cap is significantly higher than the average cost basis, suggesting the asset is overvalued and potentially near a top.
o Puell Multiple: Looks at the supply side of Bitcoin's economy – miners and their revenue. It divides the daily issuance value of bitcoins (in USD) by the 365-day moving average of daily issuance value. High values suggest miner profitability is high compared to historical norms, which has sometimes coincided with market tops.
o Spent Output Profit Ratio (SOPR): This indicates if holders are, on average, selling in profit or loss. Values significantly above 1 suggest holders are realizing substantial profits, which can increase sell pressure. A sustained drop below 1 after a peak can signal a shift in trend.
4. Logarithmic Growth Curves: Bitcoin's long-term price action has often respected logarithmic growth channels. When the price reaches the upper band of these channels, it has historically indicated a market top.
5. Funding Rates and Open Interest in Derivatives Markets: Extremely high positive funding rates on perpetual swaps indicate that an overwhelming number of traders are long and paying a premium to maintain those positions. This can signal excessive bullishness and a crowded trade, making the market vulnerable to a long squeeze if prices reverse. High open interest can also exacerbate volatility.
While Bitcoin is currently refusing to give up on its quest to revisit $108,000 (a level now surpassed) and beyond, concerns over a trend change, though perhaps quieter amidst the euphoria, are always present in the minds of seasoned investors. These indicators provide a more objective lens through which to assess the sustainability of the current rally.
The Road Ahead: Uncharted Territory with Immense Potential
As Bitcoin forges new all-time highs, it enters uncharted territory. The confluence of unprecedented US adoption, robust institutional investment via ETFs, a more favorable regulatory outlook, and supportive macroeconomic conditions has created a potent cocktail for price appreciation. The surpassing of Amazon's market cap, even if temporary, and the fact that 100% of BTC holders are in profit, are powerful psychological milestones that can fuel further confidence.
The predictions of a $116,000 interim target and a potential $128,000 blow-off top are no longer fringe theories but are being seriously discussed by mainstream analysts. The narrative of Bitcoin as "digital gold" is gaining more traction than ever, especially as traditional safe havens like gold also see increased interest amidst global economic uncertainties like Japan's debt situation.
However, the path is unlikely to be linear. Bitcoin's inherent volatility means that sharp corrections can and will occur, even within a broader uptrend. The "concerns over a trend change" will likely grow louder as prices reach more extreme levels, and profit-taking becomes more tempting. Investors should remain vigilant, utilize the available indicators to assess market conditions, and practice sound risk management.
In conclusion, May 2025 has marked a historic period for Bitcoin. Its surge above $109,000, driven by a powerful combination of fundamental adoption and favorable market dynamics, has set the stage for potentially even more dramatic price action. Whether the ultimate peak of this cycle is $116,000, $128,000, or another figure entirely, one thing is clear: Bitcoin has firmly cemented its place in the global financial landscape, and its journey is far from over. The coming weeks and months will be closely watched by investors worldwide as the world's preeminent cryptocurrency continues to redefine the boundaries of financial assets.
________________________________________
Disclaimer: This article is for informational purposes only, based on the provided snippets, and should not be considered financial advice. Investing in Bitcoin and other cryptocurrencies is highly speculative and carries a significant risk of loss. Past performance is not indicative of future results. Always conduct your own thorough research and consult with a qualified financial advisor before making any investment decisions.

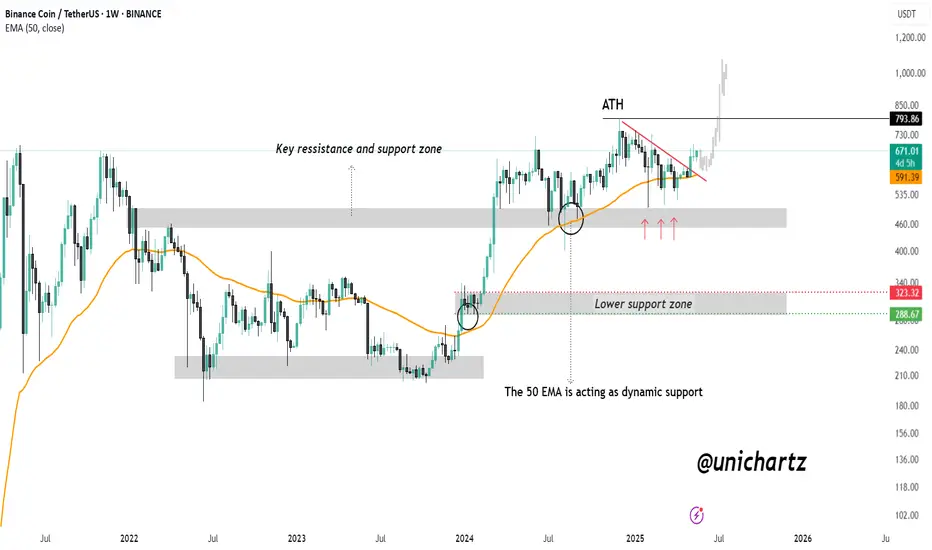
BNB Weekly Breakout: Road to $1,000?CRYPTOCAP:BNB is showing strong bullish momentum on the weekly chart. The 50 EMA is acting as a dynamic support, holding firm during multiple retests and providing a solid foundation for upward movement.
Recently, price action has broken above a key descending resistance line and successfully reclaimed a major support-resistance zone, turning it into a strong base. This area, which previously acted as a battleground for bulls and bears, is now supporting the current rally.
As long as BNB continues to hold above this zone and the 50 EMA, the structure remains bullish. With sustained momentum, a retest of the all-time high zone around $793 is likely, and a breakout above it could open the door for a move toward $1,000 and beyond.
DYOR, NFA