Bitcoin Ready to Explode – Just Like Last TimeCRYPTOCAP:BTC is currently showing a powerful accumulation and breakout pattern, repeating the same bullish structure that led to explosive rallies in the recent past.
The chart highlights three key zones where Bitcoin consolidated before breaking out:
🔹 First breakout from the $81K–$86K zone
🔹 Second breakout above $93K after holding above the 50 EMA
🔹Now, Bitcoin is accumulating again just below a key resistance zone (~$105K–$106K)
This resistance zone has acted as a ceiling before, but the current price action suggests strength. The tight consolidation just below resistance often precedes a breakout — and if it happens here, Bitcoin could explode toward $115K+ in the coming weeks.
Key Technical Points:
🔹50 EMA is acting as dynamic support
🔹Higher low structure remains intact
🔹Each consolidation is followed by a strong upward breakout
Repeating accumulation breakout pattern is visible
Next targets: $111K → $115K → $120K
Invalidation: Breakdown below GETTEX:98K with strong volume
If you found this helpful, don’t forget to like, comment, and repost.
Thank you!
#BTC #BTCUSDT #Unichartz
Moving Averages

Solana possible reject off the 21 smaThis is just an observance that I've made. The last time we rejected off this 21 sma, we dropped 93% to the bottom. I am by no means a bear, but I like to read what the charts are telling me. Bitcoin rejected in the same exact way last cycle but blew through it this cycle. Maybe this will change things. Let's just keep on eye on it.

Why Your EMA Isn't What You Think It IsMany new traders adopt the Exponential Moving Average (EMA) believing it's simply a "better Simple Moving Average (SMA)". This common misconception leads to fundamental misunderstandings about how EMA works and when to use it.
EMA and SMA differ at their core. SMA use a window of finite number of data points, giving equal weight to each data point in the calculation period. This makes SMA a Finite Impulse Response (FIR) filter in signal processing terms. Remember that FIR means that "all that we need is the 'period' number of data points" to calculate the filter value. Anything beyond the given period is not relevant to FIR filters – much like how a security camera with 14-day storage automatically overwrites older footage, making last month's activity completely invisible regardless of how important it might have been.
EMA, however, is an Infinite Impulse Response (IIR) filter. It uses ALL historical data, with each past price having a diminishing - but never zero - influence on the calculated value. This creates an EMA response that extends infinitely into the past—not just for the last N periods. IIR filters cannot be precise if we give them only a 'period' number of data to work on - they will be off-target significantly due to lack of context, like trying to understand Game of Thrones by watching only the final season and wondering why everyone's so upset about that dragon lady going full pyromaniac.
If we only consider a number of data points equal to the EMA's period, we are capturing no more than 86.5% of the total weight of the EMA calculation. Relying on he period window alone (the warm-up period) will provide only 1 - (1 / e^2) weights, which is approximately 1−0.1353 = 0.8647 = 86.5%. That's like claiming you've read a book when you've skipped the first few chapters – technically, you got most of it, but you probably miss some crucial early context.
▶️ What is period in EMA used for?
What does a period parameter really mean for EMA? When we select a 15-period EMA, we're not selecting a window of 15 data points as with an SMA. Instead, we are using that number to calculate a decay factor (α) that determines how quickly older data loses influence in EMA result. Every trader knows EMA calculation: α = 1 / (1+period) – or at least every trader claims to know this while secretly checking the formula when they need it.
Thinking in terms of "period" seriously restricts EMA. The α parameter can be - should be! - any value between 0.0 and 1.0, offering infinite tuning possibilities of the indicator. When we limit ourselves to whole-number periods that we use in FIR indicators, we can only access a small subset of possible IIR calculations – it's like having access to the entire RGB color spectrum with 16.7 million possible colors but stubbornly sticking to the 8 basic crayons in a child's first art set because the coloring book only mentioned those by name.
For example:
Period 10 → alpha = 0.1818
Period 11 → alpha = 0.1667
What about wanting an alpha of 0.17, which might yield superior returns in your strategy that uses EMA? No whole-number period can provide this! Direct α parameterization offers more precision, much like how an analog tuner lets you find the perfect radio frequency while digital presets force you to choose only from predetermined stations, potentially missing the clearest signal sitting right between channels.
Sidenote: the choice of α = 1 / (1+period) is just a convention from 1970s, probably started by J. Welles Wilder, who popularized the use of the 14-day EMA. It was designed to create an approximate equivalence between EMA and SMA over the same number of periods, even thought SMA needs a period window (as it is FIR filter) and EMA doesn't. In reality, the decay factor α in EMA should be allowed any valye between 0.0 and 1.0, not just some discrete values derived from an integer-based period! Algorithmic systems should find the best α decay for EMA directly, allowing the system to fine-tune at will and not through conversion of integer period to float α decay – though this might put a few traditionalist traders into early retirement. Well, to prevent that, most traditionalist implementations of EMA only use period and no alpha at all. Heaven forbid we disturb people who print their charts on paper, draw trendlines with rulers, and insist the market "feels different" since computers do algotrading!
▶️ Calculating EMAs Efficiently
The standard textbook formula for EMA is:
EMA = CurrentPrice × alpha + PreviousEMA × (1 - alpha)
But did you know that a more efficient version exists, once you apply a tiny bit of high school algebra:
EMA = alpha × (CurrentPrice - PreviousEMA) + PreviousEMA
The first one requires three operations: 2 multiplications + 1 addition. The second one also requires three ops: 1 multiplication + 1 addition + 1 subtraction.
That's pathetic, you say? Not worth implementing? In most computational models, multiplications cost much more than additions/subtractions – much like how ordering dessert costs more than asking for a water refill at restaurants.
Relative CPU cost of float operations :
Addition/Subtraction: ~1 cycle
Multiplication: ~5 cycles (depending on precision and architecture)
Now you see the difference? 2 * 5 + 1 = 11 against 5 + 1 + 1 = 7. That is ≈ 36.36% efficiency gain just by swapping formulas around! And making your high school math teacher proud enough to finally put your test on the refrigerator.
▶️ The Warmup Problem: how to start the EMA sequence right
How do we calculate the first EMA value when there's no previous EMA available? Let's see some possible options used throughout the history:
Start with zero : EMA(0) = 0. This creates stupidly large distortion until enough bars pass for the horrible effect to diminish – like starting a trading account with zero balance but backdating a year of missed trades, then watching your balance struggle to climb out of a phantom debt for months.
Start with first price : EMA(0) = first price. This is better than starting with zero, but still causes initial distortion that will be extra-bad if the first price is an outlier – like forming your entire opinion of a stock based solely on its IPO day price, then wondering why your model is tanking for weeks afterward.
Use SMA for warmup : This is the tradition from the pencil-and-paper era of technical analysis – when calculators were luxury items and "algorithmic trading" meant your broker had neat handwriting. We first calculate an SMA over the initial period, then kickstart the EMA with this average value. It's widely used due to tradition, not merit, creating a mathematical Frankenstein that uses an FIR filter (SMA) during the initial period before abruptly switching to an IIR filter (EMA). This methodology is so aesthetically offensive (abrupt kink on the transition from SMA to EMA) that charting platforms hide these early values entirely, pretending EMA simply doesn't exist until the warmup period passes – the technical analysis equivalent of sweeping dust under the rug.
Use WMA for warmup : This one was never popular because it is harder to calculate with a pencil - compared to using simple SMA for warmup. Weighted Moving Average provides a much better approximation of a starting value as its linear descending profile is much closer to the EMA's decay profile.
These methods all share one problem: they produce inaccurate initial values that traders often hide or discard, much like how hedge funds conveniently report awesome performance "since strategy inception" only after their disastrous first quarter has been surgically removed from the track record.
▶️ A Better Way to start EMA: Decaying compensation
Think of it this way: An ideal EMA uses an infinite history of prices, but we only have data starting from a specific point. This creates a problem - our EMA starts with an incorrect assumption that all previous prices were all zero, all close, or all average – like trying to write someone's biography but only having information about their life since last Tuesday.
But there is a better way. It requires more than high school math comprehension and is more computationally intensive, but is mathematically correct and numerically stable. This approach involves compensating calculated EMA values for the "phantom data" that would have existed before our first price point.
Here's how phantom data compensation works:
We start our normal EMA calculation:
EMA_today = EMA_yesterday + α × (Price_today - EMA_yesterday)
But we add a correction factor that adjusts for the missing history:
Correction = 1 at the start
Correction = Correction × (1-α) after each calculation
We then apply this correction:
True_EMA = Raw_EMA / (1-Correction)
This correction factor starts at 1 (full compensation effect) and gets exponentially smaller with each new price bar. After enough data points, the correction becomes so small (i.e., below 0.0000000001) that we can stop applying it as it is no longer relevant.
Let's see how this works in practice:
For the first price bar:
Raw_EMA = 0
Correction = 1
True_EMA = Price (since 0 ÷ (1-1) is undefined, we use the first price)
For the second price bar:
Raw_EMA = α × (Price_2 - 0) + 0 = α × Price_2
Correction = 1 × (1-α) = (1-α)
True_EMA = α × Price_2 ÷ (1-(1-α)) = Price_2
For the third price bar:
Raw_EMA updates using the standard formula
Correction = (1-α) × (1-α) = (1-α)²
True_EMA = Raw_EMA ÷ (1-(1-α)²)
With each new price, the correction factor shrinks exponentially. After about -log₁₀(1e-10)/log₁₀(1-α) bars, the correction becomes negligible, and our EMA calculation matches what we would get if we had infinite historical data.
This approach provides accurate EMA values from the very first calculation. There's no need to use SMA for warmup or discard early values before output converges - EMA is mathematically correct from first value, ready to party without the awkward warmup phase.
Here is Pine Script 6 implementation of EMA that can take alpha parameter directly (or period if desired), returns valid values from the start, is resilient to dirty input values, uses decaying compensator instead of SMA, and uses the least amount of computational cycles possible.
// Enhanced EMA function with proper initialization and efficient calculation
ema(series float source, simple int period=0, simple float alpha=0)=>
// Input validation - one of alpha or period must be provided
if alpha<=0 and period<=0
runtime.error("Alpha or period must be provided")
// Calculate alpha from period if alpha not directly specified
float a = alpha > 0 ? alpha : 2.0 / math.max(period, 1)
// Initialize variables for EMA calculation
var float ema = na // Stores raw EMA value
var float result = na // Stores final corrected EMA
var float e = 1.0 // Decay compensation factor
var bool warmup = true // Flag for warmup phase
if not na(source)
if na(ema)
// First value case - initialize EMA to zero
// (we'll correct this immediately with the compensation)
ema := 0
result := source
else
// Standard EMA calculation (optimized formula)
ema := a * (source - ema) + ema
if warmup
// During warmup phase, apply decay compensation
e *= (1-a) // Update decay factor
float c = 1.0 / (1.0 - e) // Calculate correction multiplier
result := c * ema // Apply correction
// Stop warmup phase when correction becomes negligible
if e <= 1e-10
warmup := false
else
// After warmup, EMA operates without correction
result := ema
result // Return the properly compensated EMA value
▶️ CONCLUSION
EMA isn't just a "better SMA"—it is a fundamentally different tool, like how a submarine differs from a sailboat – both float, but the similarities end there. EMA responds to inputs differently, weighs historical data differently, and requires different initialization techniques.
By understanding these differences, traders can make more informed decisions about when and how to use EMA in trading strategies. And as EMA is embedded in so many other complex and compound indicators and strategies, if system uses tainted and inferior EMA calculatiomn, it is doing a disservice to all derivative indicators too – like building a skyscraper on a foundation of Jell-O.
The next time you add an EMA to your chart, remember: you're not just looking at a "faster moving average." You're using an INFINITE IMPULSE RESPONSE filter that carries the echo of all previous price actions, properly weighted to help make better trading decisions.
EMA done right might significantly improve the quality of all signals, strategies, and trades that rely on EMA somewhere deep in its algorithmic bowels – proving once again that math skills are indeed useful after high school, no matter what your guidance counselor told you.

$LINK Long Overdue Move on the Horizon
BIST:LINK has shockingly been a very poor performer as well considering their revolutionary tech connecting web2 -> web3
Dump >67% and rebounded 50% since then.
PA has been trapped between the 200 and 50DA, which suggest voilent breakout coming up.
RSI Is still healthy.

$JUP is Struggling but shows signs for HOPEwtf happened to LSE:JUP
It was once heralded at the leading DEX in web3 on the premier blockchain, but dumped ~75% from ATH with only a 57% rally.
Couldn't even make a run at the 200DMA, but retesting the 50 soon.
needs to have a big dally soon above the .236 fib to test the 200DMA. A breakthrough is a strong reversal confirmation.
market cap is about 60% cheaper than BME:UNI so im liking the value here.

$SOL and Most Major Alts Get Hard Rejection from 200DMAMost of your favorite Alts such as CRYPTOCAP:SOL had hard rejections from the 200DMA.
If this trend breaks into the red box we should see a retest around the .236 Fib and 50DMA ~$140
RSI also looks McDonald's toppy
Not a good time to FOMO.
PS. Normally i dont post TA this late in the night from the US but I'm gonna consider doing more if i get some decent engagement.
Lmk if you think i should post more at these midnight hours 🎃

ETHUSD 5/16/25 UpdateHere is your update on ETHUSD via analyzing Cumulative Delta Volume (CDV), divergence between price and the Money Flow Index (MFI), and the 4h and D McGinley Moving Averages!
Happy trading, and I hope the video was helpful!

XAUUSD Update 5/16/25Here is an update on XAUUSD via analyzing Cumulative Delta Volume (CDV), divergence between price and the Money Flow Index (MFI), and the 4h and D McGinley Moving Averages!
Happy trading, and I hope the video was helpful!

CPNG (South Korean Amazon)Sitting above IPO anchored VWAP and Daily/Weekly key moving averages (50,200) and is currently in an uptrend if we can get a weekly close above the previous resistance zone at 27.12 it is looking pretty bullish. If we break the $27.12 the next target would be 30.80 where previous weekly rejections. If close above the next target is 1.618 fib of $38.31

SPY Daily Update 5/16/25Here is your daily update on SPY via analyzing Cumulative Delta Volume (CDV), divergence between price and the Money Flow Index (MFI), and the 4h and D McGinley Moving Averages!
Happy trading, and I hope the video was helpful!

BTCUSD (Coinbase) Update 5/16/25Here is your daily update on BTCUSD via analyzing Cumulative Delta Volume (CDV), divergence between price and the Money Flow Index (MFI), and the 4h and D McGinley Moving Averages!
Happy trading, and I hope the video was helpful!

Convex Finance (CVX) Rectangle (1W)BINANCE:CVXUSDT has been trading in a rectangle with well-defined boundaries since January 2023, and it has recently reclaimed the 1-year EMA, potentially shifting the bias to bullish.
Key Levels to Watch
• $1.5-$2.0: Main demand zone and invalidation point for any bullish TA if broken
• $3.0: 1-year EMA, successfully reclaimed and retested as support
• $4.4: Rectangle midline, previously relevant as a S/R
• $6.1-$7.2: Main supply zone and upper boundary of the rectangle
• $13.0: Previous swing high and rectangle breakout target, which would be confirmed by a weekly close above $7.2 with good volume

BDP. Deep Underrated Value.Market veteran and remains in business - building, researching for five years. The chart is global - weekly and a global downward channel is visible, in which the price can move x50 - amazing. Possible channel breakout will send the price to x360 and capitalization to 500 million, which is not unattainable given the niches in which the project positions itself. Me in game, sirs, prepare.

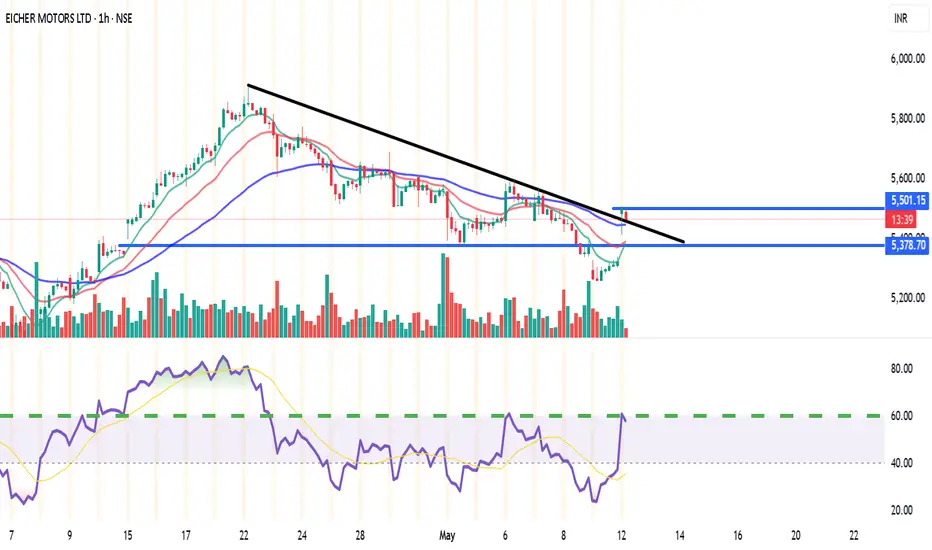
EICHERMOT (NSE) – Bullish Setup on 15min & 1H🔑 Trade Plan:
📥 Buy Above: ₹5485 (above current resistance & candle body highs)
🎯 Targets:
T1: ₹5527 (Pivot R1)
T2: ₹5555
🛡️ Stop Loss: ₹5380 (below 13 EMA & Supertrend support)
📊 Technical Signals:
RSI: 58.08 – Bullish momentum, still room to run
%B (BB): 0.77 – Close to breakout from upper band
EMA Crossover: 9 EMA > 13 EMA – Short-term bullish crossover confirmed
Supertrend: Support at ₹5322, aligning with bullish reversal
Volume: Spike during recent green candles signals strong buying interest
⚙️ Strategy Notes:
Use 15min chart for entry timing post breakout
Tighten SL to cost after T1 hits
Ideal for short-term intraday/swing traders
For Education Purposes Only
PB Fintech (NSE: 543390) Trade Setup📈 Breakout Watch | Price retesting key pivot at ₹1,745
Momentum building with RSI > 60 and bullish structure. Ideal for intraday or short swing.
🔵 Long Entry
Buy Above: ₹1,745 (Pivot breakout confirmation on 15m/1H candle close)
Target 1: ₹1,775 (minor resistance)
Target 2: ₹1,807 (next pivot)
Target 3: ₹1,869 (final swing target)
Stoploss: ₹1,720 (below previous candle low/support zone)
✅ Volume confirmation and RSI strength supporting move
🧠 Good for breakout traders looking for momentum continuation
🔴 Short Setup (if rejection from ₹1,745)
Sell Below: ₹1,730 (on rejection + bearish candle)
Target: ₹1,682
Stoploss: ₹1,745
📊 Indicators:
RSI: 65.7 → bullish, near breakout threshold
BB% B: 0.88 → strong bullish move near upper band

BTC Strength Alert: Key Levels, Fibonacci & VolatilityBitcoin (BTCUSD) Strength Alert: Key Levels, Fibonacci & Volatility Point to Entry Opportunities
Bitcoin (BTCUSD) Technical Analysis: Navigating Strength and Volatility
Bitcoin (BTCUSD) continues to capture the attention of the global financial markets, demonstrating notable resilience and underlying strength. The current market structure suggests a period where bulls are actively defending key price thresholds, creating a fascinating technical landscape. This analysis will provide an in-depth examination of BTCUSD, focusing on its price action relative to significant psychological levels, the supportive role of Fibonacci retracements, characteristic volatility patterns, and strategic entry considerations based on bullish candlestick formations.
1. Introduction to Bitcoin and the BTCUSD Pair
Bitcoin, introduced in 2009, stands as the progenitor of cryptocurrencies, operating on a decentralized peer-to-peer network secured by cryptographic principles and recorded on a public distributed ledger known as the blockchain. It was designed as a digital alternative to traditional fiat currencies, free from central bank control. The BTCUSD pair represents the exchange rate between Bitcoin and the United States Dollar, making it one of the most liquid and heavily traded instruments in the digital asset space. Its price movements are a barometer for the broader cryptocurrency market sentiment and are influenced by a myriad of factors including adoption trends, regulatory news, macroeconomic developments, and technological advancements within the Bitcoin network itself. Understanding the technical dynamics of BTCUSD is crucial for traders, investors, and market analysts seeking to navigate its often-turbulent price swings.
2. Current Market Sentiment and Price Action: Holding Above Key Psychological Levels
A significant observation in the current BTCUSD market is its ability to maintain its footing above a key psychological price level. Such levels, often round numbers (e.g., $50,000, $60,000, or in this context, a hypothetical significant level like $100,000 if we assume a major bull run has occurred), act as important mental benchmarks for market participants. When price successfully breaks above such a level and subsequently holds it as support, it can signal a powerful shift in market sentiment. This behavior suggests that buyers are willing to step in and defend this new valuation, absorbing selling pressure and preventing a swift retracement.
The act of holding above a major psychological level often has a self-fulfilling prophecy component. As traders and algorithms identify this level as critical, buy orders tend to cluster around it, reinforcing its strength as a support zone. Conversely, if the price were to decisively break below such a level after holding above it, it could trigger a cascade of stop-loss orders and a rapid decline, indicating that the previous bullish conviction has waned. The current strength shown by Bitcoin in maintaining its position above such a noted psychological threshold is therefore a bullish indicator, suggesting underlying demand and a positive short-to-medium-term outlook, provided this support continues to hold. This resilience can build confidence among market participants, potentially attracting further capital inflow.
3. Fibonacci Retracement Analysis: Identifying Strong Support
Fibonacci retracement levels are a cornerstone of technical analysis, employed to identify potential areas of support and resistance. Derived from the Fibonacci sequence – a series of numbers where each number is the sum of the two preceding ones (0, 1, 1, 2, 3, 5, 8, 13, etc.) – the key retracement levels are 23.6%, 38.2%, 50%, 61.8%, and 78.6%. These percentages are applied to a prior price swing (from a significant low to a significant high in an uptrend, or vice-versa in a downtrend) to project areas where the price might pull back before resuming the primary trend.
The observation that Fibonacci retracement levels suggest strong support at current BTCUSD levels is particularly pertinent. When the market is in an uptrend and experiences a corrective pullback, traders watch these Fibonacci levels closely. The 38.2%, 50%, and 61.8% levels are often considered the most significant. A retracement to, and subsequent bounce from, one of these levels indicates that the correction is likely a healthy pause within a larger bullish trend, rather than a reversal.
If BTCUSD is currently finding support near a critical Fibonacci level, it implies that the preceding upward momentum was strong, and the current consolidation or minor pullback is being met with buying interest at a mathematically significant point. For example, if Bitcoin recently rallied from point A (low) to point B (high), and has now retraced to the 61.8% level of that rally and is holding, it's a classic sign that bulls are re-entering the market, viewing the pullback as a discounted buying opportunity. The confluence of a psychological level with a Fibonacci support level would create an even more potent support zone, significantly increasing the probability of a price bounce. Traders often look for candlestick confirmation at these Fibonacci levels before committing to a position.
4. Volatility Analysis: US Evening and Asian Morning Hours
Volatility is an inherent characteristic of Bitcoin, representing the degree of variation of its trading price series over time. The observation that BTCUSD volatility tends to increase during US evening and Asian morning hours is a valuable insight for strategic trade timing. This period typically corresponds to the overlap between the closing of the New York trading session and the opening of major Asian financial centers like Tokyo, Hong Kong, and Singapore.
Several factors contribute to this heightened volatility:
Market Overlap and Liquidity Shifts: As one major market winds down and another ramps up, there can be shifts in liquidity. The initial hours of the Asian session often bring fresh news, order flows, and participants, leading to price discovery and increased trading activity.
News Dissemination: Significant economic data releases, corporate earnings (for Bitcoin-related companies), or crypto-specific news from either the US (late announcements) or Asia can occur during these hours, directly impacting BTCUSD prices.
Algorithmic Trading: Many trading algorithms are programmed to react to specific inter-market conditions or news events, and their activity can amplify price movements during these transitional periods.
Derivatives Market Activity: The global nature of Bitcoin derivatives markets (futures, options) means that activity in these markets can influence spot prices around the clock. The US evening/Asian morning window sees active participation from traders in these regions.
For traders, this period of increased volatility presents both opportunities and risks. Opportunities arise from potentially larger price swings that can be capitalized upon with well-timed entries. Risks are elevated due to the potential for rapid price changes, which can trigger stop-losses or lead to slippage. Therefore, while these hours can be opportune for entry, they also demand heightened vigilance and robust risk management.
5. Entry Strategies: Volatility, Candlestick Patterns, and Timing
Leveraging the increased volatility during US evening and Asian morning hours for entry timing requires a methodical approach, primarily focusing on the confirmation provided by bullish candlestick patterns. Candlestick charts offer a visual representation of price movements and can signal shifts in market sentiment and potential reversals or continuations.
Key Bullish Candlestick Patterns for Entry Confirmation:
Hammer: Appearing after a downtrend, a Hammer is characterized by a small real body at the upper end of the trading range, with a long lower shadow (at least twice the size of the body) and little to no upper shadow. It indicates that sellers initially pushed prices down, but buyers stepped in strongly to drive prices back up near the open, suggesting a potential bottom and bullish reversal.
Inverted Hammer: Also a bottom reversal pattern, the Inverted Hammer has a small real body at the lower end of the trading range, a long upper shadow, and a short (or absent) lower shadow. It suggests that buyers attempted to push the price up, but sellers resisted. However, the fact that buyers showed strength is a tentative bullish sign, requiring further confirmation.
Bullish Engulfing: This is a powerful two-candle reversal pattern. The first candle is bearish (red/black), and the second candle is bullish (green/white) with a real body that completely "engulfs" the real body of the preceding bearish candle. It signifies that buying pressure has overwhelmed selling pressure.
Piercing Line: Another two-candle bullish reversal pattern seen after a downtrend. The first candle is a strong bearish candle. The second candle opens below the low of the first candle but then closes more than halfway up the real body of the first bearish candle. This indicates a significant shift in sentiment from bearish to bullish during the second candle's session.
Morning Star: A three-candle bullish reversal pattern. It begins with a long bearish candle, followed by a small-bodied candle (which can be bullish or bearish and ideally gaps down from the first candle), and then a long bullish candle that closes well into the body of the first bearish candle (ideally gapping up from the second candle). The small middle candle (the "star") represents indecision, and the strong bullish third candle confirms the reversal.
Three White Soldiers: This is a strong bullish continuation or reversal pattern consisting of three consecutive long-bodied bullish candles. Each candle should open within the body of the previous candle and close at or near its high, making progressively higher highs. It signals sustained buying pressure.
Strategic Entry Timing:
Monitor Volatile Periods: Be particularly attentive to price action during the US evening and Asian morning hours.
Identify Key Support: Note the psychological levels and Fibonacci retracement zones where BTCUSD is expected to find support.
Scan for Bullish Candlesticks: Look for the formation of one of the aforementioned bullish candlestick patterns (or others like Dojis at support, Bullish Harami) at or near these support levels during the identified volatile periods.
Seek Confirmation: Wait for the candlestick pattern to fully complete at the close of its period (e.g., end of the hour for an hourly chart). Some traders wait for the next candle to trade above the high of the bullish pattern for further confirmation.
Volume Analysis: Higher trading volume accompanying the formation of a bullish candlestick pattern adds to its reliability, indicating stronger conviction behind the buying pressure.
Context is Key: Bullish reversal patterns are most potent when they appear after a discernible pullback within a larger uptrend, or at the end of a consolidation phase near strong support.
By combining the timing advantage of predictable volatility spikes with the confirmation signals from bullish candlestick patterns at technically significant support levels, traders can refine their entry strategies for BTCUSD.
6. Other Key Technical Indicators for Comprehensive Analysis
While the core observations provide a strong foundation, incorporating other technical indicators can offer a more holistic view of BTCUSD's market dynamics:
Moving Averages (MAs): MAs smooth out price data to identify trend direction and potential support/resistance. The 50-day, 100-day, and 200-day SMAs (Simple Moving Averages) or EMAs (Exponential Moving Averages) are widely watched. Price trading above these MAs is generally bullish. Crossovers, like a "golden cross" (50-day MA crossing above the 200-day MA), are considered strong long-term bullish signals. Conversely, a "death cross" (50-day MA crossing below the 200-day MA) is bearish.
Relative Strength Index (RSI): This momentum oscillator measures the speed and change of price movements, ranging from 0 to 100. An RSI above 70 is often considered overbought (suggesting a potential pullback), while below 30 is oversold (suggesting a potential bounce). However, in strong trends, BTCUSD can remain in overbought or oversold territory for extended periods. Bullish or bearish divergences between price and RSI (e.g., price making a new high while RSI makes a lower high) can signal weakening momentum.
MACD (Moving Average Convergence Divergence): This trend-following momentum indicator consists of the MACD line and a signal line. A bullish crossover occurs when the MACD line crosses above the signal line, suggesting increasing upward momentum. A bearish crossover is the opposite. The MACD histogram visualizes the distance between the MACD and signal lines; a growing positive histogram is bullish.
Horizontal Support and Resistance Levels: Beyond Fibonacci, historical price action creates distinct support (price floor) and resistance (price ceiling) levels. These are areas where the price has previously reversed or consolidated. Identifying these levels on daily and weekly charts provides a broader map of potential turning points.
Trendlines and Channels: Drawing trendlines connecting successive lows (uptrend line) or highs (downtrend line) helps visualize the dominant trend. Price often respects these lines. Parallel trendlines can form channels, providing dynamic support and resistance boundaries. A break out of a well-established trendline or channel can signal a significant change in trend.
Volume Analysis: Trading volume is a critical confirming indicator. A price rally accompanied by increasing volume is generally seen as healthy and sustainable. Conversely, a rally on declining volume may indicate weakening conviction. Spikes in volume during breakouts above resistance or bounces from support add validity to the price move.
Integrating these indicators with the primary observations about psychological levels, Fibonacci support, and candlestick patterns during volatile periods can provide a more robust and nuanced trading framework.
7. Risk Management in Bitcoin Trading
The high volatility inherent in BTCUSD, while offering profit potential, also necessitates stringent risk management. Without it, traders expose themselves to significant losses. Key risk management practices include:
Stop-Loss Orders: Always define an exit point for a trade if it moves against you. A stop-loss order automatically closes a position when the price reaches a predetermined level, limiting potential losses.
Position Sizing: Determine the appropriate amount of capital to allocate to a single trade based on your overall portfolio size and risk tolerance. A common rule is to risk no more than 1-2% of trading capital on any individual trade.
Risk/Reward Ratio: Before entering a trade, assess the potential profit (reward) versus the potential loss (risk). Aim for trades where the potential reward is significantly greater than the risk (e.g., 2:1 or 3:1).
Diversification: While this analysis focuses on BTCUSD, traders should consider diversifying their overall crypto portfolio if they are investors, rather than concentrating all funds in one asset.
Emotional Discipline: Avoid making trading decisions based on fear (FUD - Fear, Uncertainty, Doubt) or greed (FOMO - Fear Of Missing Out). Stick to a well-defined trading plan.
8. Potential Future Outlook (Based on Technicals)
Based on the current technical posture where Bitcoin shows strength above a key psychological level and finds support at Fibonacci retracement zones, the outlook leans cautiously optimistic, contingent on these supports holding.
Bullish Scenario: If BTCUSD continues to respect these support levels, particularly during periods of consolidation, and bullish candlestick patterns during volatile US evening/Asian morning hours lead to upward impulses, further upside is likely. A sustained break above immediate overhead resistance, confirmed by volume, could see BTCUSD challenge its next major resistance zones and potentially trend towards new highs. The ongoing defense of psychological levels is paramount for this scenario.
Bearish Scenario: Should the identified support levels (psychological and Fibonacci) fail to hold, the outlook could shift. A decisive break below these supports, especially on increased selling volume, would indicate that sellers have gained control. This could lead to a deeper correction, targeting lower support structures and potentially invalidating the current bullish sentiment. Increased volatility during the US evening/Asian morning hours could, in this case, exacerbate downward moves if bearish patterns emerge.
9. Conclusion
The technical analysis of BTCUSD reveals a market displaying notable strength, characterized by its ability to hold above a significant psychological price point and find robust support at Fibonacci retracement levels. This underlying resilience is a positive sign for bulls. The tendency for volatility to surge during the US evening and Asian morning trading sessions presents strategic windows for traders, particularly when seeking entries confirmed by validated bullish candlestick patterns at these critical support junctures.
A comprehensive trading approach should also integrate other indicators like moving averages, RSI, MACD, and volume analysis to confirm signals and understand the broader market context. While the current technical setup suggests a favorable environment for bulls, the inherent volatility of Bitcoin demands disciplined risk management practices. Traders must remain vigilant, adapting their strategies to the evolving price action and ensuring that any bullish conviction is continuously validated by the market's behavior at these key technical inflection points. The interplay between these technical elements will be crucial in determining BTCUSD's trajectory in the near to medium term.

Where is BTCUSD headed? Using CDV to boost CONFIDENCE!Here is some analysis on where BTCUSD is more likely headed using Cumulative Delta Volume to help determine A) the current trading environment (bullish or bearish) B) when the current move might stall and C) the ideal conditions for taking a trade that we can be confident with D) a quick peek at the US dollar and how that might factor in analyzing BTCUSD price action...
I hope this has been helpful for you in providing some more confidence for you in your trading! Until next time!

Triangle Breakout Alert: IOLCP Eyes ₹100!Key Observations:
Symmetrical Triangle Pattern:
The price was consolidating within a symmetrical triangle, marked by:
Descending trendline (upper resistance)
Ascending trendline (lower support)
Breakout:
On May 15, 2025, the stock broke out above the descending trendline with a strong bullish candle.
The breakout is accompanied by a significant increase in volume (5.3M), which validates the breakout strength.
Price Movement:
The stock closed at ₹77.04, up 9.56% for the day.
This strong move above resistance suggests the beginning of a potential uptrend.
Technical Implications:
Bullish Signal: The breakout from a consolidation pattern with high volume is a classic bullish indicator.
Resistance Turned Support: The breakout level around ₹68-₹70 could now act as a support zone.
Upside Targets (based on pattern height):
Approximate height of triangle: ₹88 (peak) - ₹58 (base) = ₹30
Projected target = Breakout level (₹70) + ₹30 = ₹100 (short- to medium-term target)
Conclusion:
This is a bullish breakout setup. Traders might consider this a buy signal with potential targets around ₹90–₹100, and a stop-loss near ₹68 to manage risk.

APAR Ignites: Breakout Above 200 EMA Signals Bullish Surge📘 Technical Analysis Report
Stock: APAR Industries Ltd. (NSE)
Chart Type: Daily Candlestick Chart
Date: May 15, 2025
📊 Price Action
Current Price: ₹7,941.00
Daily Change: +₹1,013.50 (+14.63%)
Strong bullish candlestick observed with significant upward momentum.
V-shaped recovery from recent lows near ₹5,000, indicating a reversal from the downtrend.
🧠 Moving Averages
20 EMA (Red): ₹6,058.67
50 EMA (Orange): ₹6,086.08
100 EMA (Cyan): ₹6,794.72
200 EMA (Blue): ₹7,380.56
Price has broken above all key EMAs, including the 200 EMA — a strong bullish signal.
Golden crossover signals a shift in long-term trend direction.
📈 Volume Analysis
Substantial volume spike on the breakout day.
Volume confirms price action, indicating strong institutional buying interest.
🔍 Support & Resistance Levels
Immediate Support Zone: ₹6,800 – ₹7,300
Previous Resistance (now support): ₹7,380 (200 EMA)
Next Resistance Levels: ₹8,100 – ₹8,300 (previous swing highs)
🧭 Trend & Momentum
Market structure shows a transition to higher highs and higher lows.
Momentum is strong with a confirmed breakout above consolidation.
Sustained strength above 200 EMA points to a trend reversal to the upside.
📌 Outlook & Strategy
Bullish Bias: Breakout confirmed by price and volume.
If sustained above ₹7,380: Likely upside target is ₹8,300–₹8,500.
On pullbacks: ₹7,300–₹7,400 could act as a demand zone and provide buying opportunities.
Ideal for trend-following traders and short- to mid-term positional setups.

Bitcoin Dominance $BTC.D just bounced off the 62.0%Bitcoin Dominance just bounced off the 62.0% zone and held the 100 EMA.
Altcoins had a moment — but the tide may be turning.
📉 Pullback held above key demand (61.0%–61.5%)
📊 Now reclaiming 62.7% with EMAs curling up
💥 Break above 63.5% = renewed pressure on alts

Staring Down A Market Crash - $400 Target for SPY"B" waves are phonies. They are sucker plays, bull traps, speculators' paradise, orgies of odd-lotter mentality or expressions of dumb institutional complacency (or both). They often involve a focus on a narrow list of stocks, are often "unconfirmed" by other averages, are rarely technically strong, and are virtually always doomed to complete retracement by wave C. If the analyst can easily say to himself, "There is something wrong with this market," chances are it's a "B" wave.”
— The Elliott Wave Principle
In my last major idea for SPY, I predicted a bear market rally would take the price to $580 by early May. Now that we have arrived at the target, I am writing again to call for a major market reversal — a crash that will take SPY down to $400–$450 in the coming weeks. There are several factors that I am basing my assumptions on, and I will break them down briefly.
Before I do that, I would like to add to the quote above that I find B waves to be one of the most fascinating market phases. In larger degrees it is interesting to observe how sentiment changes over time and how price action can trick even seasoned traders into thinking the bear market has been vanquished, when in reality the worst lies ahead. In this instance, the collective euphoria is understandable; the trade war seems to be in retreat and inflation has remained tame. What is left to worry about? Who knows — but what I can say is that there are signs that there is still fear in the market and indices are currently at a level where they will be highly sensitive to any bad news.
Here is how I’m counting Wave (B) on the 200R ($2) chart. The price retraced to nearly 0.618 of A (0.382 level on the fib extension) and entered Wave C. I will admit that the PA in Wave C was confusing at first. As I mentioned in my previous idea, I expected the price in Wave (B) to rise to around 75% of Wave (A) and would spike above the daily 50/100/200 MAs. However, the uptrend was choppy and slow — held back by low volume and multiple traps for both sides. Fortunately, the further a trend moves along, the more clear it becomes. I am now counting Wave C of (B) as an ending diagonal, which is common in C waves.
In the diagonal, the price rose in five distinct waves once it entered the channel, with Wave (v) throwing over the top and being met with heavy resistance, which happens to be at the 1.618 extension of Wave A. While this is nearly a perfect diagonal per the rules, one issue I will point out is that Wave (iv) stopped just short of Wave (i) territory. Typically in a diagonal it should retrace into Wave (i); however, I’ll consider this to be close enough.
If the price were to move higher, the next target would be the 2.00 extension of A ($612.70). This would be near the previous ATH, which would signal a flat correction. While this is not impossible, I am going to stick with my initial instinct that the price will reverse around this level when other market indicators are taken into consideration. More on that later.
On the weekly chart, there is volume divergence and a major gap that was started this week at $570. Additionally, if Wave (B) were to end this week, it may end up with less volume than Wave (A). Since Wave (A) lasted for 8 weeks (a Fibonacci number), my box for Wave (C) is the next highest in the sequence — 13. This is just a guess, but if we were to see a similar pattern play out, AMEX:SPY should bottom out in late July or early August. The Weekly 200MA should be an important area of support, so be sure to keep an eye on that.
Also, do not forget to check the Monthly chart. Here we can see that April has a very long downside wick. I would expect to see this get filled in.
Lastly, on the daily chart, here is a recap of where we are in relation to my previous idea calling for $580 on SPY. As I predicted, the price popped above the 100MA and is finding resistance. The 100MA is ready to cross the 200MA, which can be thought of as a second death cross, if you will. I also have boxes here to show the unfilled gaps to the downside. With the trend being this exhausted, I would expect to see both get filled in soon.
Bearing all of this in mind, some people may argue that the technicals do not matter in this environment. After all, some of the headwinds that caused the first crash have dissipated and recession fears seem to be waning. While I won’t argue against any of that, there are other signs that the market is not out of the woods yet. Looking beyond SPY, TVC:US10Y has been on the rise and is on track to make a higher high. I’m targeting 5% over the coming weeks. I have another idea that looks more closely into this so I won’t elaborate any further in this post; however, this is one sign that institutions are risk-averse when it comes to the US economy.
The other component of this assessment is that the dollar appears to be heading lower. The chart above is inverted to more easily show what appears to be a classic impulse wave structure entering Wave 5, which could take TVC:DXY to the 1.618 extension of Wave 1 — around $96.68. If this were to play out, the dollar index would reach its lowest level since March 2022. This could spur a debt crisis where the Fed will have to make difficult decisions. If they start cutting rates to lower yields, it could also add further downside pressure to the dollar, which could make finding the right balance difficult. Keeping rates higher for longer and buying back Treasuries would be the preferred route, but Powell could face mounting political pressure to start making cuts if it seems the situation is getting out of hand, and could lead to more trouble down the road. This strain could be a possible fundamental backing for a stock market sell-off, so it is important to pay attention to.
Lastly, the final signs that indicate to me that a reversal is coming soon is that this uptrend is losing breadth. This is evident when looking at indices that are not weighted so heavily by mega cap tech stocks, such as TVC:DJI and $RUT. It was striking to see AMEX:DIA and AMEX:IWM down Tuesday and Wednesday while AMEX:SPY and NASDAQ:QQQ inched higher. On AMEX:DIA , the 100MA is starting to cross the 200MA and volume is picking up. Once tech starts selling off, we will see the other major indexes tumble.
I could keep going on and on, but you get the point. Here is TVC:VIX at a critical support level and starting to reverse higher. One last comment on B waves is that it is dangerous to follow the herd during times like these. Trust the technicals, and when something seems off — trust your instincts. We will never know what news is around the corner, but financial markets are so vast that we should assume that all factors known and unknown to the general public are being priced in real time.
As the next phase of the downtrend gets going, it will be easier to predict the bottom with greater accuracy. For now, I’m keeping the range wide and will look for $400–$450. As always, thank you for reading and let me know what you think.

$BTC 55 EMA Cross Over 50 W MA on a Daily Chart 162% Gain?
The last time that the 50 Day MA crossed under the 50 Week MA and the then the 55 EMA crossed over the 55 EMA it took 8 bars or 56 days. This move led to about a 162% gain.
The same thing just happened today, the 56th day within 8 bars, the 55 EMA crossing over the 50 Week MA. The Stoc RSI, RSI, and MACD are near the same or very similar values.
Will history repeat?

$UNG starting to accumulate a position. Swing TradeBuilding a position in unleveraged natural gas AMEX:UNG in $13-14's
Divergence on price/RSI.
Falling Wedge
Would like to see price get over and hold above daily 50MA
Will likely update once that is achieved
After 50MA is achieved and held, breakout the wedge and target the 200MA daily for profit.
Add on down days and be very patient with this one
