BTC bull cycle comes to an end.We can see it clearly on the chart. BTC has ended the 5 waves pattern in Elliot wave count. you can see it on the chart, you can see it on the MACD & RSI.
What we are seeing now is that because of Greed & Hype no one is selling bitcoin. the up-trend we are seeing now is the result of no sellers and Hype Buyers. This is a bull trap. We can see the divergence clear as day. Stay alert and dont let them catch you this time.
Moving Averages

ADITYA BIRLA CAPITAL LTD – Trend Reversal Breakout Trade🧠 Technical Highlights:
Downtrend Channel Breakout: Clear breakout from a falling channel pattern
Resistance Break: Strong breakout above supply zone of ₹204–₹210
Volume: Massive volume spike validates bullish strength
RSI: Above 70, indicating strong momentum but not overbought yet
🟢 Buy Setup
Buy Above: ₹219 (today's close confirms breakout)
Stoploss: ₹204 (below the previous resistance/new support)
Target 1: ₹235
Target 2: ₹248
Target 3: ₹260+ (swing/high-risk high-reward)
🔻 Sell/Short Setup (only if reversal)
Sell Below: ₹203
Stoploss: ₹210
Target: ₹190, ₹178
📅 Timeframe: Short-to-Medium Term (2–6 weeks)
📊 Risk-Reward: ~1:2.5
For Education Purposes Only

Elanco Animal Health Inc | ELAN | Long at $11.16Elanco Animal Health NYSE:ELAN is riding my historical simple moving average and likely to make a move up soon. Insiders have recently been awarded options and bought $483,000+ worth of shares. Became profitable this year, low debt, P/E = 15x.
Long at $11.16
Targets:
$12.50
$14.50
$16.00
$17.50

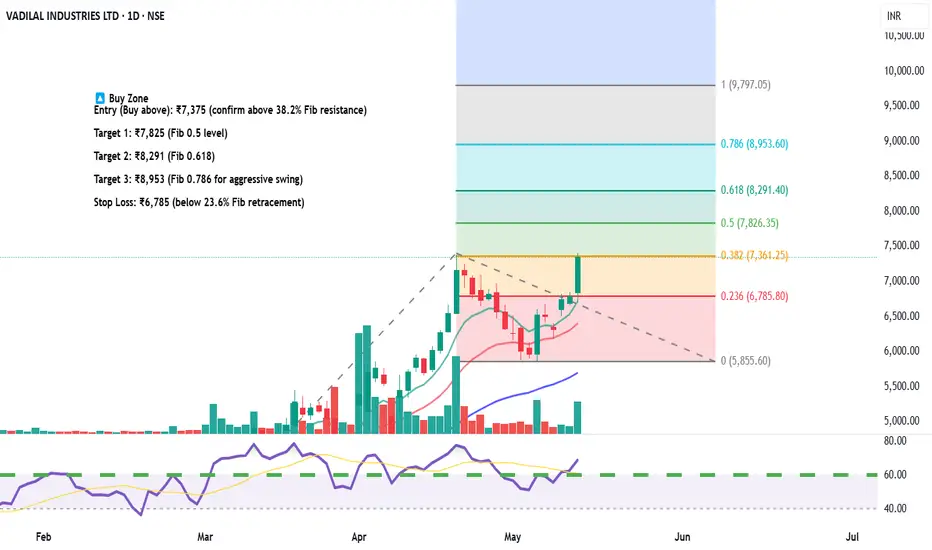
Vadilal Industries – Equity Trade Setup & Research View🟢 Long Trade Setup (Bullish Reversal Play)
Current Price: ₹7,346.50
Fibonacci Level Tested: 38.2% at ₹7,361 — a crucial breakout level
Trendline Breakout: Price has broken above falling trendline with volume confirmation
RSI: Near 60 – bullish momentum building
🔼 Buy Zone
Entry (Buy above): ₹7,375 (confirm above 38.2% Fib resistance)
Target 1: ₹7,825 (Fib 0.5 level)
Target 2: ₹8,291 (Fib 0.618)
Target 3: ₹8,953 (Fib 0.786 for aggressive swing)
Stop Loss: ₹6,785 (below 23.6% Fib retracement)
🔻 Short Trade Setup (if rejection happens)
Sell Below: ₹7,200
Target: ₹6,785
Stoploss: ₹7,375
📅 Timeframe: Daily (1D)
📊 Risk/Reward Ratio: 1:2.5+
🔁 Valid for: Next 2–4 weeks
For Education Purposes Only
ADANI Enterprises Ltd..... Seems to hv finally broken out.ADANI Enterprises Ltd..... Seems to hv finally broken out of the 38.2 % Fib Resistance, 2 days in a row (most likely). This is the third time its trying to break out of this zone. It's crossed the 50 ema & nearing the 200.
Needs to take out 2497, the recent high on a closing basis for a smoother ride up.
Am Bullish on the stock, one more reason being its subsidiary ' KUTCH COPPER ' which is to begin production full fledged very soon. Lets See.

$SPY May 14, 2025AMEX:SPY May 14, 2025
15 Minutes.
AMEX:SPY crossed 586 and made a high 589 levels.
Oscillator divergence.
Too far away from moving averages in 15 minutes.
So, a pull bac to 580 is on cards.
We have seen this setup many times.
Working in our favor.
I don't see any different this time too.

Gabriel India Ltd (GABRIEL) – Weekly Resistance Breakout Setup✅ Trade Idea:
Price has reclaimed the 0.618 retracement at ₹608.25
Breakout above the ₹612 horizontal level (weekly closing basis)
Volume is rising and RSI shows strong uptrend
💰 Buy Zone:
Entry: ₹610 – ₹613
(preferably above ₹612 on strong 15min or 1H candle close)
🎯 Targets:
T1: ₹630 (previous minor supply zone)
T2: ₹646.65 (Fib 0.786 level)
T3: ₹695.55 (Fib 1.0 extension)
T4: ₹836.85 (1.618 extension for swing positional)
🛑 Stop Loss:
Intraday SL: ₹598 (below 9 EMA on 1H)
Swing SL: ₹581 (Fib 0.5 retracement support)
🔁 Strategy:
Wait for confirmation via volume + RSI > 60
Trail SL to ₹610 once ₹630 is hit
Lock partial profit near ₹646 if market sentiment weakens
For Education Purposes Only

$DXY Up, M2 Money Supply DownWhen the DXY goes UP,
M2 Money Supply goes DOWN.
Remember the 12-Week Lead correlation with CRYPTOCAP:BTC

$SOL About to Outperform $ETHToday looks like a good day to flip your CRYPTOCAP:ETH for CRYPTOCAP:SOL 😎
Flirting with the 200DMA,
RSI has bottomed,
feels good man 🐸

Quick View: $GOOGL(daily) EMA21 created a box right below the crossover.
(weekly), good test EMA21-EMA50
Watching $167 as key resistance.
Support → $138/$145

Quick View: $PLTREMA21 crossed above EMA50 and pulled back.
Box right now on the go.
Watching for a #TopSwing Setup
Area of $121 as key resistance.
Support → $114 and $104

5/12 Gold Trading SignalsGood morning everyone!
Gold opened lower and extended losses today, influenced by easing China–U.S. trade tensions and ceasefire news from India-Pakistan.
The recent rally was largely driven by safe-haven demand amid geopolitical concerns. As tensions ease, gold's retracement is a logical market reaction.
🔍 Technical Outlook:
Gold has now returned to a previous consolidation zone . While some support exists, current candlestick structure and most indicators show no clear bullish reversal yet.
Entering long positions too early may pose short-term risks, so trend trades should wait for stronger confirmation.
For flexible intraday trading, watch:
Support at 3263–3246: Holding this zone could trigger a rebound back toward 3309 resistance.
📌 Trading Recommendations:
✅ Sell Zone: 3306 – 3321
✅ Buy Zone: 3218 – 3198
🔁 Range for Scalp/Short-Term Trades: 3294 – 3263 / 3238 – 3269

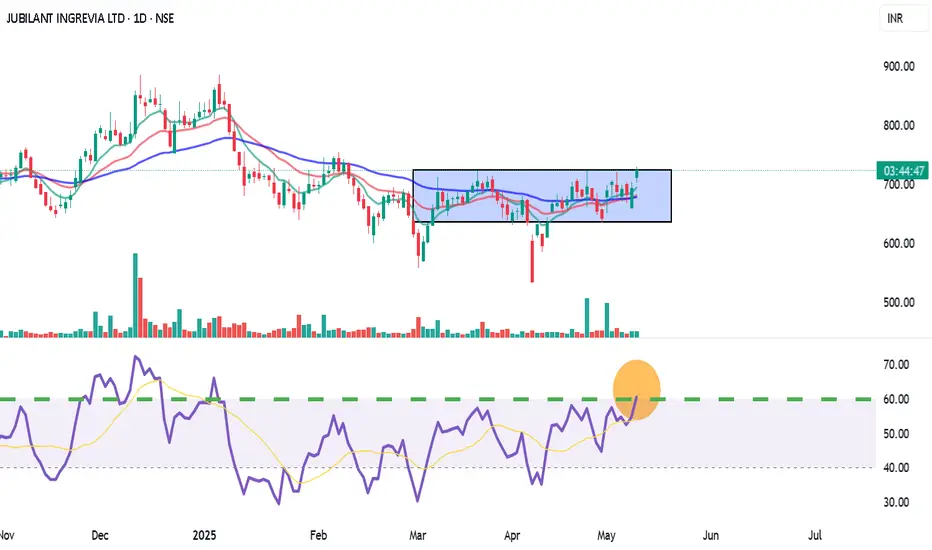
Jubilant Ingrevia (JUBLINGREA) – Short-Term Breakout Trade LTP: ₹726.30 | Recommended Entry: ₹722.00 – ₹723.00
Type: Short-Term Swing / Intraday MTF Trade
✅ Trade Setup:
Breakout above horizontal resistance near ₹725.75
9 EMA has crossed 26 EMA (bullish momentum)
RSI at 60.84 – strong trend, room for upside
BB %B: 0.96 – price pushing upper band = momentum buying
Good volume breakout on daily TF confirms buying interest
🟢 Buy Zone: ₹722 – ₹723
🔁 On retest or 15-min candle close above ₹725.75 with volume
🎯 Targets:
T1: ₹738
T2: ₹750 (supply zone / fib level)
T3: ₹765+ (if breakout sustains in 1H)
🛑 Stop Loss:
Conservative SL: ₹707 (below support + 9EMA)
Aggressive SL: ₹712 (tight SL for intraday)
For Education Purposes Only
Solana (SOL) Rallies Above $162 Zone: Technical and FundamentalSolana (SOL) Rallies Above $162 Zone: A Technical and Fundamental Analysis of Its Path to $180 and Beyond
Solana (SOL), the high-performance blockchain network known for its lightning-fast transactions and scalable infrastructure, has once again captured the attention of cryptocurrency markets. After a fresh surge above the $162 psychological level, SOL price has entered a consolidation phase near $175, hinting at a potential breakout toward $180 and even $200. This article delves into the technical indicators, fundamental catalysts, and market sentiment driving Solana’s recent rally, while offering a balanced perspective on its short- and long-term prospects.
Technical Analysis: Rising Channel and Key Resistance Levels
1. Recent Price Action and Consolidation Phase
Solana’s price trajectory in recent weeks has been marked by volatility, but the broader trend remains bullish. On , SOL initiated a fresh upward move above the $155 and $162 zones, fueled by renewed investor confidence and macroeconomic tailwinds. The rally, however, faced resistance near $165, causing a temporary pullback.
SOL is trading near $175, consolidating gains after a 22% intraday surge. This consolidation phase aligns with the formation of a short-term rising channel on the hourly chart (data sourced from Kraken), with immediate support at $172. The channel’s upper boundary currently resides near $176, a critical resistance zone that, if breached, could trigger a fresh rally toward $180 and beyond.
2. Key Technical Indicators
• 100-Hourly Simple Moving Average (SMA): SOL price is currently trading below the 100-hour SMA, suggesting short-term bearish sentiment. However, a close above this level could signal a resumption of the uptrend.
• Relative Strength Index (RSI): The RSI on the hourly chart hovers near 50, indicating neutral momentum. A move above 60 would confirm bullish dominance.
• Volume Profile: Recent price spikes have been accompanied by elevated trading volumes, reinforcing the strength of the rally.
3. Bullish Scenario: Breaking $176 and Targeting $180
If Solana successfully clears the $176 resistance, the next immediate target would be the $180 psychological level, which coincides with the 200-day moving average. Analysts note that a sustained close above $180 could open the door to $200, driven by momentum traders and institutional inflows.
4. Bearish Scenario: Support at $172 and $165
Conversely, a breakdown below $172 would invalidate the rising channel pattern, exposing the $165 support zone. Further weakness could retest the $155 level, though this outcome appears less likely given the current bullish momentum.
________________________________________
Fundamental Drivers: 1inch Integration and Memecoin Frenzy
1. 1inch Network Integration: A Catalyst for Growth
One of the key fundamental catalysts behind Solana’s rally is its integration with 1inch Network, a decentralized exchange (DEX) aggregator and liquidity protocol. This partnership enhances Solana’s ecosystem by:
• Improving Liquidity: 1inch’s aggregation algorithms optimize trade execution on Solana-based DEXs, attracting traders and liquidity providers.
• Expanding Use Cases: The integration enables seamless cross-chain swaps, positioning Solana as a hub for multi-chain DeFi activity.
• Boosting Developer Activity: Increased infrastructure support could accelerate the launch of new decentralized applications (dApps) on Solana.
2. Memecoin Surge: The Role of Speculative Capital
Solana has emerged as a preferred platform for memecoin launches, driven by its low transaction fees and high throughput. Projects like SEED_DONKEYDAN_MARKET_CAP:BONK and NASDAQ:WEN have gained viral traction, drawing retail investors and creating a “fear of missing out” (FOMO). This speculative frenzy mirrors Ethereum’s memecoin boom in 2021–2022, with Solana’s faster and cheaper network offering a competitive edge.
3. Institutional and Retail Adoption
• Institutional Interest: Grayscale and other asset managers have added Solana to their crypto investment products, signaling growing institutional confidence.
• Retail Participation: On-chain data reveals a surge in small-cap wallet creations, indicating grassroots retail adoption.
________________________________________
Market Sentiment and Analyst Predictions
1. Bullish Outlook from Analysts
Technical analysts and on-chain experts have highlighted several factors supporting Solana’s bullish case:
• Accumulation by Whales: On-chain analytics firm Santiment reported a spike in large whale transactions, suggesting institutional accumulation.
• Network Activity Metrics: Solana’s daily active addresses and transaction volume have surged to 3-month highs, reflecting heightened network usage.
• Rare Chart Pattern: A “cup-and-handle” pattern on the daily chart implies potential for a 30–40% rally if resistance at $180 is cleared.
2. Skepticism and Risks
Critics argue that Solana’s rally is overextended, citing:
• Overbought RSI on Weekly Charts: The RSI currently resides near 75, signaling overbought conditions that could precede a correction.
• Competitive Pressure: Ethereum’s Layer 2 solutions (e.g., Arbitrum, Optimism) and rivals like Sui and Aptos continue to challenge Solana’s market share.
• Regulatory Risks: The SEC’s ongoing crackdown on crypto exchanges and tokens could dampen investor sentiment across the sector.
________________________________________
Future Projections: Path to $200 and Beyond
1. Short-Term Target: $180–$200
If Solana sustains its rally above $176, the next resistance zones to monitor are:
• $180: Psychological barrier and 200-day SMA.
• $190: Fibonacci extension level from the recent rally.
• $200: Historical resistance-turned-support from late 2023.
2. Long-Term Potential: $300+ in Q4 2024
Bullish scenarios envision SOL reaching $250–$300 by year-end, driven by:
• Spot SOL ETF Approvals: Regulatory greenlights in the U.S. could unlock billions in institutional inflows.
• AI and Web3 Integration: Solana’s partnership with AI projects (e.g., ChatGPT integration on Solana-based apps) could drive mainstream adoption.
• Bitcoin’s Bull Run: A broader crypto market rally, spurred by Bitcoin’s potential breakout above $80,000, would likely lift Solana’s price.
________________________________________
Risks and Challenges
1. Market-Wide Volatility
Cryptocurrencies remain highly correlated with macroeconomic factors, including U.S. interest rates and equity market performance. A sudden Federal Reserve pivot toward hawkish policy or a stock market crash could trigger a sector-wide sell-off.
2. Network Downtime and Security Risks
Solana has experienced periodic network outages and congestion during high demand. While the team has addressed these issues through upgrades, any future disruptions could erode trust.
3. Regulatory Uncertainty
The SEC’s classification of SOL as a security (vs. commodity) remains unresolved. Adverse regulatory rulings could impose restrictions on trading and staking.
________________________________________
Conclusion: Is Solana a Buy Ahead of the Next Leg Up?
Solana’s recent rally above $162 and consolidation near $175 underscores its resilience and growing appeal among traders and developers. Technical indicators, coupled with fundamental catalysts like 1inch integration and memecoin adoption, paint a bullish picture for SOL’s trajectory toward $180 and $200. However, investors must remain cautious of overbought conditions, competitive pressures, and regulatory risks.
For those considering exposure, a dollar-cost averaging (DCA) strategy could mitigate volatility risks, while close monitoring of on-chain metrics and macroeconomic trends will be critical. As with all investments in crypto, thorough research and risk management are paramount.
Disclaimer: This article is for informational purposes only and does not constitute financial advice. Cryptocurrency markets are highly volatile and speculative. Always consult a qualified professional before making investment decisions.

Continuation of bullish trendSeems that the trade deal between China and USA is behaving well with the general market, in my opinion the market will continue up for a while, however we need to be aware that at some point will need to breath and at least pull back to one of the EMAs, plus since it is now touching the top of the BB it will most likely pull-back at some point in the future, that doesn't mean it will reverse, but instead, give us another opportunity to enter the markets again, in line with the general market and at a good position to capitalize from the market movement.

$IWM, small caps, not YET giving the "all clear"AMEX:IWM is the lone index still not in the clear 🚩 — backtesting its 200dma today and tagging the weekly mid-BB , just like in '22. Will it matter by week's end? If not, the bull is likely back across the board 🐂
This week's #CPI (Consumer Price Index) and #PPI (Producer Price Index) prints could significantly influence market direction across major indices — AMEX:SPY , NASDAQ:QQQ and AMEX:IWM — especially with rate cut expectations in flux. 🧵Here's how:
1. Hot CPI or PPI (above expectations):
AMEX:SPY : Likely to pull back as sticky inflation pressures broader S&P names, especially rate-sensitive sectors like real estate and utilities.
NASDAQ:QQQ : Could see sharper downside—tech stocks (many of which are high duration assets) are highly sensitive to interest rate expectations.
AMEX:IWM : Likely the hardest hit. Small caps suffer from tighter financial conditions and depend more on domestic borrowing costs.
🟥 Result: Bearish across the board, with small caps underperforming.
2. Cool CPI or PPI (below expectations):
AMEX:SPY : Broad lift, particularly in consumer discretionary and financials.
NASDAQ:QQQ : Strong rally—mega cap tech loves the prospect of lower yields.
AMEX:IWM : Outperforms if cooling inflation suggests easing ahead, since it's more leveraged to rate cycles and domestic growth.
🟩 Result: Bullish, with small caps possibly leading a relief rally.
3. In-line CPI/PPI :
Markets may stay choppy or consolidate, with AMEX:SPY and NASDAQ:QQQ more stable.
AMEX:IWM remains at risk of drifting lower unless there’s a strong dovish narrative from the Fed or other macro catalysts.
With small caps already lagging, this week’s inflation data could either validate its bearish divergence or spark a rotation rally if inflation
AMEX:SPY NASDAQ:QQQ TVC:VIX $ES_F $NQ_F $RTY_F TVC:TNX NASDAQ:TLT TVC:DXY #Tariffs #Stocks

$NAS100 / $QQQ – The 200 SMA Breakout... or Bull Trap?📈 Nasdaq just charged through the 200-day moving average like it wasn’t even there. But if you zoom out, this level has acted as a brick wall before — and we may be walking straight into a trap.
🔍 Key Observations:
The last failed breakout above this zone led to a major rejection.
We're back at horizontal resistance from prior tops.
Price action resembles a Rope-a-dope move — run up, suck in longs, then rug pull.
⚠️ No real breakout without confirmation + volume. Don’t let the short-term green candles distract you from the macro ceiling above.

Bitcoin Dominance is testing the monthly 100 EMA — and stalling.Bitcoin Dominance is testing the monthly 100 EMA — and stalling.
Price action shows clear hesitation at a key macro level.
If this holds, alts could catch a bid for the first time in months.
Break it? Altcoins stay sidelined.
Critical moment for market rotation.

$TSLA – Base Breakout Setup with Dual Entry StrategyTesla ( NASDAQ:TSLA ) is coiling up, forming a classic base breakout setup with a dual approach for traders who want precision:
🔹 Support Zone Entry (280-285)
Shaded area = the zone between the 9 EMA (blue) and 20 EMA (yellow) — a key dynamic support area.
I'm taking a starter position here with a stop just below yesterday's low for tight risk control.
🔹 Breakout Confirmation (Above 295)
Full size only if we see a clean breakout above $295, confirming momentum.
This is where I’ll add size, looking for a strong continuation.
🔹 Execution Plan
Starter position: Shares and options at support zone ($280-$285).
Full position: Add at breakout ($295) with a mix of shares and options.
Risk: Tight stop below yesterday's low for the starter position.
⚠️ Risk Management: Always respect your stops — discipline over hope.

[XAUUSD] Daily Analaysis 12 - 13 May 2025Continuing my mapping in the previous post, H4 GOLD turned out to be stronger and brought GOLD down to support 3195 - 3238. Of course, today's large decline will be followed by a fairly high correction as well. Anticipate GOLD which will correct to the previous low at 3282.
With the confirmed downtrend pattern, the SELL Area 3262 - 3290 is worthy of our SELL position again.

EURCHF Sell - May 12, 2025Risk : Full 1%
🧠 Reasoning:
Price reacted from Daily EMA, with a strong wick rejection and bearish engulfing.
Entry at 15m imbalance left behind inside a 15m POI.
🎯 TP:
First TP at Asia lows, 1:3 RR → take off 75%
Final TP at second Asia low or gap, close to 6RR
📉 Bias: Bearish | Risk Management: Partial close at 3RR

MSTR (Strategy) coming up to $395, the smaller resistance levelNASDAQ:MSTR has rebounded from the bottom fairly fast compared to other stocks and indexes. It's even performed better than Bitcoin itself. However it should be hitting heavy resistance now near 395-400 and above is only heavier resistance. It's time for a pullback and a breather for MSTR. Target is the Point of Control near $350, before going higher. However we could turn bullish again before reaching $350
I personally know someone who played with fire by buying MSTR options calls while it was dropping before, meaning he was trying to catch a falling knife and got burnt finally. He lost nearly $500,000 because of it. So I don't mess with options personally, however I will margin trade with stocks and trade futures, forex and leverage trade cryptocurrencies.

AUD/USD - Potential Buy Reentry H1 TFTechnical analysis based on Basic BBMA strategies( Bollinger Band and Moving Average). This is just a potential market projection where the market price can go. Trade wisely and good luck.
