POWERGRID – Breakout Setup with Volume Spike📍 Entry Zone: ₹310.10 – ₹311.10
🎯 Target: ₹330.00
🛑 Stoploss: ₹302.00
📈 RSI has crossed above 60, volume confirms breakout momentum (🔵 arrow), and price is supported above key EMAs.
🔍 Strong bullish structure with clear higher lows and a clean breakout candle. Momentum shift confirmed with increasing volume.
For Education Purposes Only
Moving Averages

Gold is Bearish?Hello Folks,
The chart is pretty clear to me that it is bearish:
-Broken Trendline
-Re-test the resistance level
Not financial advice.
Good luck

Best Buy Bounces Toward GapBest Buy has rebounded from last month’s sharp drop, but some traders may expect another push to the downside.
The first pattern on today’s chart is the price zone between $67.16 and $73.28. That matches the bearish price gap on April 3, one day after hefty tariffs were announced.
The electronics retailer’s recent peak has also occurred at its trough last May, which was the low for all of 2024. Has old support become new resistance?
Next, the stochastic oscillator is turning down from an overbought condition.
Third, BBY is near its 21-day exponential moving average. Slipping below it could suggest the short-term direction is getting less bullish.
Finally, the 50-day simple moving average (SMA) had a “death cross” below the 200-day SMA in January and has remained there since. Such an alignment may be consistent with a longer-term downtrend.
TradeStation has, for decades, advanced the trading industry, providing access to stocks, options and futures. If you're born to trade, we could be for you. See our Overview for more.
Past performance, whether actual or indicated by historical tests of strategies, is no guarantee of future performance or success. There is a possibility that you may sustain a loss equal to or greater than your entire investment regardless of which asset class you trade (equities, options or futures); therefore, you should not invest or risk money that you cannot afford to lose. Online trading is not suitable for all investors. View the document titled Characteristics and Risks of Standardized Options at www.TradeStation.com . Before trading any asset class, customers must read the relevant risk disclosure statements on www.TradeStation.com . System access and trade placement and execution may be delayed or fail due to market volatility and volume, quote delays, system and software errors, Internet traffic, outages and other factors.
Securities and futures trading is offered to self-directed customers by TradeStation Securities, Inc., a broker-dealer registered with the Securities and Exchange Commission and a futures commission merchant licensed with the Commodity Futures Trading Commission). TradeStation Securities is a member of the Financial Industry Regulatory Authority, the National Futures Association, and a number of exchanges.
TradeStation Securities, Inc. and TradeStation Technologies, Inc. are each wholly owned subsidiaries of TradeStation Group, Inc., both operating, and providing products and services, under the TradeStation brand and trademark. When applying for, or purchasing, accounts, subscriptions, products and services, it is important that you know which company you will be dealing with. Visit www.TradeStation.com for further important information explaining what this means.

Gold After breaking the downtrend line, the volume zone and the moving averages, we will start buying now.

EUR / GBP We will wait for a close above the moving averages and the volume zone and a breakout of the downtrend line to buy.

BTC | WHY Bitcoin is BULLISH | 2021 Fractal5 reasons why I say BTC is on it's way to a new ATH (All Time High) :
✅1️⃣ Support zone reclaimed
BTC has successfully reclaimed the support zone ABOVE the neckline resistance, a topic that I've been discussing over the past two weeks. If you'll recall, I pointed out either 70k or 90k. We have our answer:
✅2️⃣ Trendlines
Trendlines are BULLISH as BTC continues to make highger lows, a key indication of bullish sentiment even when a pullback is present:
✅3️⃣ Moving Averages
BTC has reclaimed ALL moving averages in the daily, a bullish indication:
✅4️⃣ Trend Based Indicators
A bullish flash in the weekly is a strong sign:
✅5️⃣ Fractal
It's possible that BTC plays out similarly to the previous ATH fractal from 2021:
________________________
BINANCE:BTCUSDT

PEPE | BULLSH | ALT can +150%PEPE seems to have bottomed out after flashing bullish signs on the chart.
Once we close ABOVE the 50 day moving averages (green line) in the weekly timeframe, that's when we'll know the bullish action is full steam:
Make sure you don't miss the update on BTC here:
______________________
BINANCE:PEPEUSDT


Silver sellAfter the price breaks the uptrend line and moving averages and closes below the volume zone, we will enter a sell now.

ADP Challenges ResistanceAutomatic Data Processing has moved sideways since the autumn, and now some traders may think it’s ready to move.
The first pattern on today’s chart is the series of lower highs since early March. The payrolls-processing company closed above that falling trendline on Friday, which may suggest it’s breaking resistance.
Next, prices tested and held their rising 200-day simple moving average (SMA). They’ve also fought back above the 50-day SMA. Those signals may be consistent with long- and intermediate-term uptrends.
Third, the 8-day exponential moving average (EMA) just crossed above the 21-day EMA. MACD also turned positive. Those signals may be consistent with short-term bullishness.
Finally, ADP’s results and guidance beat estimates on April 30. The resulting bullish outside candle could also suggest buyers are taking charge.
TradeStation has, for decades, advanced the trading industry, providing access to stocks, options and futures. If you're born to trade, we could be for you. See our Overview for more.
Past performance, whether actual or indicated by historical tests of strategies, is no guarantee of future performance or success. There is a possibility that you may sustain a loss equal to or greater than your entire investment regardless of which asset class you trade (equities, options or futures); therefore, you should not invest or risk money that you cannot afford to lose. Online trading is not suitable for all investors. View the document titled Characteristics and Risks of Standardized Options at www.TradeStation.com . Before trading any asset class, customers must read the relevant risk disclosure statements on www.TradeStation.com . System access and trade placement and execution may be delayed or fail due to market volatility and volume, quote delays, system and software errors, Internet traffic, outages and other factors.
Securities and futures trading is offered to self-directed customers by TradeStation Securities, Inc., a broker-dealer registered with the Securities and Exchange Commission and a futures commission merchant licensed with the Commodity Futures Trading Commission). TradeStation Securities is a member of the Financial Industry Regulatory Authority, the National Futures Association, and a number of exchanges.
TradeStation Securities, Inc. and TradeStation Technologies, Inc. are each wholly owned subsidiaries of TradeStation Group, Inc., both operating, and providing products and services, under the TradeStation brand and trademark. When applying for, or purchasing, accounts, subscriptions, products and services, it is important that you know which company you will be dealing with. Visit www.TradeStation.com for further important information explaining what this means.

MACD: More Than Just a Crossover ToolHello, traders! 🔥
The MACD (Moving Average Convergence Divergence) indicator is one of the most trusted tools in technical analysis — but often one of the most oversimplified. While many traders focus on signal line crossovers, the real power of MACD lies in its ability to visualize market momentum, subtle shifts in trend strength, and early signs of potential reversals.
Let’s unpack how MACD behaves using the weekly BTC/USDT chart ✍🏻.
🔧 Understanding the Mechanics
At its core, MACD is the difference between two exponential moving averages — typically the 12-period EMA and the 26-period EMA. The result is the MACD line (blue). The orange line represents a 9-period Exponential Moving Average (EMA) of the MACD line, commonly referred to as the signal line. The histogram reflects the distance between them, helping to visualize when momentum is building or fading.
📊 MACD in Action — Weekly BTC Chart Breakdown
Looking at the BTC/USDT weekly chart, several notable MACD behaviors stand out:
1. The Bullish Acceleration in Early 2023
In early 2023, MACD crossed above the signal line, accompanied by a sharp rise in the histogram. This indicated strong positive momentum, as the price began recovering from the 2022 lows. The histogram’s expansion confirmed increasing divergence between the short- and long-term EMAs — a classic sign of trend acceleration.
2. Peak Momentum in Late 2023
Around late 2023, the MACD line peaked while the histogram also reached maximum height. This wasn’t just a confirmation of strength — it also hinted that momentum may have reached a climax. Despite price continuing to rise slightly, the MACD curve started to flatten — an early warning of potential exhaustion in trend strength.
3. Bearish Convergence into Q1 2025
In early 2025, the MACD line turned downward and eventually crossed below the signal line, while the histogram flipped to red. This reflected a cooldown in bullish momentum rather than an immediate reversal. What’s notable is how price didn’t collapse sharply, but moved into a pullback phase — illustrating how MACD can show momentum softening before price visibly reacts.
📌 What This Can Tells Us
The MACD indicator on this weekly BTC chart shows how momentum often shifts before the trend itself breaks. Each crossover, divergence, or histogram change is not a guarantee, but a cue to pay closer attention.
Key takeaways:
Strong Histogram Expansion = Confidence in the Current Move.
Peaks in MACD Without Price Making New Highs = Potential Divergence.
Shrinking Histogram + Converging Lines = Momentum Stalling.
🧠 Final Thought
MACD isn’t just about “buy when it crosses” or “sell on red bars.” It’s a narrative tool, showing how the story of the price develops beneath the surface. On higher timeframes, such as the weekly chart, it can potentially highlight macro momentum shifts long before they become apparent in price action alone.

Using Moving Averages Like a ChaseHow Institutions May Be Using Moving Averages to Align Technicals with Fundamentals
Are moving averages just for retail traders and chart watchers? Not if you're JPMorgan Chase.
While many associate moving averages (MAs) with simple trading strategies, institutional giants like JPMorgan Chase likely use them very differently. Instead of relying on MAs to chase trends, they may use them as confluence tools—where technical signals meet macroeconomic insight, risk models, and long-term strategy.
Here’s how JPMorgan might be using moving averages across their medium- to long-term investments—and what you can learn from it.
📊 1. Moving Averages as Investment Benchmarks
At the institutional level, MAs aren’t just "buy/sell" triggers. JPMorgan likely treats the 50-day and 200-day moving averages as dynamic references that help answer broader questions:
Is this trend aligned with the macro picture?
Is this a real shift, or just short-term volatility?
How do fund flows behave around these levels?
Rather than acting on the average itself, JPMorgan probably uses it to validate investment theses and smooth out the noise.
⚙️ 2. Confluence: Where Technicals and Fundamentals Align
In large portfolios, confluence is king. It’s not just about one indicator—but about multiple factors aligning to strengthen conviction.
MAs might be used alongside:
Macro trends (GDP growth, inflation, interest rates)
Sector momentum (e.g. financials vs. tech rotation)
Earnings growth and valuation models
Liquidity flows and volatility data
When a stock reclaims its 200-day MA and fundamentals improve, that’s a green light. When everything lines up, JPMorgan can move with more confidence.
📈 3. A Probabilistic (Not Predictive) Approach
Institutions don’t deal in absolutes—they deal in probabilities. JPMorgan’s quant teams likely test how often certain MA setups lead to favorable outcomes under different market regimes.
So instead of reacting to a crossover, they may ask:
"How often does this setup succeed, given current economic conditions?"
If the odds are strong, they’ll scale in. If not, they’ll wait or hedge. It’s a measured, data-driven approach to timing.
🛡️ 4. Risk Management and Strategic Timing
Moving averages are also incredibly useful for managing portfolio risk. They offer:
Clarity in volatile markets
Timing cues for rebalancing
Visual structure for entries/exits
MAs help JPMorgan place guardrails around long-term positions—keeping strategy in check while avoiding overreactions to noise.
🔍 Final Thought: JPMorgan Isn’t Chasing Trends—They’re Refining Them
The lesson for investors? Don’t treat moving averages as magic lines. Used well, they become tools of confirmation and control, not prediction.
For JPMorgan Chase, MAs are likely just one piece of a much larger puzzle—blending technicals with fundamentals, data science, and market context to execute with precision.
💡 Pro Tip: You can apply the same idea to your own strategy—use moving averages to validate your thesis, not to drive it. Confluence is the key.

Why I'm not holding Tesla Tesla was dropping! I got in at around 220. However, within three weeks, I sold for a small profit.
BUT, why did I sell? This is why I'm not holding NASDAQ:TSLA
It's time to buy!
From a technical and historical point of view, buying Tesla right now makes perfect sense. The stock has a history of making significant price gains, is currently oversold, and is testing key support areas, such as the monthly 50 SMA.
A trader or investor who is 100% technical-based, this stock looks like a dream.
However, all the hype hits the floor when the fundamentals are considered...
Meh...
✔ The company has been increasing sales and cash year-on-year until recently
✔ Tesla has plenty of cash and assets. A simple acid test ratio shows liabilities vs. assets around 1:2.
❌ The issue is profit. Both gross and net profit margins have been falling year-on-year. The net profit margin is down from 15% two years ago to 7% last year.
❌ Worse, the current forecasts predict decreased sales and other key financials.
Poor and worsening financials are a clear red flag when buying stocks. Stay away. No matter how appealing the price looks.
Don't get me wrong, I don't think Tesla is doomed, and it may still yield returns. However, I would not be surprised if the stock consolidates or moves lower from here. For me, Tesla is not the significant buy it once was.

Bitcoin MAsAfter a good rally bitcoin had 2 weeks age, now still managing and staying above 20MA for weekly, which is really bullish to me

Aussie Perks Up As Asia NapsAUD/USD closed last week at the highest level of 2025 and has extended the move today, pushing above the key 200-day moving average. The rally coincides with further strength in the offshore-traded Chinese yuan, which also finished last week at 2025 highs against the U.S. dollar.
While the price action is undeniably bullish—mirrored by strengthening momentum indicators—light turnover due to holidays across much of Asia warrants caution. The European open may offer a clearer read on whether this break above the 200DMA will stick.
If there’s no immediate reversal during European trade, traders may consider establishing longs with a tight stop below the 200DMA, targeting resistance near .6550. Alternatively, a move back beneath the 200DMA—echoing Friday’s reversal—could open the door for shorts, with uptrend support around .6370 and the 50DMA below that as possible downside targets.
Good luck!
DS

GBP / USD Waiting for the breakout of the rising trend line and the close below the volume zone to enter the sell position.

TSLA Drill Team is Back
Against the background of everything that is happening, from a fundamental point of view, Tesla is facing significant headwinds as we approach its Q1 2025 earnings.
A 13% year-over-year decline in deliveries, ongoing margin pressures from price cuts, and negative consumer sentiment tied to Elon Musk’s political involvement are weighing on the company.
While the energy segment and potential updates on the affordable vehicle could provide some upside, the risk of a disappointing earnings report looms large, potentially exacerbating Tesla’s challenges in a competitive EV market.
Technically
We see that the price is consolidating near the lower boundary of the golden pocket on the FIBO channel on the 1-hour chart. For a few days now, the price has been holding just above the 240.00 support level, but the bearish trend remains dominant with 23 out of 26 technical indicators signaling bearish sentiment as of April 20, 2025.
Entry SHORT around 240$ targeting 220$
Post-earnings, we could see a breakdown below 220.00, targeting the next support at 216.00, from which the future prospects will depend.
Resistance levels: 270, 250, 240
Support levels: 220, 216, 210
The price is struggling to break above the resistance, consolidating over days. With earnings on Tuesday, there’s a high probability of a breakdown if the report misses expectations or lacks clear guidance on growth initiatives.
A break and consolidation below 230.00 could lead to a decline toward 220.00 or even 210.00 in the coming week.
However, if Tesla surprises positively—particularly with strong energy segment growth or clarity on the affordable vehicle—we might see a reversal. Still, the current setup suggests caution, and we’ll need to monitor the price reaction closely post-earnings.
Keep your long term vision NASDAQ:TSLA

ALPHA Structure Analysis - 50-day EMA breakoutYesterday, BINANCE:ALPHAUSDT cleanly broke and closed above the 50-day EMA, which it hadn't been able to reclaim since December 2024. It also retested the previous $0.042-$0.052 demand zone, which acted as resistance.
Check the weekly chart below for more context:
Key Levels
• $0.024-$0.034: Main demand zone, dating back to October 2020
• $0.042-$0.052: Previous demand zone and current resistance
• ~$0.070: Previous key S/R, currently reinforced by 1-year EMA, and potential resistance
• $0.115-$0.137: Main supply zone
Trigger
I am looking for a retest of the 50-day EMA (~0.035) as support for a long entry, with a clear invalidation below the recent $0.025 swing low, targeting the main supply zone with the other key levels outlined above as partial TP targets.

Berkshire Hathaway Stock Quote | Chart & Forecast SummaryKey Indicators On Trade Set Up In General
1. Push Set Up
2. Range Set up
3. Break & Retest Set Up
Notes On Session
# Berkshire Hathaway Stock Quote
- Double Formation
* (Anchored VWAP)) | Completed Survey
* Wave Feature & Ongoing Wave (3)) | Subdivision 1
- Triple Formation
* (Uptrend Argument)) At 510.00 USD | Subdivision 2
* (TP1) | Subdivision 3
* Daily Time Frame | Trend Settings Condition
- (Hypothesis On Entry Bias)) | Regular Settings
- Position On A 1.5RR
* Stop Loss At 512.00 USD
* Entry At 540.00 USD
* Take Profit At 585.00 USD
* (Uptrend Argument)) & No Pattern Confirmation
* Ongoing Entry & (Neutral Area))
Active Sessions On Relevant Range & Elemented Probabilities;
European-Session(Upwards) - East Coast-Session(Downwards) - Asian-Session(Ranging)
Conclusion | Trade Plan Execution & Risk Management On Demand;
Overall Consensus | Buy

Thales Group Stock Quote | Chart & Forecast SummaryKey Indicators On Trade Set Up In General
1. Push Set Up
2. Range Set up
3. Break & Retest Set Up
Notes On Session
# Thales Group Stock Quote
- Double Formation
* Start Of (Anchored VWAP)) At 55.00 EUR | Completed Survey
* VWAP Feature At 125.00 EUR On Long Bias Entry | Subdivision 1
- Triple Formation
* (EMA Settings)) - Uptrend & Retest | Subdivision 2
* (TP1) | Subdivision 3
* Daily Time Frame | Trend Settings Condition
- (Hypothesis On Entry Bias)) | Regular Settings
- Position On A 1.5RR
* Stop Loss At 228.00 EUR
* Entry At 253.00 EUR
* Take Profit At 290.00 EUR
* (Uptrend Argument)) & No Pattern Confirmation
* Ongoing Entry & (Neutral Area))
Active Sessions On Relevant Range & Elemented Probabilities;
European-Session(Upwards) - East Coast-Session(Downwards) - Asian-Session(Ranging)
Conclusion | Trade Plan Execution & Risk Management On Demand;
Overall Consensus | Buy

Iluka Resources Stock Quote | Chart & Forecast SummaryKey Indicators On Trade Set Up In General
1. Push Set Up
2. Range Set up
3. Break & Retest Set Up
Notes On Session
# Iluka Resources Stock Quote
- Double Formation
* Wave Feature - Wave (3)) Ongoing | Completed Survey
* ((No Trade)) & Invalid Structure | Subdivision 1
- Triple Formation
* (Downtrend Argument)) | Subdivision 2
* (TP1) | Subdivision 3
* Daily Time Frame | Trend Settings Condition
- (Hypothesis On Entry Bias)) | Indexed To 100
- Position On A 1.5RR
* Stop Loss At 60.00 AUD
* Entry At 58.00 AUD
* Take Profit At 52.00 AUD
* (Downtrend Argument)) & No Pattern Confirmation
* Ongoing Entry & (Neutral Area))
Active Sessions On Relevant Range & Elemented Probabilities;
European-Session(Upwards) - East Coast-Session(Downwards) - Asian-Session(Ranging)
Conclusion | Trade Plan Execution & Risk Management On Demand;
Overall Consensus | Sell

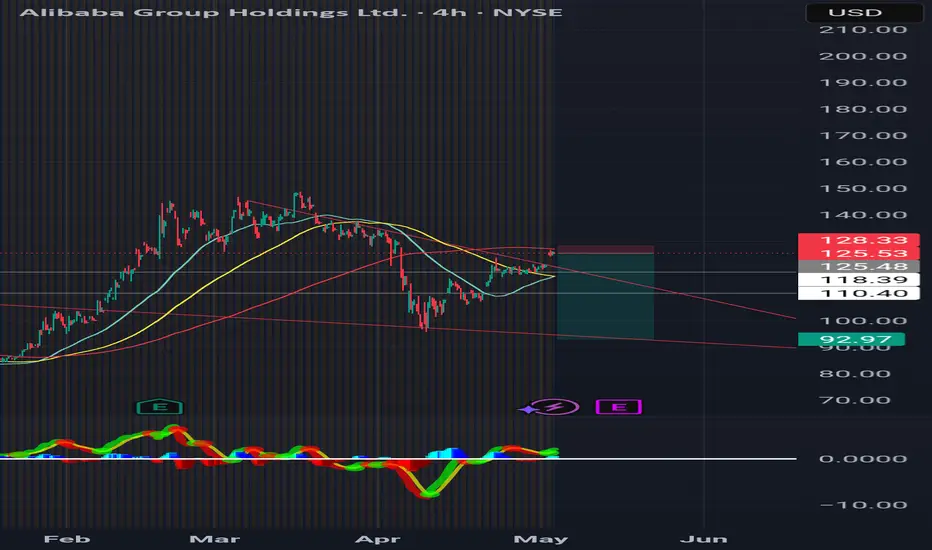
Cooked I don't think it would actually go this low into the wedge but if it chatches the moving averages then rejects I would hold other wise just a retest of support im guessing since they came in under last three quarters it'll be more pain. Plus US lawmakers want it delisted for "national security". No beuno.
$100k Bitcoin IMMINENT? Price Ignites After Major Surge!The cryptocurrency market is once again crackling with energy, and at the heart of the storm stands Bitcoin (BTC). The world's largest and original cryptocurrency is staging a remarkable comeback, shattering recent resistance levels and reigniting fervent speculation about its potential to not only revisit but decisively conquer the psychologically potent $100,000 milestone. Following a period of consolidation and downward pressure, a powerful surge has propelled Bitcoin to its highest price point in over ten weeks, signaling a potential paradigm shift in market sentiment and trading behavior.
The Breakout: Shaking Off Recent Slumber
The recent price action has been decisive. Bitcoin climbed as much as 3.1% to achieve a weekly high of $97,483. This marks the most robust price level observed since February 21st, representing a significant break from the sideways and sometimes downward trajectory that characterized parts of the preceding weeks. The memory of Bitcoin crossing the $100,000 threshold on February 7th is still fresh, adding weight to the current push towards that level.
This upward momentum provides a stark contrast to the market conditions seen earlier. There is downward pressure attributed to geopolitical factors and economic policies, such as potential tariff implementations, which had previously triggered sell-offs impacting both traditional stock markets and the digital asset space. Furthermore, the market had to digest a significant correction following Bitcoin's earlier peak. While the specifics of past peaks can be debated based on different exchange data, the narrative of a significant pullback followed by the current strong recovery is clear. Bitcoin weathered a period where it seemed momentum might stall, but the bulls have evidently returned with renewed vigor.
Shifting Market Dynamics: From Macro-Driven to Momentum-Fueled
Perhaps one of the most crucial insights from the current rally is the apparent shift in what's driving price action. For much of the past year or two, Bitcoin's price movements often seemed heavily correlated with macroeconomic factors – inflation data releases, central bank interest rate decisions, geopolitical tensions, and regulatory pronouncements. While these factors undoubtedly still play a role, the current surge suggests a transition towards a market more heavily influenced by internal dynamics: spot market demand and trading momentum.
There are traders who are increasingly reacting to price action itself, buying into strength and potentially creating a self-reinforcing cycle. The focus is less on predicting the next Federal Reserve move and more on the immediate supply and demand dynamics visible on exchanges.
Bitcoin isn't entirely decoupled from macro trends, but its internal market structure, particularly the influence of new financial instruments like ETFs and strong spot buying, is asserting greater influence on short-to-medium term price discovery.
The ETF Factor: Opening the Floodgates for Capital
The launch and subsequent success of spot Bitcoin ETFs in the United States have been a game-changer, and their impact is arguably a primary catalyst for the current bullishness. These regulated investment vehicles provide traditional investors and institutions with a familiar and accessible way to gain exposure to Bitcoin without directly holding the underlying asset. The result has been a torrent of new capital flowing into the market.
There has been a staggering inflow of over $3.2 billion entering Bitcoin and Ethereum tracking ETFs in the preceding week alone. BlackRock's Bitcoin Trust ETF (IBIT), a major player in the space, recorded nearly $1.5 billion in inflows during that period, marking its highest weekly intake for the year according to Bloomberg data.
These inflows are not just numbers on a spreadsheet; they translate directly into buying pressure in the spot market. ETF issuers must purchase actual Bitcoin to back the shares they issue to investors. This sustained, large-scale buying provides a powerful tailwind for the price, absorbing sell orders and driving the market upwards. The success of these ETFs also lends legitimacy to Bitcoin as an asset class, potentially encouraging further adoption and investment from previously hesitant institutional players. The "demand" aspect of the current rally is heavily underpinned by this ongoing ETF phenomenon.
Options Market Signals: Betting Big on $100,000
Further evidence of the bullish sentiment surrounding Bitcoin, particularly the $100,000 target, comes from the derivatives market, specifically options trading. Options contracts give traders the right, but not the obligation, to buy (call option) or sell (put option) an asset at a specific price (strike price) before a certain expiration date.
According to data from Coinglass and the major crypto options exchange Deribit, demand for upside options has surged. Notably, call options with a $100,000 strike price exhibit the most significant open interest across various expiration dates. Open interest represents the total number of outstanding contracts that have not yet been settled. High open interest in $100k call options indicates that a large number of traders are positioning themselves to profit from Bitcoin reaching or exceeding this level. While options data reflects expectations rather than guarantees, such concentrated betting on a specific upside target underscores the powerful psychological pull of the $100k mark and the conviction held by a significant segment of the market.
Warming Up: Reading the Technical and On-Chain Pre-Rally Signals
Beyond the ETF flows and options market sentiment, analysts are pointing to various technical and on-chain indicators suggesting Bitcoin is indeed "warming up" for a potentially larger move, exhibiting signals seen before previous major breakouts. This aligns with the theme of "Bitcoin Flashing Pre-Rally Signals Seen Before Major 2024 Breakouts."
• Technical Analysis:
o Breaking Resistance: The surge above the 10-week high ($97,483) was a critical technical breakout, overcoming a level that had previously capped price advances. Holding above this level turns former resistance into potential support.
o Moving Averages: Traders watch moving averages closely. A "Golden Cross" (where a shorter-term moving average, like the 50-day, crosses above a longer-term one, like the 200-day) is often considered a strong long-term bullish signal. While specific configurations vary, bullish alignment of key moving averages often precedes sustained rallies.
o Momentum Indicators: Indicators like the Relative Strength Index (RSI) and Moving Average Convergence Divergence (MACD) can signal building momentum. An RSI breaking above key levels without yet reaching extremely overbought territory, or a bullish MACD crossover, can suggest further upside potential.
o Volume Confirmation: Crucially, significant price breakouts should ideally be accompanied by strong trading volume, indicating conviction behind the move. Analysts look for volume confirmation to validate the strength of the rally.
• On-Chain Analysis: On-chain data provides insights into the behavior of Bitcoin holders and network activity.
o Exchange Outflows: Sustained periods where more Bitcoin is withdrawn from exchanges than deposited often suggest investors are moving coins to private wallets for long-term holding ("HODLing"), reducing the immediately available supply for sale.
o Accumulation Trends: Metrics tracking the behavior of large holders ("whales") and long-term holders can reveal accumulation patterns. Increased buying from these cohorts is typically seen as bullish.
o Supply Dynamics: Indicators looking at the supply held by short-term versus long-term holders, or metrics like the Long-Term Holder Spent Output Profit Ratio (LTH-SOPR), can gauge whether significant profit-taking is occurring that could stall a rally. A low LTH-SOPR might suggest long-term holders are not yet selling aggressively.
o Funding Rates: In the perpetual futures market, positive funding rates generally indicate that traders holding long positions are paying those holding short positions, suggesting a bullish bias in the derivatives space.
When multiple technical and on-chain indicators align, as some analysts suggest is happening now, it builds a stronger case that the market is preparing for a significant move, lending credence to the "pre-rally signals" narrative.
Mapping the Path to $100k and Beyond: Three Potential Scenarios
While the current momentum is palpable, the path forward is never certain. Analysts are mapping various possibilities, acknowledging both the bullish potential and the inherent risks. Here are three broad scenarios that could unfold:
1. The Momentum Continuation Scenario: Fueled by continued strong ETF inflows, positive market sentiment amplified by the $100k narrative, and potentially favorable (or at least neutral) macroeconomic developments, Bitcoin continues its ascent relatively unimpeded. It decisively breaks the $100,000 barrier, potentially triggering a wave of Fear Of Missing Out (FOMO) from retail investors and further institutional interest. In this scenario, the market quickly looks towards higher targets, exploring price discovery in uncharted territory above $100k (or above its previous ATH depending on the data source used). Key challenges would be maintaining buying pressure and overcoming psychological resistance levels beyond $100k.
2. The Consolidation and Recharge Scenario: Bitcoin's rally meets significant resistance near or just below the $100,000 level. Profit-taking increases, and early ETF buyers might look to secure gains. Instead of a sharp rejection, the price enters a period of consolidation – trading sideways within a defined range or experiencing a moderate pullback. This phase allows the market to digest recent gains, build a stronger base of support (potentially around the recent breakout level near GETTEX:97K or slightly lower), and allows moving averages to catch up. If support holds and buying demand re-emerges (perhaps triggered by fresh ETF inflows or positive news), this consolidation could form the launchpad for the next sustained leg up towards and beyond $100k. This scenario tests the resilience of the buyers.
3. The Macro Headwind or Correction Scenario: Despite the strong internal dynamics, external factors reassert control. An unexpected negative catalyst emerges – perhaps significantly worse-than-expected inflation data forcing a hawkish central bank response, a major geopolitical escalation, unforeseen regulatory action against crypto, or a sharp downturn in traditional markets triggering widespread risk-off sentiment. Alternatively, the rally could simply run out of steam, hitting a "sell wall" at $100k that overwhelms buying pressure, leading to a sharper correction back towards lower support levels ($90k, $85k, or even lower). This scenario underscores the ever-present volatility and risk in the crypto market, reminding investors that parabolic runs can face abrupt reversals.
The Crucial Question: Can BTC Buying Demand Meet the Challenge?
Ultimately, whether Bitcoin successfully retests and surpasses $100,000 hinges on the sustainability of the current buying demand. Several factors support continued demand:
• Ongoing ETF Flows: As long as institutions and retail investors continue allocating capital to spot Bitcoin ETFs, this provides a consistent source of buying pressure.
• Growing Adoption Narrative: Each price surge and new institutional product launch reinforces the narrative of Bitcoin's growing acceptance and potential role as a store of value or portfolio diversifier.
• Halving Effect (Long-Term): While the Bitcoin Halving (reduction in new supply issuance) is a past event, its long-term supply-constricting effects are believed by many to contribute to price appreciation over time.
• Potential Retail FOMO: A decisive break above $100k could capture mainstream media attention and trigger a wave of buying from retail investors fearing they might miss out on further gains.
However, potential headwinds exist:
• Profit-Taking: Investors who bought at lower levels, including early ETF participants, may look to lock in substantial profits as the price approaches major milestones.
• Regulatory Uncertainty: While ETFs marked progress, the broader regulatory landscape for crypto remains complex and subject to change globally.
• Macroeconomic Risks: Inflation, interest rates, and potential recessionary fears haven't disappeared and could resurface to dampen risk appetite.
• Market Saturation/Exhaustion: Rallies can lose momentum if buying power becomes exhausted without fresh catalysts.
The interplay between these forces will determine if the current buying wave has the strength and endurance to overcome sell pressure and propel Bitcoin into six-figure territory sustainably.
Conclusion: A Critical Juncture for Bitcoin
Bitcoin stands at a fascinating and potentially pivotal juncture. The recent surge, breaking a 10-week high and pushing towards the $100,000 horizon, is fueled by a powerful combination of factors unlike those seen in previous cycles. The institutional validation and massive capital inflows brought by spot Bitcoin ETFs represent a fundamental shift, seemingly driving a transition towards momentum and spot-demand-based trading. Bullish signals from the options market and various technical/on-chain indicators add fuel to the fire, painting a picture of a market "warming up" for potentially significant further gains.
Yet, the path to $100,000 and beyond is fraught with challenges. Market history teaches that parabolic advances often face corrections, and the ever-present risks of macroeconomic shifts and regulatory developments cannot be ignored. The sustainability of the current buying frenzy, particularly the crucial ETF inflows, will be rigorously tested as Bitcoin confronts the immense psychological and technical resistance clustered around the six-figure mark.
Whether Bitcoin achieves a swift breakout, undergoes a period of consolidation, or faces a pullback remains to be seen. However, the current price action and underlying market dynamics have undeniably reignited excitement and placed the $100,000 target firmly back in the spotlight, marking a critical chapter in Bitcoin's ongoing evolution within the global financial ecosystem. Investors and observers alike will be watching intently to see if the current surge has the power to meet the demand challenge and etch a new all-time high into the history books.
Disclaimer: The information presented in this article is for informational and educational purposes only. It is based on the analysis of the provided source material and general market knowledge. It does not constitute financial advice. Investing in cryptocurrencies involves significant risk, including the potential loss of principal. Readers should conduct their own thorough research and consult with a qualified financial advisor before making any investment decisions.
