Moving Averages

How To Filter Signals On The 1 Minute Scalping IndicatorThis tutorial shows you how to use external indicators to filter out signals on the 1 Minute Scalping Indicator so that you only get signals that are in the direction of the trend.
Step By Step Process:
1. Pick an external indicator that provides an output value of 1 for bullish, -1 for bearish or 0 for neutral and add it to your chart. We have multiple indicators that can do this, but you can also customize your own indicators to provide this value and use that to filter out signals.
2. Set your desired trend parameters on your external indicator and make sure that indicator is on the same chart as the 1 Minute Scalping Indicator.
3. Go to the indicator settings for the 1 Minute Scalping Indicator and turn on one of the 3 available External Indicator Filters. Then from the dropdown menu, select the external indicator you want to use and make sure to choose the output value that gives the 1, -1 or 0 output for trends. Our indicators will have an output titled "Trend Direction To Send To External Indicators" to make that value easy to find in the dropdown menus.
That's it! Let the 1 Minute Scalping Indicator reload with the external indicator trend values and it will only show buy signals during bullish trends, only show sell signals during bearish trends or no signals during neutral markets. Make sure to back test your setup until you find the best external indicators and settings to use that work best for your trading style and then apply that setup to any chart you would like.
Here is the code you can use to add a trend value to your own custom indicators and send it to the 1 Minute Scalping Indicator:
trendDirection = 0
if close > ema1
trendDirection := 1
else if close < ema1
trendDirection := -1
else
trendDirection := 0
plot(trendDirection, title="Trend Direction To Send To External Indicators", color=#00000000, display=display.data_window)
Change the (close > ema1) and (close < ema1) to use your own variables from within your script.

TOTAL2 / BTC - Majority of Alts Look BearishDon't shoot the messenger, but the MAJORITY of your Alts need to NUKE ~25% before Alt Season 🫨
This lines up with prior cycle support before Alt Season blastoff.
First step is to reclaim the EMA9, which they have failed to against BTC.
The lack of buying Volume supports this thesis for the trend to continue downwards.

COCHINSHIP :NSE TRENDLINE BO DTF/WTF POSITIONAL NEW Stock Analysis
Trade Plan:
Entry: 1580 50% of the total quantity at DTF Close, with an additional 50% added at 2130 DTF Close Price.
Stop Loss: 1340
Target 1: 2100
Target 2: 3000
Hold for a period of 6 months to 1 year or until the target 2 is reached.
Chart Pattern:
The stock experienced A BULL RUN FOR 6MONTHS period to touch an all-time high (ATH) of 2999 . A CONSIDERABLE PULL BACK FOR A MONTH AND NOW
Technical Indicators:
The stock’s daily timeframe (DTF) shows that the price is trading TODAY above the 50-day exponential moving average (EMA) and the 50-day EMA above the 200DEMA. The EMAs are in Ascending sequence of alignment. A potential bullish trend in formation on the DTF/WTF timeframe. The 20 DMA has turned upwards starting a bullish reversal and is below the 200DMA indicating an Early Entry
Volume Analysis:
There has been a gradual drying up of volumes on the sell side. There is buying in the past 4 days above the 20VMA. Price Breakout has been done yesterday and retest today take entry as recommended in Trade Plan.
Prioritize Watch List:
Keep this stock in your watch list for further analysis and potential trading opportunities.
Disclaimer: This information is solely for educational and reference purposes. Trading inherently carries risks, and it’s crucial to exercise caution and conduct comprehensive research before making any investment decisions. Make sure you have a well-defined risk appetite, proper position sizing, and a stop-loss order based on your risk tolerance. Review your Portfolio periodically. Exit positions when the price closes 7-8% below your entry point or Earlier basis your Risk profile. Consider re-entering the market when the trend reverses.Before engaging in any trading activities, it is paramount to thoroughly comprehend these technical analysis concepts and conduct extensive research on the stocks you are interested in. Furthermore, consulting a certified financial advisor can offer valuable insights and guidance before making investment decisions.
Technical Analysis Concepts:
Multiple Time Frame Analysis (MTFA):
Daily Time Frame (DTF): Used for short-term analysis and identifying trends.
Weekly Time Frame (WTF): Provides a broader perspective and helps in trend confirmation.
Monthly Time Frame (MTF): Ideal for long-term analysis and trend analysis.
All-Time High (ATH): The highest price reached on a specific chart.
Lifetime High (LTH): The highest price reached over the entire chart’s history.
Stop Loss (SL): A predetermined price level at which an investment is automatically exited to limit potential losses.
Swing Trade: A trading strategy that involves holding positions for a significant period, typically few weeks to months.
Positional Trade: A trading strategy that aims to capitalize on long-term trends and position oneself accordingly.
CHART PATTERNS
Rounding Bottom Cup/Handle (RBC&H): A pattern that signals a potential reversal from a downtrend.
Breakout (BO): A price move closure above a resistance or below a support level.
Flag & Pole BO: (F&P BO) Bullish Continuation Pattern
Consolidation : Price Typically Swings between a Range for a period of Time Long or Short basis the MTFA. Breaking out of this range UPWARDS is an opportunity to BUY and DOWNWARDS is SELL opportunity.
Moving Averages:
Exponential Moving Average (EMA): A popular moving average that places more weight on recent price data.
Volume-Weighted Moving Average (VWMA): A moving average that gives more weight to high-volume stocks.
Fibonacci Retracement/Extension:
Trend-based Fibonacci Retracement: Used to identify potential support and resistance levels during re-tracements.
Trend-based Fibonacci Extension: Used to identify potential breakout levels during extensions.

SCI NSE Bearish channel BO WTF NEW Stock Analysis
Trade Plan: SCI
Entry: 50% of the total quantity at 243 DTF Close, with an additional 50% added at 274 DTF Close Price.
Stop Loss: 203
Target 1: 345
Target 2: NA
Hold for a period of 11 months to 1 year or until the target 1 is reached.
Chart Pattern:
The stock experienced a Pullback period of 5Months after touching an all-time high (ATH) of 383 .
Technical Indicators:
The stock’s daily timeframe (DTF) shows that the price is currently trading above the 50-day exponential moving average (EMA) and the 20-day EMA below the 50EMA. The EMAs are in Transitional sequence of alignment. The Stock is at good price point where the 50EMA and 200EMA are very close and the 20EMA has curved upwards.A potential bullish trend in formation on the DTF/WTF timeframe.
Volume Analysis:
There has been a surge up of volumes on the buy side for a Month now. Take entry as recommended in Trade Plan.
Prioritize Watch List:
Keep this stock in your watch list for further analysis and potential trading opportunities.
Disclaimer: This information is solely for educational and reference purposes. Trading inherently carries risks, and it’s crucial to exercise caution and conduct comprehensive research before making any investment decisions. Make sure you have a well-defined risk appetite, proper position sizing, and a stop-loss order based on your risk tolerance. Review your Portfolio periodically. Exit positions when the price closes 7-8% below your entry point or Earlier basis your Risk profile. Consider re-entering the market when the trend reverses.Before engaging in any trading activities, it is paramount to thoroughly comprehend these technical analysis concepts and conduct extensive research on the stocks you are interested in. Furthermore, consulting a certified financial advisor can offer valuable insights and guidance before making investment decisions.
Technical Analysis Concepts:
Multiple Time Frame Analysis (MTFA):
Daily Time Frame (DTF): Used for short-term analysis and identifying trends.
Weekly Time Frame (WTF): Provides a broader perspective and helps in trend confirmation.
Monthly Time Frame (MTF): Ideal for long-term analysis and trend analysis.
All-Time High (ATH): The highest price reached on a specific chart.
Lifetime High (LTH): The highest price reached over the entire chart’s history.
Stop Loss (SL): A predetermined price level at which an investment is automatically exited to limit potential losses.
Swing Trade: A trading strategy that involves holding positions for a significant period, typically few weeks to months.
Positional Trade: A trading strategy that aims to capitalize on long-term trends and position oneself accordingly.
CHART PATTERNS
Rounding Bottom Cup/Handle (RBC&H): A pattern that signals a potential reversal from a downtrend.
Breakout (BO): A price move closure above a resistance or below a support level.
Flag & Pole BO: (F&P BO) Bullish Continuation Pattern
Consolidation : Price Typically Swings between a Range for a period of Time Long or Short basis the MTFA. Breaking out of this range UPWARDS is an opportunity to BUY and DOWNWARDS is SELL opportunity.
Moving Averages:
Exponential Moving Average (EMA): A popular moving average that places more weight on recent price data.
Volume-Weighted Moving Average (VWMA): A moving average that gives more weight to high-volume stocks.
Fibonacci Retracement/Extension:
Trend-based Fibonacci Retracement: Used to identify potential support and resistance levels during re-tracements.
Trend-based Fibonacci Extension: Used to identify potential breakout levels during extensions.

GREAVESCOT NSE 2Y11M RBCUP BO WTF -SWING/POSITIONAL Stock Analysis
Trade Plan:
Entry: 50% of the total quantity at 260 DTF Close, with an additional 50% added at 294 DTF Close Price.
Stop Loss: 228
Target 1: 312
Target 2: 341, TGT3 : 395
Hold for a period of 9 months to 2 year or until the target 3 is reached.
Chart Pattern:
The stock has formed a Rounding Bottom Cup in a time of THREE Years, there has been a Steady Bullish Copybook rise for the past 6months with a considerable volume buying
Technical Indicators:
The stock’s daily timeframe (DTF) shows that the price is currently trading above the 50-day exponential moving average (EMA) and the 20-day EMA above the 50D EMA. This indicates an Ascending phase of alignment in the stock’s EMA. A bullish trend in formation on the DTF/WTF timeframe.
Additionally, the current price is near the 23.6% Fibonacci Extension level. This level could serve as a potential entry point for investors, depending on their risk tolerance. More cautious investors might consider entering above the 38.2% retracement level.
Volume Analysis:
There has been a consistent buying volumes for a Month now. There is buying in the past. weeks are above the 20VMA.
Prioritize Watch List:
Keep this stock in your watch list for further analysis and potential trading opportunities.
Disclaimer: This information is solely for educational and reference purposes. Trading inherently carries risks, and it’s crucial to exercise caution and conduct comprehensive research before making any investment decisions. Make sure you have a well-defined risk appetite, proper position sizing, and a stop-loss order based on your risk tolerance. Review your Portfolio periodically. Exit positions when the price closes 7-8% below your entry point or When 9EMA crosses Below 21EMA in DTF. Earlier too basis your Risk profile. Consider re-entering the market when the trend reverses.Before engaging in any trading activities, it is paramount to thoroughly comprehend these technical analysis concepts and conduct extensive research on the stocks you are interested in. Furthermore, consulting a certified financial advisor can offer valuable insights and guidance before making investment decisions.
Technical Analysis Concepts:
Multiple Time Frame Analysis (MTFA):
Daily Time Frame (DTF): Used for short-term analysis and identifying trends.
Weekly Time Frame (WTF): Provides a broader perspective and helps in trend confirmation.
Monthly Time Frame (MTF): Ideal for long-term analysis and trend analysis.
All-Time High (ATH): The highest price reached on a specific chart.
Lifetime High (LTH): The highest price reached over the entire chart’s history.
Stop Loss (SL): A predetermined price level at which an investment is automatically exited to limit potential losses.
Swing Trade: A trading strategy that involves holding positions for a significant period, typically few weeks to months.
Positional Trade: A trading strategy that aims to capitalize on long-term trends and position oneself accordingly.
CHART PATTERNS
Rounding Bottom Cup/Handle (RBC&H): A pattern that signals a potential reversal from a downtrend.
Breakout (BO): A price move closure above a resistance or below a support level.
Flag & Pole BO: (F&P BO) Bullish Continuation Pattern
Consolidation : Price Typically Swings between a Range for a period of Time Long or Short basis the MTFA. Breaking out of this range UPWARDS is an opportunity to BUY and DOWNWARDS is SELL opportunity.
Moving Averages:
Exponential Moving Average (EMA): A popular moving average that places more weight on recent price data.
Volume-Weighted Moving Average (VWMA): A moving average that gives more weight to high-volume stocks.
Fibonacci Retracement/Extension:
Trend-based Fibonacci Retracement: Used to identify potential support and resistance levels during re-tracements.
Trend-based Fibonacci Extension: Used to identify potential breakout levels during extensions.

It's a trapThe break above the 200 SMA is hopeful for bulls, but it was not on high volume. My simple position trading strategy has not indicated to re-enter, it looks for both a cross of the 200 SMA and a cross on the MACD. The former has happened but the MACD crossed on the 12th and has stayed above since. It uses conservative values to avoid entering into bear market rallies. Trend reversal to the upside could be real, but the probability of a sucker's rally is greater.

BTC.D Needs to Hit 71% For Alt Season To HappenI hate to be the bearer of bad news, but the face-melting Alt Season we are all patiently awaiting is not arriving until BTC.D reaches 71%
Having said that, there WILL be an outlier of Alts that outperform CRYPTOCAP:BTC , such as CRYPTOCAP:SOL 💯

ETH Rejection Incoming? Don’t Fall for This Bull TrapYello Paradisers, are you watching how ETH is reacting right now at this key zone? This could either turn into a textbook bearish setup… or catch everyone off guard. Let’s break it down 👇
💎ETHUSDT is currently hovering at a critical resistance area, perfectly aligned with both a key Fibonacci retracement zone and the 200 EMA—classic confluence. What makes it even more concerning is the bearish divergence, which is strengthening the probability of a downside rejection from this level.
💎To add fuel to the fire, the price action has just taken liquidity (inducement) above the previous highs, another bearish signal that supports the idea of a potential reversal from here.
💎However, this bearish bias will be fully invalidated if ETH manages to break and close a candle above the resistance zone. That kind of price action would suggest strength from buyers and a likely continuation to the upside.
💎In that case, it’s wiser to stay patient and wait for a cleaner setup at a better price. Rushing into a trade at this stage, especially in a moment of indecision, is not how pros operate.
If you want to be consistently profitable, you need to be extremely patient and always wait only for the best, highest probability trading opportunities.
MyCryptoParadise
iFeel the success🌴

Okta: Strong In a Weak Market?Okta has been quietly fighting higher, and some traders may see opportunity in its latest pullback.
The first pattern on today’s chart is the series of higher weekly lows since November. That contrasts sharply with the S&P 500 and Nasdaq-100, which have made lower weekly lows.
Second, the 50-day simple moving average (SMA) began the year by rising above the 100-day SMA. A “golden cross” above the 200-day SMA followed in February. The next month, the 100-day SMA rose above the 200-day SMA. That sequence, with the faster SMAs above the slower ones, may reflect a positive long-term trend. (See the circles.)
Speaking of the 100-day SMA, OKTA is trying to hold that line this week.
Finally, bullish price gaps following the last two quarterly reports may reflect improved fundamental sentiment in the cybersecurity company.
TradeStation has, for decades, advanced the trading industry, providing access to stocks, options and futures. If you're born to trade, we could be for you. See our Overview for more.
Past performance, whether actual or indicated by historical tests of strategies, is no guarantee of future performance or success. There is a possibility that you may sustain a loss equal to or greater than your entire investment regardless of which asset class you trade (equities, options or futures); therefore, you should not invest or risk money that you cannot afford to lose. Online trading is not suitable for all investors. View the document titled Characteristics and Risks of Standardized Options at www.TradeStation.com . Before trading any asset class, customers must read the relevant risk disclosure statements on www.TradeStation.com . System access and trade placement and execution may be delayed or fail due to market volatility and volume, quote delays, system and software errors, Internet traffic, outages and other factors.
Securities and futures trading is offered to self-directed customers by TradeStation Securities, Inc., a broker-dealer registered with the Securities and Exchange Commission and a futures commission merchant licensed with the Commodity Futures Trading Commission). TradeStation Securities is a member of the Financial Industry Regulatory Authority, the National Futures Association, and a number of exchanges.
TradeStation Securities, Inc. and TradeStation Technologies, Inc. are each wholly owned subsidiaries of TradeStation Group, Inc., both operating, and providing products and services, under the TradeStation brand and trademark. When applying for, or purchasing, accounts, subscriptions, products and services, it is important that you know which company you will be dealing with. Visit www.TradeStation.com for further important information explaining what this means.

Babcock & Wilcox Stock Quote | Chart & Forecast SummaryKey Indicators On Trade Set Up In General
1. Push Set Up
2. Range Set up
3. Break & Retest Set Up
Notes On Session
# Babcock & Wilcox Stock Quote
- Double Formation
* Wave Feature | Completed Survey
* ((No Trade)) | Inverted Structure At 11.00 USD | Subdivision 1
- Triple Formation
* (EMA Settings)) + Downtrend Continuation | Subdivision 2
* (TP1) | Subdivision 3
* Daily Time Frame | Trend Settings Condition
- (Hypothesis On Entry Bias)) | Logarithmic Settings
- Position On A 1.5RR
* Stop Loss At 0.45 USD
* Entry At 0.25 USD
* Take Profit At 0.10 USD
* (Downtrend Argument)) & Pattern Confirmation (Inverted Structure)
* Ongoing Entry & (Neutral Area))
Active Sessions On Relevant Range & Elemented Probabilities;
European-Session(Upwards) - East Coast-Session(Downwards) - Asian-Session(Ranging)
Conclusion | Trade Plan Execution & Risk Management On Demand;
Overall Consensus | Sell

$BTC Closes Above the 200DMAPretty crazy how accurate ₿itcoin PA follows my squiggles, eh? 🤓
CRYPTOCAP:BTC has Closed above the 200DMA with a massive 25% rally over the past two weeks.
Next target $100k, but expect a retest of the 200DMA ~$88,5

Hershey Stock Quote | Chart & Forecast SummaryKey Indicators On Trade Set Up In General
1. Push Set Up
2. Range Set up
3. Break & Retest Set Up
Notes On Session
# Hershey Stock Quote
- Double Formation
* Start Of (Diagonal) At 93.00 USD | Completed Survey
* (Reversal Argument)) & Short Set Up Entry | Subdivision 1
- Triple Formation
* Wave Feature On Downtrend Bias | Subdivision 2
* (TP1) | Subdivision 3
* Daily Time Frame | Trend Settings Condition
- (Hypothesis On Entry Bias)) | Indexed To 100
- Position On A 1.5RR
* Stop Loss At 182.00 USD
* Entry At 154.00 USD
* Take Profit At 113.00 USD
* (Downtrend Argument)) & Pattern Confirmation (Flag Structure)
* Ongoing Entry & (Neutral Area))
Active Sessions On Relevant Range & Elemented Probabilities;
European-Session(Upwards) - East Coast-Session(Downwards) - Asian-Session(Ranging)
Conclusion | Trade Plan Execution & Risk Management On Demand;
Overall Consensus | Sell

Dogecoin Breakout Alert: Is a Major Recovery Rally Starting Now?Dogecoin on the Cusp? Analyzing the Potential Breakout and Path to Recovery
Dogecoin (DOGE), the original meme coin that captured the world's attention with its Shiba Inu mascot and community-driven rallies, is once again stirring excitement in the cryptocurrency markets. After a period of consolidation and navigating broader market volatility, DOGE is showing signs of life, prompting speculation about whether a significant upside move could be on the horizon, potentially leading to a more sustained recovery. Recent price action, technical indicators, and optimistic trader sentiment are converging, painting a picture of a coin potentially coiling for its next big move.
Finding Footing: The Bounce from $0.1500
The foundation for the current optimism was laid when Dogecoin successfully defended the $0.1500 support zone against the US Dollar. In volatile markets, establishing clear support levels is crucial. Holding above $0.1500 demonstrated resilience and provided a base from which buyers could initiate a fresh push upwards. Following this defense, DOGE began a "decent upward move," managing to climb above the $0.1550 level.
This initial climb is significant because it signals a shift from purely defensive price action to potentially offensive momentum. Buyers stepped in at a key psychological and technical level, absorbing selling pressure and turning the tide, at least in the short term. The ability to not only hold support but to initiate a bounce suggests underlying demand and interest returning to the meme coin.
Consolidation and Key Technical Signals
Currently, Dogecoin appears to be in a consolidation phase, trading above the $0.1580 level. Consolidation after an upward move is often viewed constructively by technical analysts. It can represent a period where the market digests recent gains, shakes out weak hands, and builds energy for the next directional leg. The key question during consolidation is whether it resolves upwards (a continuation of the prior move) or downwards.
Several technical indicators are lending credence to the bullish case during this consolidation:
1. Trading Above the 100-Hourly Simple Moving Average (SMA): The price remaining above this key short-term moving average is generally considered a bullish sign on hourly charts. It indicates that the average price over the recent past is trending upwards, and the current price is maintaining strength relative to that average. It often acts as dynamic support during pullbacks within an uptrend.
2. Bullish Trend Line: The formation of a short-term bullish trend line with support currently identified around $0.1590 on the hourly DOGE/USD chart is another positive signal. This ascending line connects recent lows and visually represents the current upward trajectory. As long as the price stays above this trend line, the immediate bullish structure remains intact. It provides traders with a clear reference point for potential entry or stop-loss levels.
These technical factors suggest that despite the consolidation, the underlying momentum favors the bulls in the immediate term. The market structure is building higher lows, supported by the trend line and the moving average.
The Resistance Hurdle and Breakout Potential
While the support and short-term indicators are encouraging, the true test for Dogecoin lies in overcoming resistance. The immediate significant hurdle identified is the $0.1650 level. A decisive break and close above this resistance zone would be a strong technical signal, potentially confirming the end of the consolidation phase and the beginning of a more substantial rally. Breaking resistance often triggers further buying activity, including stop-loss orders from short sellers and new entries from breakout traders.
Beyond $0.1650, the next major target highlighted is the $0.2050 resistance zone. Clearing this level would represent a more significant milestone, potentially putting Dogecoin firmly back on the path towards higher valuations seen earlier in the cycle. A move towards $0.2050 would likely require sustained buying pressure and positive sentiment across the broader crypto market.
Trader Sentiment and Bold Predictions
Adding fuel to the speculative fire are optimistic predictions from market participants. Notably, one trader, who reportedly "nailed" a previous 300% rally in Dogecoin, is suggesting that history might be about to repeat itself. While such predictions should always be taken with caution, they reflect a growing bullish sentiment within certain segments of the trading community. These forecasts often rely on pattern recognition, fractal analysis (comparing current price structures to historical ones), and sentiment indicators.
Furthermore, bullish signals are reportedly pointing towards a potential "pump," with some analysts setting longer-term price targets as high as $0.28. Achieving such a target would represent a significant recovery and substantial gains from current levels. This level likely corresponds to previous key resistance or Fibonacci extension levels, representing areas where traders anticipate strong price reactions.
Why the Optimism? Potential Catalysts
Several factors could be contributing to this renewed optimism:
• Broader Market Recovery: Cryptocurrencies often move in tandem, especially Bitcoin and major altcoins. If Bitcoin continues its strength or embarks on a new leg up, it often lifts sentiment across the market, benefiting coins like Dogecoin.
• Meme Coin Season: Historically, periods of market exuberance have seen "meme coin seasons" where highly speculative, community-driven tokens experience outsized gains. Renewed interest in this sector could benefit its leading token, DOGE.
• Community Engagement: Dogecoin boasts one of the most active and vocal communities in crypto. Social media hype and coordinated community efforts can significantly impact its price, especially during positive market conditions.
• Technical Setup: As outlined above, the technical picture (holding support, bullish trend line, potential breakout from consolidation) provides a logical basis for traders anticipating an upward move.
Risks and Considerations
Despite the bullish signals and optimistic forecasts, investing in Dogecoin remains inherently risky and speculative:
• Volatility: DOGE is known for its extreme price swings. Gains can be rapid, but losses can be equally swift.
• Resistance is Real: Failure to break decisively above $0.1650 or $0.2050 could lead to a rejection and a move back down to test support levels, potentially invalidating the bullish setup.
• Market Dependence: A downturn in Bitcoin or the broader crypto market could easily drag Dogecoin down, regardless of its individual technical setup.
• Hype-Driven: Price action can be heavily influenced by social media trends, celebrity endorsements (like those historically from Elon Musk), and general market sentiment, which can change rapidly and unpredictably.
Conclusion: Poised for Potential, Confirmation Needed
Dogecoin currently stands at an intriguing juncture. It has established a solid base of support, initiated an upward move, and is consolidating above key short-term indicators, supported by a bullish trend line. Optimistic traders are eyeing significant upside potential, with targets ranging from $0.1650 and $0.2050 to as high as $0.28, fueled by predictions of repeating past explosive rallies.
However, potential does not guarantee performance. The immediate challenge is converting the current consolidation into a confirmed breakout above the $0.1650 resistance. A successful breach could indeed ignite further buying pressure and set the stage for a move towards $0.2050 and potentially higher, sparking the "full-on recovery" bulls are hoping for. Conversely, failure to overcome resistance could see momentum wane.
For traders and investors, the current situation demands careful monitoring of key levels. While the technical signals lean bullish in the short term, Dogecoin's inherent volatility and sensitivity to broader market conditions necessitate cautious optimism and robust risk management. Whether DOGE is truly about to repeat history remains to be seen, but the current setup has certainly put the beloved meme coin back in the spotlight.

Arista Networks (NYSE: $ANET): Positive Outlook Amid AI Growth Arista Networks Inc. (NYSE: ANET) closed the latest trading session at $68.67, gaining 1.48% on the day. The stock has recently experienced a steep decline from its 52-week high near $134, yet it remains a key player in the edge computing space. As of Q4 2024, 78 hedge funds held positions in Arista, signaling strong institutional interest.
The company’s infrastructure supports edge computing by delivering ultra-fast, programmable switches and routers. These tools are vital for real-time data management in environments such as data centers and IoT systems. With the growing demand for AI-driven workloads at the network edge, Arista’s technology is well-placed to support this shift.
In 2024, Arista recorded $7 billion in revenue, marking a 19.45% increase from the previous year. Its net income rose by 36.3% to $2.85 billion. In Q4 alone, revenue jumped by 25.3% year-over-year to $1.93 billion. To enhance AI workload management, Arista launched the EOS Smart AI Suite with Cluster Load Balancing, a solution aimed at improving system efficiency under large-scale processing demands.
The edge computing market is on track to grow significantly, with global spending expected to reach $261 billion in 2025. This trend is supported by broader interest in Internet of Things (IoT) and AI technologies. Analysts predict this spending will climb to $380 billion by 2028.
Technical Analysis
Arista's price action shows it tested a key support zone at around $60, with the 200-day moving average at $65.95. The stock previously attempted to rebound above resistance at $77 but failed, forming a bearish setup. Current RSI stands at 31.16, suggesting the stock is close to oversold reading.
If it holds above the $60 support, a potential bounce could target $77, followed by $90 and above, aligning with the 100-day moving average. A break below $65 could open a path toward $60 or lower. Volume has been heavy during the downtrend, indicating strong selling pressure.

Barclays Raises TechnipFMC (FTI) Price Target to $43TechnipFMC (NYSE: NYSE:FTI ) closed at $31.23 on the previous trading day, staying close to its one-year high of $33.45. Evercore ISI analyst Jason Bandel maintained a Buy rating on the stock, setting a price target of $39. Meanwhile, Barclays reaffirmed its Buy rating with a higher target of $43 in a report dated March 26.
Currently, the consensus among Wall Street analysts rates TechnipFMC as a “Strong Buy.” The average price target stands at $37.22, suggesting an upside of 19.18% from current levels. The stock has an average daily trading volume of 4.33 million shares. TechnipFMC’s performance is under close watch, though analyst Jason Bandel has posted a -5.4% average return with a 31.58% success rate. He follows the energy sector, covering companies like Helmerich & Payne and NOV in addition to FTI.
Insider activity on the stock shows negative sentiment. Over the past quarter, 55 corporate insiders have sold shares. Earlier this month, Director Eleazar de Carvalho Filho sold 9,381 shares worth $279,178.56.
Technical Analysis
The stock recently bounced off a key support zone around $22, close to the 200-day moving average at $21.86. This bounce formed a bullish reversal setup. The price is now hovering near $25.20. If it holds this area, the next resistance is around the $28.00 level, followed by a possible move back toward its recent high of $33.45.
The volume profile shows increased buying near the bottom of the bounce, suggesting accumulation. RSI is around 42, indicating neutral momentum but potential for recovery if buying pressure continues. A break above $28 may signal continuation toward $33.45.

Gold: Bearish, may fall below 3300📊 Yesterday, gold resumed its bullish move after a minor pullback, breaking through the 3400 level and reaching around 3440 during today’s early session, before starting to retrace.
📉 In the chart I shared yesterday, the black line represents the key bull-bear boundary. The current price has already broken below this level, and if it fails to reclaim it, the trend may shift toward bearish in the short term.
📌 Key support levels to watch:
First support: 3383
Next support: 3350
If selling intensifies, there’s a real chance price may break below 3300

#ETH Update – April 22, 2025
Current Price: $1,700.02 (+7.8%)
📊 Technical Snapshot
• Trend: Downtrend (last 4 months)
• Support: $1,500 & $1,350
• Resistance: $1,750 & $2,150
• Range: $1,557 – $1,630 → Moderate volatility
• ETH has dropped ~65% from its all-time high of $4,107
🔗 On-Chain Metrics
• Exchange Inflows: Large positive netflow to derivatives in March → Selling pressure
• Wallet Profitability: Only 20.94% of wallets in profit → Weak sentiment
• Active Addresses: Down to 400K from 650K → Lower usage
• Staked ETH: Over 25.6M ETH → Long-term confidence remains strong
🧭 Fundamentals
• SEC Approved ETH ETFs (no staking allowed) → Institutional inflow potential
• Galaxy Digital moved $100M from ETH to SOL → Institutional rotation
📈 Forecasts
• Short-Term (by Apr 27): ~$1,635.87 (−0.51%)
• Mid-Term (by May 22): ~$1,725.30 (+4.93%)
✅ Summary:
ETH is still in a downtrend, but fundamentals like staking and ETF approval show long-term strength. Short-term movement may be choppy. Watch $1,500 support and $1,750 resistance.

#BTC Market Update – April 22, 2025Current Price: $90,700 (+4%)
📊 Technical Overview
• 200-Day MA: $88,356 – BTC is trading above it → Bullish sign
• RSI: 78 – Overbought zone → Possible pullback
• Resistance: $90,000 – Key psychological level
• Support: $85,000 – Watch this level on retracement
🔗 On-Chain Insight
• Long-Term Holders: Some distribution happening → Profit-taking
• Network Activity: Steady → Healthy usage
• Sentiment: Bullish → Weak USD + institutional inflows
🧭 Macro & Fundamentals
• U.S.–China tensions + Fed uncertainty → BTC seen as safe haven
• Institutions are increasing their exposure → Positive market signal
✅ Summary:
BTC shows strong bullish momentum, but RSI is overheated. Stay alert for potential short-term correction. Key levels: $85K support / $90K breakout.

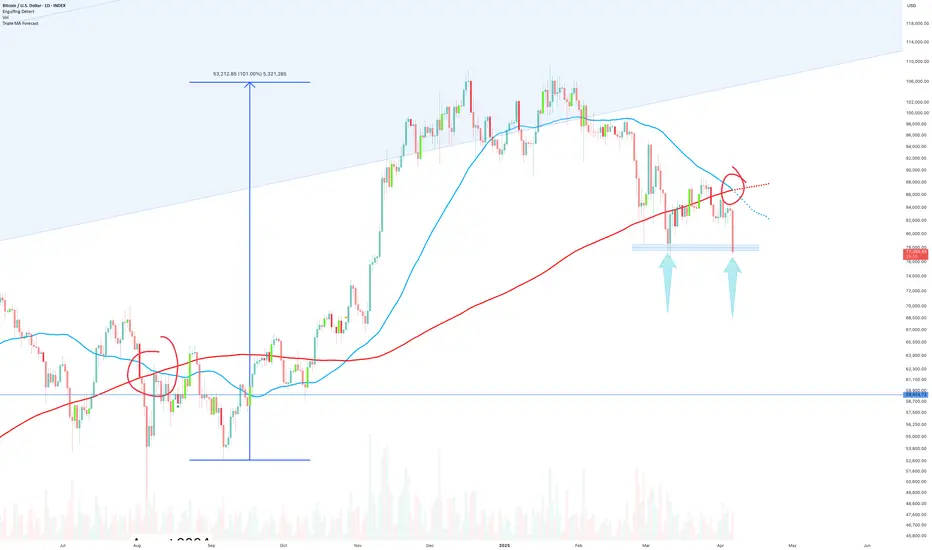
Bitcoin death cross! April 7th, 2025** short term analysis, the days ahead **
Short version: Very positive.
Long version:
The Death Cross prints tomorrow, April 7th, 2025. For many retail traders who use moving averages the read will be highly negative. However history tells us that is rarely true.
What is a death cross?
1. The 50 day SMA (Simple Moving Average - blue line) crosses down the 200 day SMA.
and
2. Price action is under the 200 day SMA.
Over the years variations of this post have been made by Ww.. perhaps you remember?
The dotted line is the forecast direction of price action using the Box-Jenkins approach.
www.investopedia.com
Why positive?
Look left - Past Bearish crosses on the daily chart (whilst in a confirmed bull market, which remains true, crosses in a bear market are ignored.)
August 2024, 100% rally after death cross
September 2023, 190% rally after death cross
March 2020, 600% rally after death cross
Is it possible this time is different? Sure.
Is it probable? No.
Ww
StoneCo May Have Turned HigherStoneCo has been stuck in a range since crashing in 2021, but some traders may think it’s turning back to the upside.
The first pattern on today’s chart is the series of lower highs since early last year. Prices have apparently broken that falling trendline.
Second, the Brazilian fintech jumped on a strong quarterly report last month and continued higher after a pullback. That could reflect improved fundamentals.
Third, the 8-day exponential moving average (EMA) is above the 21-day EMA. MACD is also rising. Those signals may be consistent with a short-term uptrend.
Fourth, the 50-day simple moving average (SMA) is nearing a potential “golden cross” above the 200-day SMA.
Finally, Latin American stocks have outperformed in recent weeks. Brazil, in particular, has seen economic growth forecasts increase.
TradeStation has, for decades, advanced the trading industry, providing access to stocks, options and futures. If you're born to trade, we could be for you. See our Overview for more.
Past performance, whether actual or indicated by historical tests of strategies, is no guarantee of future performance or success. There is a possibility that you may sustain a loss equal to or greater than your entire investment regardless of which asset class you trade (equities, options or futures); therefore, you should not invest or risk money that you cannot afford to lose. Online trading is not suitable for all investors. View the document titled Characteristics and Risks of Standardized Options at www.TradeStation.com . Before trading any asset class, customers must read the relevant risk disclosure statements on www.TradeStation.com . System access and trade placement and execution may be delayed or fail due to market volatility and volume, quote delays, system and software errors, Internet traffic, outages and other factors.
Securities and futures trading is offered to self-directed customers by TradeStation Securities, Inc., a broker-dealer registered with the Securities and Exchange Commission and a futures commission merchant licensed with the Commodity Futures Trading Commission). TradeStation Securities is a member of the Financial Industry Regulatory Authority, the National Futures Association, and a number of exchanges.
TradeStation Securities, Inc. and TradeStation Technologies, Inc. are each wholly owned subsidiaries of TradeStation Group, Inc., both operating, and providing products and services, under the TradeStation brand and trademark. When applying for, or purchasing, accounts, subscriptions, products and services, it is important that you know which company you will be dealing with. Visit www.TradeStation.com for further important information explaining what this means.

US 100 Index - Is 17404/749 Support Important?As European traders return from their extended Easter break they turn on their screens to find US assets back under pressure. The US 100 index dropped 2.2% yesterday to close at 17779, which included a late rally from a mid session low at 17570.
These moves are potentially reflecting a growing unease around numerous important issues, including, a lack of progress in trade talks with US allies, US economic growth concerns and President Trump's on-going challenge to Federal Reserve independence.
Looking forward, US 100 traders have a lot to focus on this week, Tesla reports its earnings after the close tonight, against a backdrop of weekend news reports which suggested it may be about to delay production of cheaper EVs. That aside, investors may also be focused on sales projections for 2025, autonomous driving plans and the impact of tariffs on the company's profitability.
It may well be a similar story when Alphabet reports its earnings after the close on Thursday.
Throw in the latest April Preliminary PMI Survey releases on Wednesday from the developed economies, which could well start to show the impact of tariffs on growth, business sentiment and inflation, and it is possible that the recent US 100 index volatility could continue across the week.
Technical Update: Could Potential Support at 17404/17749 Be Important?
As impressive as the 18% recovery in the US 100 index from the April 7th 2025 low to the April 10th 2025 high (16290 up to 19222) appeared, after the latest price weakness, this upside may prove to be a limited reactive move, although further confirmation may still be required.
As the chart above shows, the latest upside strength saw the index back to what some traders may have viewed as an important resistance, marked by a combination of the declining Bollinger mid-average (18992 at the time) and the 50% Fibonacci retracement of the February 18th 2025 to April 7th 2025 weakness, which stands at 19258.
With the latest price activity seeing weakness materialise again, it might now be suggested
this potential resistance range remains the important focus on the topside, although much will depend on future market sentiment and price trends.
With this in mind, what are the potential supports we might wish to monitor, to help us gauge how much further the current weakness may have to carry?
Possible Support Levels:
Fibonacci retracements can offer an insight into potential support zones, with them possibly able to hold, even reverse price weakness back to the upside. Therefore, 17404/17749, which is equal to the 50% and 61.8% Fibonacci retracements of the April price strength, maybe an area traders are currently focusing on.
However, there could still be potential for a further period of price weakness if this 17404/17749 range is broken on a closing basis. In that case, the next support may well then be represented by the April 7th 2025 session low at 16290, possibly further, if this in turn gives way.
Possible Resistance Levels:
The 17404/17749 support range is still intact, and while this remains the case on a closing basis, attempts at price strength could still be seen. However, with the declining Bollinger mid-average currently at 18648 and having recently seen it reverse attempts at price strength, closing breaks above this level might be required to trigger a more extended phase of strength.
That said, as proved the case in early April, 19258, the 50% Fibonacci retracement level, may also now need to give way on a closing basis, to suggest further attempts to develop price strength towards higher resistance levels.
The material provided here has not been prepared in accordance with legal requirements designed to promote the independence of investment research and as such is considered to be a marketing communication. Whilst it is not subject to any prohibition on dealing ahead of the dissemination of investment research, we will not seek to take any advantage before providing it to our clients.
Pepperstone doesn’t represent that the material provided here is accurate, current or complete, and therefore shouldn’t be relied upon as such. The information, whether from a third party or not, isn’t to be considered as a recommendation; or an offer to buy or sell; or the solicitation of an offer to buy or sell any security, financial product or instrument; or to participate in any particular trading strategy. It does not take into account readers’ financial situation or investment objectives. We advise any readers of this content to seek their own advice. Without the approval of Pepperstone, reproduction or redistribution of this information isn’t permitted.

BTC is in strong support area based Fib RetracementHi again, for a long time I don't share my ideas here, so I'm trying to consistent share my thought here.
Technical
BINANCE:BTCUSD in strong support line based Fib Retracement on $76,113.25 (on daily Timeframe)
The price currently below the EMA 200
MACD still doesn't give the sign to long
BTC Dominance still high (60.39% based on Coinstast )
Macro
Based on similiar correlation with S&P500, it's still give no good sign to bounce back (it maybe going deeper)
About the global economy, US Tariff still give the global uncertainty and cold vibes haha
Summary
If you going long term, maybe you can go buy BTC in small size, is a good price to add the collection
If you going short term, I think it will be go deeper first
Thanks for your time!
I hope everyone have a good time and good health!
