Gold on bulish trendGold still on bulish trend, if you trade on gold .
As you see , gold on bulish channel right now.
Moving Averages


Weekly plan for XRPMarked the important levels in this video for this week and considered a few scenarios of price performance
Locally, the growth may continue and we will quickly see a breakdown of the 2.2 level
Write a comment with your coins & hit the like button, and I will make an analysis for you
The author's opinion may differ from yours,
Consider your risks.
Wish you successful trades! MURA

Yirendai Stock Quote | Chart & Forecast SummaryKey Indicators On Trade Set Up In General
1. Push Set Up
2. Range Set up
3. Break & Retest Set Up
Notes On Session
# Yirendai Stock Quote
- Double Formation
* (A+ Set Up)) | Completed Survey
* (0.382 + 0) Retracement Area & Short Set Up Entry | Subdivision 1
- Triple Formation
* (EMA Settings)) On Uptrend Bias | Subdivision 2
* (TP1) | Subdivision 3
* Daily Time Frame | Trend Settings Condition
- (Hypothesis On Entry Bias)) | Indexed To 100
- Position On A 1.5RR
* Stop Loss At 11.00 USD
* Entry At 14.00 USD
* Take Profit At 20.00 USD
* (Uptrend Argument)) & No Pattern Confirmation + (Inverted Structure)
* Ongoing Entry & (Neutral Area))
Active Sessions On Relevant Range & Elemented Probabilities;
European-Session(Upwards) - East Coast-Session(Downwards) - Asian-Session(Ranging)
Conclusion | Trade Plan Execution & Risk Management On Demand;
Overall Consensus | Buy

Gold or Bitcoin - Which is the better hedge for 2024?Short answer: Bitcoin
By the year end Bitcoin shall enjoy stronger gains. That is despite the 2-week Gravestone DOJI candle now currently printing on Bitcoin, which makes you wonder… what heinous price action awaits gold bugs?
On the above 3-day chart a ratio of Gold/Bitcoin is shown. If this ratio is downtrending (it is), Bitcoin will be worth more than Gold with each passing week and vice versa.
A Death Cross has now printed on the above 3-day chart after broken market structure. Expect the ratio to climb to confirm past support as resistance.
The 3-day death cross is significant. Look left. The last 3-day death cross printed on March 2016 (below). Gold lost 99% of its value against Bitcoin from that time. Now I’m not saying that is going to repeat, however the point would be that a 3-day death cross is not something you ignore.
Ww
3-day Death cross March 2016
Last year (2023) and the years before the same question:
Which is the better hold for preserving ones wealth?
In 2023, it was Bitcoin.
2023 idea
In 2022, it was Gold. Idea below. Bitcoin correction throughout 2022 made Gold the only option during the bear market.
2022 Idea

Industrial ETF May Face ResistanceThe SPDR Select Sector Industrial ETF dropped in early April, and some traders may expect another push to the downside.
The first pattern on today’s chart is the March 13 low of $128.26. XLI peaked $0.44 under that level this month, which may suggest old support has become new resistance.
Second, the 50-day simple moving average (SMA) recently had a “death cross” below its 200-day SMA. That may suggest the long-term trend has gotten more bearish.
Third, the stochastics oscillator’s leading line crossed under the smoothing signal line.
Fourth, the 8-day exponential moving average (EMA) has remained under the 21-day EMA.
Finally, XLI hit a 52-weeek low of $112.75 on April 7. Is a retest of that support needed?
Standardized Performances for the ETF mentioned above:
SPDR Select Sector Industrial ETF (XLI)
1-year: +4.06%
5-years: +122.11%
10-year: +135.02%
(As of March 31, 2025)
Exchange Traded Funds ("ETFs") are subject to management fees and other expenses. Before making investment decisions, investors should carefully read information found in the prospectus or summary prospectus, if available, including investment objectives, risks, charges, and expenses. Click here to find the prospectus.
TradeStation has, for decades, advanced the trading industry, providing access to stocks, options and futures. If you're born to trade, we could be for you. See our Overview for more.
Past performance, whether actual or indicated by historical tests of strategies, is no guarantee of future performance or success. There is a possibility that you may sustain a loss equal to or greater than your entire investment regardless of which asset class you trade (equities, options or futures); therefore, you should not invest or risk money that you cannot afford to lose. Online trading is not suitable for all investors. View the document titled Characteristics and Risks of Standardized Options at www.TradeStation.com . Before trading any asset class, customers must read the relevant risk disclosure statements on www.TradeStation.com . System access and trade placement and execution may be delayed or fail due to market volatility and volume, quote delays, system and software errors, Internet traffic, outages and other factors.
Securities and futures trading is offered to self-directed customers by TradeStation Securities, Inc., a broker-dealer registered with the Securities and Exchange Commission and a futures commission merchant licensed with the Commodity Futures Trading Commission). TradeStation Securities is a member of the Financial Industry Regulatory Authority, the National Futures Association, and a number of exchanges.
TradeStation Securities, Inc. and TradeStation Technologies, Inc. are each wholly owned subsidiaries of TradeStation Group, Inc., both operating, and providing products and services, under the TradeStation brand and trademark. When applying for, or purchasing, accounts, subscriptions, products and services, it is important that you know which company you will be dealing with. Visit www.TradeStation.com for further important information explaining what this means.

Short XAUUSD (Short Term Trade)Shorting Gold here.
Entry at 3375
Stops at 3387
Target is 3250
Risking 1% of my capital.

This 3 Step System Has Caught The Bullrun In BitcoinThe rocket booster strategy is a classic
indicator which we have been using for a long
time.
Right now the strategy is trending in BItcoin.
This is your chance to see the strategy.
This strategy has 3 steps:
1-The price has to be above the 50 EMA
2-The price has to be above the 200 EMA
3-The price has to Gap up
--
Last week we caught the bull run in
gold and the crash of the dollar
This week we have caught the bull run
In Bitcoin CRYPTO:BTCUSD
Watch this video to learn more
Also rocket boost this content
to learn more
--
Disclaimer:Trading is risky.
please learn risk management and
profit taking strategies.Also feel free to
use a simulation trading account
before trading with real money.

DR Horton Stock Quote | Chart & Forecast SummaryKey Indicators On Trade Set Up In General
1. Push Set Up
2. Range Set up
3. Break & Retest Set Up
Notes On Session
# DR Horton Stock Quote
- Double Formation
* Start Of (Diagonal) At 30.00 USD | Completed Survey
* (Middle Range)) & Long Set Up Entry | Subdivision 1
- Triple Formation
* Wave Feature / Ongoing Wave (3)) On Uptrend Bias | Subdivision 2
* (TP1) | Subdivision 3
* Daily Time Frame | Trend Settings Condition
- (Hypothesis On Entry Bias)) | Logarithmic Settings
- Position On A 1.5RR
* Stop Loss At 92.00 USD
* Entry At 122.00 USD
* Take Profit At 166.00 USD
* (Uptrend Argument)) & Pattern Confirmation (Inverted Structure)
* Ongoing Entry & (Neutral Area))
Active Sessions On Relevant Range & Elemented Probabilities;
European-Session(Upwards) - East Coast-Session(Downwards) - Asian-Session(Ranging)
Conclusion | Trade Plan Execution & Risk Management On Demand;
Overall Consensus | Buy

$INJ: Preparing for a Possible Impulsive Move UpCRYPTOCAP:INJ – Setting Up for a Potential Impulsive Move
After a sharp correction, CRYPTOCAP:INJ may be preparing for a strong rebound.
In a previous idea, I forecasted a bottom at $8.5 — and it dipped even lower to $7, fully retracing last year's pump.
The price broke below the bearish flag after a clear bearish divergence at the top. It also sliced through my green buy zone and is now sitting right on a critical support level at $8.40.
🚀 Signs of recovery are starting to show:
🔹 MACD is climbing and approaching the median line — a bullish crossover could ignite an impulsive rally.
🔹 Price is stabilizing above the key $8.40 support.
🔹 RSI is low and consolidating — signaling potential upside.
🔹 Volume is quiet — often a precursor to strong moves.
The target is to re-integrate the green liquidity zone, to prepare another explosive pump.
📅 Reminder: around this time last year, CRYPTOCAP:INJ pulled off a 4x rally. While past performance doesn't guarantee future results, the setup looks promising.
🧠 DYOR | This is not financial advice.
#INJ #CryptoAnalysis #Altcoins #TechnicalAnalysis #MACD #CryptoMarket #BreakoutSetup #DYOR

$ONDO: Potential Reversal in SightLSE:ONDO : Potential Reversal in Sight
Signs suggest that LSE:ONDO may have reached the bottom of its consolidation phase, having fully retraced to its August 2024 lows. Momentum is shifting:
MACD is climbing toward the median — a breakout above could signal the start of an explosive uptrend.
RSI remains neutral, leaving room for a strong move in either direction.
Volume is near all-time lows, often a precursor to a breakout.
If the projected move plays out, the next resistance levels (based on Fibonacci ratios) are:
🔹 TP1: $0.94
🔹 TP2: $1.17
🔹 TP3: $1.35
📉 DYOR | Not financial advice.

MicroStrategy (MSTR) - Breakout watch if BTC co-operatesMSTR is looking healthy above its major moving averages after forming what appears to be a developing triple bottom.
If you have a bullish thesis on the price of bitcoin at its current level, MSTR is very compelling. Any longs could have a clearly defined risk in the region of the moving averages which also aligns with an untested POC and anchored VWAP from the lows.

National Vision Stock Quote | Chart & Forecast SummaryKey Indicators On Trade Set Up In General
1. Push Set Up
2. Range Set up
3. Break & Retest Set Up
Notes On Session
# National Vision Stock Quote
- Double Formation
* Start Of (Diagonal) At 55.00 USD | Completed Survey
* Wave Feature & Short Set Up Entry | Subdivision 1
- Triple Formation
* 0.5 Retracement Area On Downtrend Bias | Subdivision 2
* (TP1) | Subdivision 3
* Daily Time Frame | Trend Settings Condition
- (Hypothesis On Entry Bias)) | Logarithmic Settings
- Position On A 1.5RR
* Stop Loss At 14.00 USD
* Entry At 12.00 USD
* Take Profit At 8.00 USD
* (Downtrend Argument)) & No Pattern Confirmation
* Ongoing Entry & (Neutral Area))
Active Sessions On Relevant Range & Elemented Probabilities;
European-Session(Upwards) - East Coast-Session(Downwards) - Asian-Session(Ranging)
Conclusion | Trade Plan Execution & Risk Management On Demand;
Overall Consensus | Sell

Visteon Corp Stock Quote | Chart & Forecast SummaryKey Indicators On Trade Set Up In General
1. Push Set Up
2. Range Set up
3. Break & Retest Set Up
Notes On Session
# Visteon Corp Stock Quote
- Double Formation
* (A+ Set Up)) At 116.00 USD | Completed Survey
* (EMA Settings)) & Short Set Up Entry | Subdivision 1
- Triple Formation
* (Rejection Entry)) On Continuation Bias | Subdivision 2
* (TP1) | Subdivision 3
* Daily Time Frame | Trend Settings Condition
- (Hypothesis On Entry Bias)) | Logarithmic Settings
- Position On A 1.5RR
* Stop Loss At 78.00 USD
* Entry At 71.00 USD
* Take Profit At 63.00 USD
* (Downtrend Argument)) & No Pattern Confirmation
* Ongoing Entry & (Neutral Area))
Active Sessions On Relevant Range & Elemented Probabilities;
European-Session(Upwards) - East Coast-Session(Downwards) - Asian-Session(Ranging)
Conclusion | Trade Plan Execution & Risk Management On Demand;
Overall Consensus | Sell

AXISBANK – Classic Cup & Handle Breakout | Targeting 1280 & 1320🧠 Technical Analysis:
AXISBANK has formed a textbook Cup and Handle pattern over the past few months. The breakout above the resistance zone around ₹1199 marks a potential start of a new bullish rally.
🔹 Cup Formation: Rounded bottom between Dec 2024 - Apr 2025
🔹 Handle Formation: Consolidation range in Oct - Dec 2024
🔹 Breakout Candle: Strong bullish candle with increasing volume
🔹 200 EMA: Price is now well above the 200 EMA, adding to the bullish bias
🎯 Targets:
Target 1: ₹1280
Target 2: ₹1320
These levels are based on the measured move technique and previous swing highs.
🛡️ Support:
Immediate support lies around the breakout zone near ₹1199
Next strong support is near ₹1090 (200 EMA)
📊 Volume:
Breakout accompanied by a surge in volume confirms buyer interest and validates the pattern.
📌 Conclusion:
AXISBANK is showing strong bullish momentum with a confirmed breakout from a well-defined Cup and Handle formation. As long as it sustains above ₹1199, the stock could potentially rally toward ₹1280 and ₹1320 in the coming sessions.
📅 Keep it on your radar for bullish continuation setups!
Disclaimer:
This analysis is shared purely for educational and informational purposes and should not be considered as financial advice or a recommendation to buy or sell any security. Always do your own research and consult with a qualified financial advisor before making any investment decisions. Trading and investing involve risk.

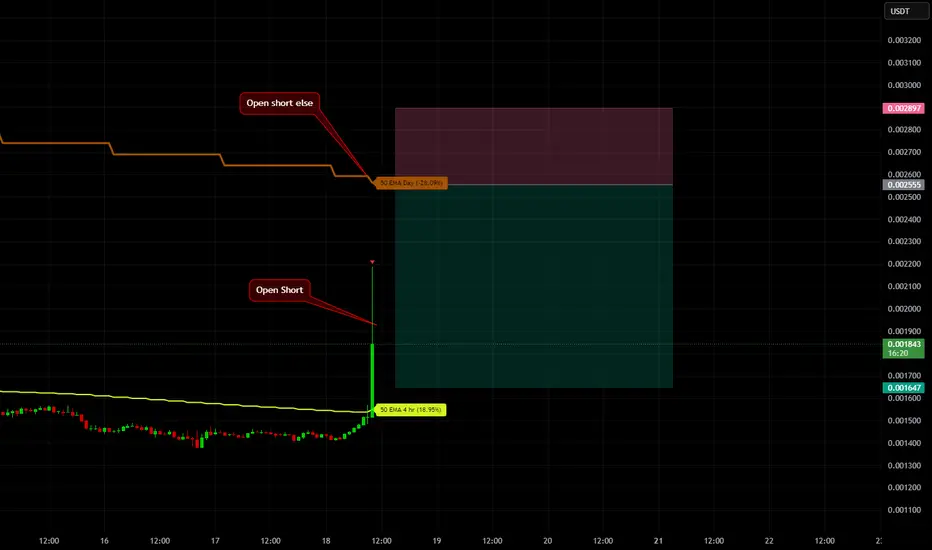
MEMEUSDT ShortMEMEUSDT had a strong breakout from the 4H EMA50 — up 23%! This setup is perfect for a short without a stop, using scaling in.
There’s a chance price might reach the daily EMA50 — if it does, I’ll add more to the short from there. The target will be adjusted based on how the 4H EMA50 moves.
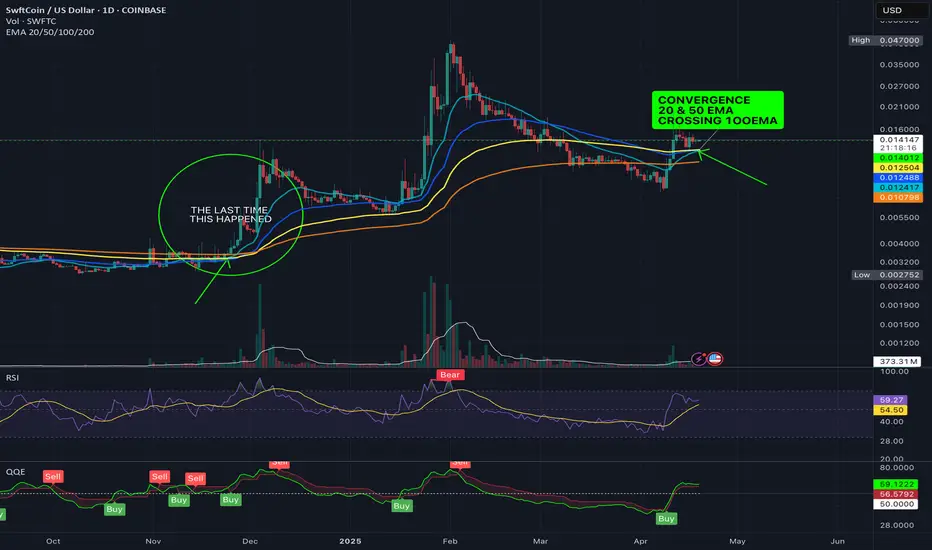
SWFT Convergence - 20/50 EMA Crossing 100 EMAIm not saying that its something, but it sure as hell isnt nothing. The last time this happened the price rose significantly. Thsi should happen over the next 24-48 hours so, we'll see.
Not financial advice
Celsius Holdings Outperforms Market with Strong YTD GainsCelsius Holdings Inc. (CELH) continues to attract significant investor attention, closing at $37.24 on April 17, up $0.58 (1.58%). The functional energy drink maker has delivered impressive year-to-date returns of 41.38%, substantially outpacing the S&P 500's 10.18% gain during the same period.
For the current quarter, analysts expect earnings of $0.20 per share, representing a 25.9% year-over-year decline. However, consensus estimates have improved dramatically with a 32.8% upward revision over the last 30 days. The full-year outlook appears more favorable, with projected earnings of $0.99 per share indicating a 41.4% annual increase, followed by 15.1% growth to $1.14 per share next fiscal year.
Current quarter sales are expected to decline slightly to $345.26 million (-2.9%), but full-year revenue estimates show robust growth of 55.3% to $2.1 billion, followed by 19.4% growth next fiscal year. Celsius has demonstrated strong execution recently, beating earnings estimates in three of the last four quarters.
Technical Analysis
Technically, the chart shows a strong recovery from its $21.10 low. Price has recently broken above the 50-day moving average but remains below the 200-day moving average, suggesting improving momentum within a longer-term downtrend. Key resistance appears around $47-49, marked by a horizontal level that previously acted as support.
Volume has increased during recent price advances, adding credibility to the current uptrend. The next major challenge will be overcoming the $49 resistance zone before potentially continuing toward higher targets as indicated in the chart projection. If price faces rejection, it is likely to drop back to support at around $25.

Keurig Dr Pepper Holds Steady Ahead of Quarterly EarningsKeurig Dr Pepper (KDP) shares have shown resilience in recent weeks, climbing 5.9% over the past month while the broader S&P 500 declined by 6.9%. The beverage giant currently trades at $35.40, up $0.29 (0.83%), with 13.96 million shares traded. Analysts maintain a consensus "Hold" rating as KDP approaches its upcoming earnings announcement.
Wall Street expects the company to report earnings of $0.38 per share, unchanged from the year-ago quarter, while revenue is projected to reach $3.56 billion, representing a 2.8% year-over-year increase.
The company has seen minor positive revisions to its earnings estimates, with consensus EPS projections increasing by 0.1% over the past 30 days. This modest upward adjustment could signal improving analyst sentiment about KDP's near-term performance.
Breaking down the revenue expectations by segment, analysts forecast U.S. Refreshment Beverages will lead growth at $2.23 billion, up 6.6% year-over-year. Meanwhile, U.S. Coffee is expected to contract slightly to $884.51 million (-2.9%), and International sales may decrease to $448.32 million (-3.4%).
Technical Analysis
From a technical perspective, KDP has established an ascending trend line since reaching a low of $30.12. The stock currently trades above both its 50-day, 100-day and 200-day moving averages, suggesting positive momentum. The chart shows resistance around the $36 level, with support at the trend line near $33.60. Trading volume has increased during recent uptrend, potentially indicating stronger buyer conviction.

BTC: Do not cross the green lineThe green line is the great frontier for Bitcoin. It was its support and now it's the impossible-to-cross resistance. Don't cross it! Wait patiently for the opportunity; it won't come soon. Be patient.

Jesus Coin (JESUS) Price Jumps Over 50% in a Week Jesus Coin (JESUS) has experienced notable price action this week, rising by 52.90% in the past seven days. At the time of writing, the token trades at $0.00000006999. Despite a -7.61% drop in the past 24 hours, the coin maintains momentum, supported by increased attention within its community.
The project holds a market capitalization of approximately $7.19 million, positioning it at rank #1101 in the crypto market. Daily trading volume has declined to $110.11K, showing a 61.50% drop, signaling reduced short-term interest despite recent price movements.
Jesus Coin was created as a decentralized, community-led initiative aimed at promoting generosity and faith-based values in crypto. It brands itself as an “anti-meme coin,” built to counter dishonest projects and scams that have plagued the space.
Unlike typical crypto ventures, Jesus Coin launched without a team allocation and functions entirely through community efforts. Its mission focuses on inspiring generosity and cultural transformation through blockchain.
From a technical perspective, Jesus Coin shows signs of renewed bullish activity after a prolonged consolidation phase. The 3-day candlestick chart highlights a recent push attempt. JESUS has also moved above the 50-day moving average (0.00000006201), suggesting short-term bullish momentum. However, it remains below the 200-day moving average, indicating that long-term sentiment has not yet flipped.
The token’s trading range remains tight, with historical support near 0.0000000513 and recent highs around 0.000000071. Trading volume remains modest, implying cautious interest from market participants.
With strong community involvement and recent technical signals, Jesus Coin may continue to draw attention. Watch for sustained volume and price movement above resistance for further confirmation of trend direction.

KASUSDT ShortLooks like KASUSDT is wrapping up an ABCDE reversal pattern right on the daily 50EMA — point E seems to be the final touch.
What stands out is how that 50EMA is acting like a brick wall — price got rejected at A, C, and now again at E.
My target’s the support zone marked on the chart.
I’m not setting a tight stop — too easy to get wicked out by some stop-hunting move.
I’ll only cut the trade if we get multiple candle bodies closing clean above the daily 50EMA.

APEUSDT LongAPEUSDT is pressing against the 50 EMA on the 4H chart. An ABCDE reversal pattern has formed based on Elliott Waves — the setup points to a potential long.
No stop-loss set — there’s a chance of a stop-hunt wick to the downside. I’ll exit the trade if multiple candles close below the zone with their bodies, which would invalidate the setup.
Target is marked on the chart.
