Honeywell Stock Quote | Chart & Forecast SummaryKey Indicators On Trade Set Up In General
1. Push Set Up
2. Range Set up
3. Break & Retest Set Up
Notes On Session
# Honeywell Stock Quote
- Double Formation
* (Reversal Argument)) | Completed Survey
* ((No Trade)) At 175.00 USD | Subdivision 1
- Triple Formation
* (EMA Settings)) Ending At 205.00 USD | Subdivision 2
* (TP1) | Subdivision 3
* Daily Time Frame | Trend Settings Condition
- (Hypothesis On Entry Bias)) | Indexed To 100
- Position On A 1.5RR
* Stop Loss At 96.00 USD
* Entry At 93.00 USD
* Take Profit At 88.00 USD
* (Downtrend Argument)) & Pattern Confirmation (Flag Structure))
* Ongoing Entry & (Neutral Area))
Active Sessions On Relevant Range & Elemented Probabilities;
European-Session(Upwards) - East Coast-Session(Downwards) - Asian-Session(Ranging)
Conclusion | Trade Plan Execution & Risk Management On Demand;
Overall Consensus | Sell
Moving Averages

ACHUSDT ShortThe ACHUSDT ticker has sharply deviated from both the 4-hour and daily EMA50 levels without undergoing a retest. I anticipate a price correction towards these EMAs within the next few days. Targets are marked on the chart.

ARKMUSDT ShortARKMUSDT has pressed up against the 50 EMA on the 4H chart. An ABCDE reversal pattern based on Elliott Waves has formed — all lining up for a short.
No stop-loss set — there’s a chance of a stop-hunt wick to the upside. I’ll exit the trade only if several candles close above the zone with their bodies — in that case, the setup is invalidated.
Short targets are marked on the chart.

Cigna Corporation Stock Quote | Chart & Forecast SummaryKey Indicators On Trade Set Up In General
1. Push Set Up
2. Range Set up
3. Break & Retest Set Up
Notes On Session
# Cigna Corporation Stock Quote
- Double Formation
* (Cup & Handle Structure)) | Completed Survey
* ((No Trade)) & Invalid Wave Structure | Subdivision 1
- Triple Formation
* (EMA Settings)) Ending At 315.00 USD | Subdivision 2
* (TP1) | Subdivision 3
* Daily Time Frame | Trend Settings Condition
- (Hypothesis On Entry Bias)) | Indexed To 100
- Position On A 1.5RR
* Stop Loss At 95.00 USD
* Entry At 93.00 USD
* Take Profit At 102.00 USD
* (Uptrend Argument)) & Pattern Confirmation
* Ongoing Entry & (Neutral Area))
Active Sessions On Relevant Range & Elemented Probabilities;
European-Session(Upwards) - East Coast-Session(Downwards) - Asian-Session(Ranging)
Conclusion | Trade Plan Execution & Risk Management On Demand;
Overall Consensus | Buy

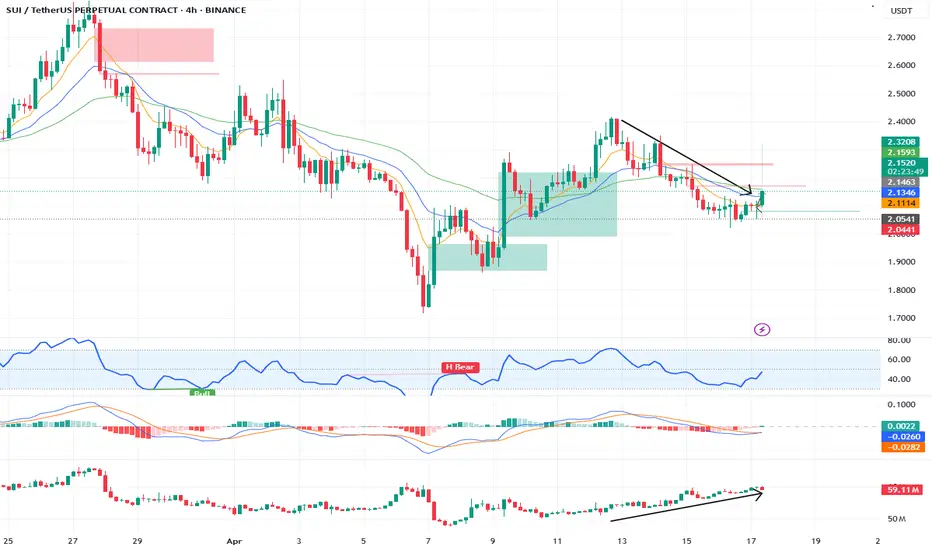
Long setup on SUISetting up long for SUI.
Using 4H time frame.
You can see OI increasing and Price decreasing which is divergence.
Nifty important FIbonacci levels from Previous year closeNIfty important FIbonacci levels from previous year close.
Todays closing was above previous year close.
Previously failed to break previous year close. Lets see what happens.

Is GBPAUD Finally Ready to Drop?Price is currently struggling to break through a key resistance area. That’s not a problem – I’m not looking to catch the entire move, I only need a clean 1:3 RR and potentially the completion of the Asia range.
🔻 Bias: Bearish
On the 4H chart, I’ve identified the 50 EMA as a possible point of rejection, and it lines up perfectly with a 15m POI (Orderblock).
Since the Asia session opened higher, this creates a solid intraday short opportunity targeting the unfilled Asian range.
✅ I’ve marked two potential zones where price could react. If I get clean bearish price action in either zone – such as a BOS on the 1m or strong rejection patterns – I’ll look to execute the short.
Patience until the setup aligns. Let's see how it plays out. 🔍💯

EURGBP Flashes Two Bearish Technical Signals Ahead of LagardeEURGBP is giving negative technical signals ahead of the Lagarde's press conferance. After Trump announced new tariffs, the euro surprisingly gained against the pound. The U.S. imposed tariffs twice as large on the EU compared to the UK, with a minimum of 10% on UK goods. Despite this, the pound weakened more than expected. However, this move might prove to be temporary.
The real focus of ECB will be on the outlook. Recent economic data, combined with the added pressure from tariffs, may push the ECB toward further rate cuts later this year.
President Lagarde has been cautious for some time, offering few forward-looking signals. Today, markets will be closely watching for any hint of future easing. If Lagarde sounds more dovish than expected, the euro could come under renewed bearish pressure.
EURGBP has been forming a head and shoulders-like pattern since the start of last week. It may currently be developing the second shoulder, depending on how the price moves today.
A combination of 8–13 hour moving average crosses and RMI sell signals on the 60-minute chart has successfully captured all local tops since April 7. These same signals have appeared again today. If they prove accurate once more, the 0.8525 support level will be key. This level represents the neckline of the potential head and shoulders pattern.
However, if EURGBP moves above 0.8620, the bearish setup would be invalidated.

Fluence Energy, Inc. Stock Quote | Chart & Forecast SummaryKey Indicators On Trade Set Up In General
1. Push Set Up
2. Range Set up
3. Break & Retest Set Up
Notes On Session
# Fluence Energy, Inc. Stock Quote
- Double Formation
* (A+ Set Up)) At 40.00 USD | Completed Survey
* Wave Feature & Ongoing Wave (3)) | Subdivision 1
- Triple Formation
* (EMA Settings)) + Gap Fill | Subdivision 2
* (TP1) | Subdivision 3
* Daily Time Frame | Trend Settings Condition
- (Hypothesis On Entry Bias)) | Logarithmic Settings
- Position On A 1.5RR
* Stop Loss At 5.00 USD
* Entry At 3.50 USD
* Take Profit At 1.00 USD
* (Downtrend Argument)) & Pattern Confirmation
* Ongoing Entry & (Neutral Area))
Active Sessions On Relevant Range & Elemented Probabilities;
European-Session(Upwards) - East Coast-Session(Downwards) - Asian-Session(Ranging)
Conclusion | Trade Plan Execution & Risk Management On Demand;
Overall Consensus | Sell

Worries about BTC Dominance for your Alts? Bitcoin Dominance Is Very Close to a Downtrend – Altcoin Season Is Near
Bitcoin dominance is likely to enter a downtrend soon—because no uptrend lasts forever. This shift may occur within just a few weeks. As you can see in our current Scenario1
, Bitcoin dominance might sweep its previous high and reverse from there. However, if a daily candle closes above the previous high, then we move into Scenario 2.
In Scenario 2 , we look toward the 0.786 Fibonacci level, which is known as a strong retracement zone. Whenever price reaches this level, it typically experiences a significant pullback or even starts a new downtrend. This gives us two strong confluences already.
The third major confluence is that on the weekly timeframe, the RSI (Relative Strength Index) is consistently showing bearish divergence—which is often a clear signal that a reversal is near.
Fourth confluence 21 EMA is getting close on 1W Time frame breaking 21 Ema can trigger a downtrend for BTC dominance.
Don't lose hope.
In short, Bitcoin dominance is close to reversing, and you just need to be a little more patient. The altcoin season you’ve been waiting for is coming soon.
If you’ve made it this far—after so much pain, so many difficulties, and countless moments of doubt—then hold on just a little longer. Success is near, and your patience will soon be rewarded.
Comment if you like my work and free premium updates like this and follow me to save yourself from losses and being on the wrong side.
Your comment motivates me

Can we hold?!Lowe's is currently sitting at a great support area, 200MA on the weekly chart. As noted on the chart, until the price breaks through that resistance, we continue to consolidate. I'd be surprised if price falls further, but anything is possible. The RSI on the weekly and Monthly are getting into oversold territory, so that can add some optimism. There aren't too many abnormal technicals that pop out overall.
I don't get too political, but obviously, the tariffs are playing into this sector. We'll have to keep an eye on that! I like to keep my analysis strictly from a charting perspective.

Do the Bears have it?So far, I'm sure no one is surprised where we are with SPY. From a charting perspective, we are still in a nice, long-term bullish trend. The short term is the issue. SPY is still trending downward, and until we can break through that upper resistance, I am bearish. We are also sitting right between the 100 & 200ma on the weekly chart, so there is still room for da bears. (I still want SPY @ $466, 200MA.) The good news is, price is making good swings, so you can still carve out wins! Stay optimistic!
C.

Chevron (CVX) / US Dollar Quote | Chart & Forecast SummaryKey Indicators On Trade Set Up In General
1. Push Set Up
2. Range Set up
3. Break & Retest Set Up
Notes On Session
# Chevron (CVX) / US Dollar Quote
- Double Formation
* (A+ Set Up)) At 90.00 USD | Completed Survey
* (Flag Structure) | Subdivision 1
- Triple Formation
* ((No Trade)) & Area Of Value | Subdivision 2
* (TP1) | Subdivision 3
* Daily Time Frame | Trend Settings Condition
- (Hypothesis On Entry Bias)) | Logarithmic Settings
- Position On A 1.5RR
* Stop Loss At 125.00 USD
* Entry At 135.00 USD
* Take Profit At 148.00 USD
* (Uptrend Argument)) & Pattern Confirmation
* Ongoing Entry & (Neutral Area))
Active Sessions On Relevant Range & Elemented Probabilities;
European-Session(Upwards) - East Coast-Session(Downwards) - Asian-Session(Ranging)
Conclusion | Trade Plan Execution & Risk Management On Demand;
Overall Consensus | Neutral

Is PEPE About to Crash from Here? Key Bearish SignalsYello, Paradisers — have you been watching PEPE closely? Because if not, you might be walking right into a trap. We warned about this bearish setup in advance, and right now, PEPEUSDT is flashing multiple red flags that every serious trader needs to be aware of.
💎PEPE is currently sitting under heavy pressure at a confluence of resistance — the 200 EMA, the Fibonacci golden pocket, and a major supply zone. And here’s the critical part: it has just printed a bearish CHoCH (Change of Character), significantly increasing the probability of a deeper move down.
💎On top of that, the daily timeframe is showing bearish divergence, a classic warning sign that momentum is fading, while price tries to push higher. These conditions are aligning to suggest that the bulls may be running out of fuel.
💎If we do get a pullback, there’s potential for a high-probability short entry around the breaker block and the Fair Value Gap (FVG) zones — so keep a close eye there.
💎But be careful — this setup isn’t bulletproof.
💎If PEPE breaks out and closes a candle above our invalidation level, the entire bearish bias gets invalidated. In that case, the best move will be to stay on the sidelines and wait for stronger confirmation. Never force trades — especially in this kind of volatile setup.
🎖Strive for consistency, not quick profits. Treat the market as a businessman, not as a gambler. Our focus remains on executing only the highest-probability setups with proper risk management.
MyCryptoParadise
iFeel the success🌴

Banknifty 15Min crossoverBanknifty 15 Min Crossover formation
Important support and resistance in 15 min timeframe

Nifty 15 Min Crossover
Nifty 15 Min Crossover formation.
Important support and resistance in 15Min timeframe

Uniswap Coin (UNI): 2 Ways To Go | Good Risk:Reward TradesUniswap coin is at a crucial zone where we are going to wait for further confirmations. We have spotted 2 good trades that can be taken on a daily timeframe so we are now going to wait for either a breakout in the form of BoS or a breakdown!
More in-depth info is in the video—enjoy!
Swallow Team

3 Reasons Why Bitcoin Bull Run Is ActivatedThe problem is that the price has not crossed above the 50 EMA.Because of this am not able to say that the rocket booster strategy is activated.
The bottom of the price is the parabolic support and reversal.When the dot is below the price it is showing you that Bitcoin has reached a reverse in price.
3 Reasons Why Bitcoin Bull Run Is Activated
1)The price has hit a reversal.
2)The price has not gone below $74,000.
3)The price is about to cross the 50 EMA.
Before you enter Bitcoin remember to not use margin.Buy the actual satoshi fractions.Place the satoshi in your hardware wallet.
After that sit back for about 3 months.
If you want to learn more about the Rocket Booster Strategy.Then 🚀 Rocket Boost This Content. 🚀 To learn more.
Disclaimer ⚠️ Trading is risky please learn about risk management and profit taking strategies.Also feel free to use a simulation trading account before you use real money.

BTCUSDT shortBTCUSDT has notably deviated from the 4-hour EMA50 — by as much as 2.8%, which is a significant move for this asset.
Additionally, the daily EMA50 is acting as strong resistance, holding the price down.
I expect a pullback within the next couple of days — key levels are marked on the chart.
Want to track such deviations automatically? Send me a DM — I’ll grant you access to the indicator.

COCORO. Do Only Good Everyday.Cocoro price is hold above moving average and if you use the basic strategy through Fibonacci retracement - now is an excellent entry point with 400% potential gain.
" Cocoro is latest family member adopted by Atsuko, the mother of Kabosu (aka Doge). This is the official IP token from the Own The Doge family, fully licensed and authenticated. When you own this token, you're not just collecting something cute - you're helping support Atsuko and non-profits that benefit both humans and dogs! "

GOLD ( XAU/USD) likely to move up from here Take this with a grain of salt. I am no expert, and this is not financial advice.
Technical Analysis (TA):
As we look at the hourly (1hr) timeframe, we can see a strong upward movement followed by a temporary consolidation creating a bullish pennant pattern suggesting a trend continuation. A conservative target puts us at around $3,350 per troy ounce of gold, but we could go as high as $3,494.63 to be exact.
Fundamentals Analysis (FA):
Macroeconomic Uncertainty: I can go into great detail about what is happening, but I would be writing an essay the size of 10 pages, and I don't want to do that now, so here is a quick and simple overview:
Tarrif War between the United States of America and China (as well as other countries) could lead to economic slow downs as well as poor revenue's for companies.
Start-ups are dead. As of today, there has been an alarming rate of start-ups which has been failing and unable to secure funding, and yes I am aware start ups fail all the time and funding dries up, just at the current rate it is scary how many are actively failing where a year back they were alive and well with bright futures and investment potential, investors are running to safe havens such as GOLD to keep their funds safe.
Central banks are expected to pause or even cut rates, which is typically bullish for gold, as lower rates reduce the opportunity cost of holding non-yielding assets.
Geopolitical Tensions: War War War :(

S&P 500 Technical Analysis: Z-Score HMA Indicator OutlookOutside of the obvious news on Tarriffs, let's just focus on technicals for a moment:
In case you’re in a hurry:
My HMA Z-Score Probability Indicator is currently signaling overbought conditions.
The Z-Score has moved into the upper green zone, a level where reversals have historically occurred.
Hull Moving Average (HMA) remains upward for now, but is approaching a potential flattening point.
Price continues to respect a descending trendline, indicating resistance remains intact.
Unless the trendline is broken with conviction, the probability favors a bearish reversion in SPY.
HMA Z-Score Indicator Forecast: SPY Nearing Reversion Risk
This week, my HMA Z-Score Probability Indicator is signaling a statistically significant overbought condition in SPY. In case you are unfamiliar, this tool blends the statistical power of the Z-Score with the responsiveness of the Hull Moving Average to give us high-probability momentum and mean reversion setups.
Let’s break down what it’s showing right now and why a pullback may be imminent.
Z-Score in the Green: What That Means
The Z-Score component of my indicator is now in the upper green zone, which I’ve defined as statistically overbought territory. This isn’t arbitrary, it's based on historical distribution thresholds that flag when price has moved too far, too fast from its average.
In past instances when the Z-Score has reached these levels, the market has often reverted back toward the mean. It's not guaranteed, of course but the odds shift. This is one of the key features of my indicator: identifying these moments where the risk/reward tilts away from chasing price and toward anticipating a reversion.
HMA as a Momentum Filter
The Hull Moving Average (HMA) provides the trend context in this setup. Right now, the HMA is still pointing upward, but it’s starting to show early signs of rounding off. If it begins to flatten or turn downward while the Z-Score remains elevated, that would act as a confirmation of a momentum shift and strengthen the case for a pullback.
The HMA has consistently helped filter out false Z-Score signals when the trend is strong. But when both tools start aligning, that's when I pay closer attention.
Descending Trendline Holding as Resistance
On the chart, I’ve drawn a descending trendline connecting recent swing highs. So far, price has failed to break through this line, continuing a pattern of lower highs.
As long as price respects that line, it suggests sellers are still in control of the short-term structure. If SPY gets rejected again here, particularly while the Z-Score is elevated, the probability of a downside move increases significantly.
Bearish Bias: What the Data Suggests
The core logic behind this setup is based on reversion to the mean. When price extends beyond typical volatility bands (as measured by the Z-Score) and momentum stalls (as reflected by the HMA), it often precedes a return to more normalized levels.
Right now, we have:
A Z-Score reading in overbought territory,
A potentially topping HMA,
Resistance still holding at the descending trendline.
That’s a confluence of signals that, in my indicator's design, suggests a bearish reversion is more likely than a continuation.
What I’m Watching This Week
To confirm the setup, I’ll be watching for:
HMA flattening or beginning to roll over,
Break of recent short-term support to trigger downside momentum.
If these conditions start stacking up, the short bias becomes actionable. If instead we see a breakout above the trendline with conviction and volume, I’ll re-evaluate because no indicator is bigger than price.
The HMA Z-Score Probability Indicator is designed to anticipate high-probability turning points, and right now, it's signaling elevated risk for a short-term reversal in SPY.
As always, these are probabilities, not certainties.

DEATH CROSS on the SP500?We just witnessed the 50-day SMA crossing below the 200-day SMA — a technical signal known as the Death Cross.
Historically, this pattern has been associated with:
Trend reversals from bullish to bearish
Extended downside pressure
A loss of investor confidence in the short-to-medium term
🧠 While not always followed by major crashes, the last time this pattern showed up in a similar setup was followed by an accelerated drop — and that’s exactly what we’ve seen again.
The real question now is: 👉 Was this a false signal or is more downside ahead?
🔍 Keep an eye on price action around the 5,400–5,500 zone. If it fails to recover, this death cross might just be the start of a deeper correction...
