Gold: It may Fall below 3180 todayOver the weekend, Trump announced a pause on tariffs for popular consumer electronics, prompting gold to gap down to 3210 at today’s open;
✅ Our recommended short entries at 3230–3260 are already in profit;
New semiconductor tariff announcements are due during the U.S. session today — the key driver for gold’s next move;
Given the fragile U.S. political/economic backdrop, escalating tariff conflict is unlikely, increasing the chance of bearish impact on gold;
With gold already trading at a premium, any "tariff relief" narrative will likely trigger speculative sell-offs;
If you're holding short positions, consider being patient — avoid premature exits due to emotional reaction to minor pullbacks.
Maintain key short entry zone: 3230 – 3260;
Expect gold to test below 3180 if market sentiment shifts
Moving Averages

$SOL Bullish Engulfing Candle on Weekly CloseBig Bullish Engulfing candle for Solana on the weekly close.
Needs to breakthrough EMA9 and claim as support.
If not, we could see an inverse head and shoulders reversal pattern formed ~$112 before the next leg up.

ZCH LongRe entry on ZCH, plan to buy any pullbacks if it keeps progressing. Will manage SL two weeks behind whilst taking profit at marked levels, hoping to ride longer term.

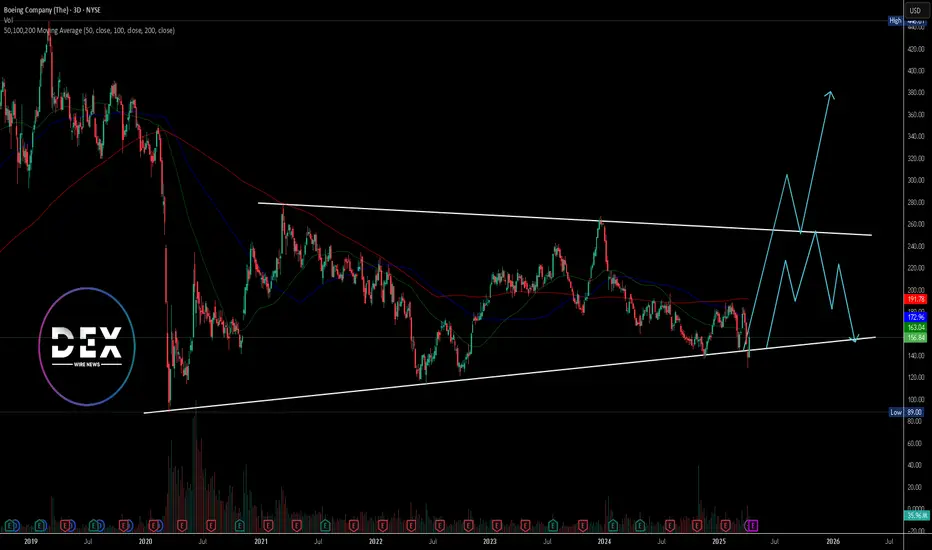
Boeing ($BA) Faces Renewed Scrutiny After Latest Safety ConcernsBoeing (NYSE: NYSE:BA ) stock closed at $156.84 on April 11, gaining 0.85% despite fresh concerns surrounding delayed aircraft deliveries. China's Juneyao Airlines recently postponed the delivery of a 787-9 Dreamliner, originally valued at $120 million. The decision comes amid renewed U.S.-China trade tensions driven by tariff escalations from President Trump’s administration.
This delay could disrupt Juneyao’s planned expansion into European routes this summer. The Dreamliner, known for its long-range capabilities, was central to these international plans. The incident signals how geopolitical strain continues to impact global aviation and commercial aircraft deals.
Boeing has already cautioned that additional tariffs may put more pressure on supply chains. These chains had only recently begun to stabilize following years of pandemic-related disruptions. The company remains exposed to evolving international policies, which can affect order fulfillment and investor sentiment.
Earnings for Boeing are expected on April 23, 2025. Investors are watching closely for guidance on production capacity, deliveries, and any fallout from global trade developments.
Technical Analysis
Boeing is trading within a broad wedge pattern marked by long-term support and resistance trendlines. Price recently bounced from the support, rising sharply to the current level of $156.84. The 50, 100, and 200-day moving averages sit at $163.04, $172.96, and $191.78 respectively.
These levels now act as dynamic resistance. Price remains below all three, signaling overall bearish pressure unless a breakout occurs. A breakout above the resistance trendline may lead to a rally. However, if price fails to gain momentum and breaks below the lower trendline, it could revisit the $89 low from 2020.
Nvidia (NASDAQ: $NVDA) Advances AI Strategy Amid Tariff PauseNvidia (NASDAQ: NASDAQ:NVDA ) is quickly strengthening its positions in artificial intelligence and data center technologies. This comes as the U.S. government temporarily halts new export restrictions, offering relief to the semiconductor sector.
Nvidia will continue selling its H20 AI chips to China following a decision not to enforce new trade limits. This followed a key meeting between CEO Jensen Huang and former President Donald Trump. The announcement eased concerns over losing access to a major international market. Nvidia recently introduced its latest innovation, the Blackwell Ultra AI chips, at the GPU Technology Conference. These chips target the rising demand for high-performance computing used in AI systems. The move could boost Nvidia’s market lead as competition grows.
Market volatility followed the government’s tariff update. Nvidia stock surged nearly 19% after the 90-day tariff pause announcement, excluding China-specific measures. The next day, the stock dropped 5.8% to close at $107.74.
Technical Analysis
Nvidia's price bounced sharply from the $92 support zone. This area has attracted strong buying activity. The RSI is currently at 44, showing neutral market momentum. The key resistance level to watch is $153.13. If the price breaks this level, it could rise toward a new all-time high. Failure to do so may lead to a pullback toward $92.
Watch the $153 level closely for confirmation of trend direction. Nvidia's recent price movement leaves room for both uptrend continuation and short-term correction depending on upcoming market signals.

Bitcoin Cyclical Pattern Analysis: 2017 vs 2025-2026The charts provide compelling evidence of fractal patterns between Bitcoin's 2017 bull run and the current 2025 cycle, revealing both striking similarities and meaningful differences in market behavior.
Key Similarities
Both periods display remarkably similar structural patterns with consistent sequence of movements:
Initial pulldowns (~34% in 2017 vs ~33% in 2025)
Series of uptrends followed by corrective pullbacks
Progressive upward momentum with higher highs and higher lows
Similar number of major price waves (four significant uptrends in each case)
Key Differences
Timeframe Extension: The 2025 cycle shows significantly extended durations compared to
2017
Initial pulldown: 3 weeks (2017) vs 21 weeks (2025) – 7x longer
First major uptrend: 12 weeks (2017) vs 11 weeks (2025) – similar duration
Second uptrend: 12 weeks (2017) vs 14 weeks (2025) – slightly longer
Overall cycle progression is approximately 2-3x longer
Magnitude Reduction: The 2025 cycle shows diminished percentage movements:
First major uptrend: 230% (2017) vs 120% (2025) – roughly half
Second uptrend: 172% (2017) vs 85% (2025) – roughly half
Final uptrend: 253% (2017) vs 125% (2025) – roughly half
Technical Analysis Support
This pattern correlation would likely be supported by other technical indicators:
Bollinger Bands would show:
Similar pattern of band expansion during strong directional moves
Band contraction during consolidation periods before breakouts
2025 likely exhibiting less volatility (narrower bands) but with similar repeating patterns of price touching upper bands during uptrends and lower bands during corrections
Ichimoku Cloud would demonstrate:
Similar cloud breakout patterns preceding major uptrends
Price respecting key Ichimoku components (Tenkan-sen, Kijun-sen) as support/resistance
2025 showing extended time within the cloud during longer consolidation periods
Similar bullish/bearish crossovers of the conversion and base lines, but occurring over longer timeframes
Predictive Value
This comparative lens offers valuable predictive power for several reasons:
Market Psychology Consistency: Despite Bitcoin's maturation, market psychology (fear, greed cycles) remains remarkably consistent, expressed through similar percentage retracements and fractal patterns.
Macro Context Integration: The longer durations and reduced volatility in 2025 reflect Bitcoin's increased market capitalization and institutional adoption, creating a logical evolution of the same underlying patterns.
Specific Forecasting Application: If the pattern correlation holds, we might anticipate:
The current cycle extending into mid-2026
One more major uptrend followed by a 30-40% correction
A final explosive move of approximately 125-150%
Total cycle appreciation significantly less than 2017 but still substantial
Risk Management Framework: These patterns provide clear pivot points for position sizing and risk management, with defined percentage targets and timeframes.
This analysis suggests we're witnessing an evolved expression of the same market dynamics that drove the 2017 cycle, with the extended timeframes and reduced percentage movements reflecting Bitcoin's maturation as an asset class while maintaining its fundamental cyclical character.RetryClaude can make mistakes. Please double-check responses.

Finsbury Growth & Income PLC Quote | Chart & Forecast SummaryKey Indicators On Trade Set Up In General
1. Push Set Up
2. Range Set up
3. Break & Retest Set Up
Notes On Session
# Finsbury Growth & Income PLC Quote
- Double Formation
* (Continuation Argument)) | Completed Survey
* (No Trade)) On 0.786 & 0.5 Retracement Area | Subdivision 1
- Triple Formation
* 012345 Wave Feature / Ongoing Extended Wave 5 Entry Supplement| Subdivision 2
* (TP1) | Subdivision 3
* Daily Time Frame | Trend Settings Condition
- (Hypothesis On Entry Bias)) | Indexed to 100
- Position On A 1.5RR
* Stop Loss At 105.00 GBP
* Entry At 102.00 GBP
* Take Profit At 98.00 GBP
* (Ranging Argument)) & Pattern Confirmation (Cup & Handle)
* Ongoing Entry & (Neutral Area))
Active Sessions On Relevant Range & Elemented Probabilities;
European-Session(Upwards) - East Coast-Session(Downwards) - Asian-Session(Ranging)
Conclusion | Trade Plan Execution & Risk Management On Demand;
Overall Consensus | Sell

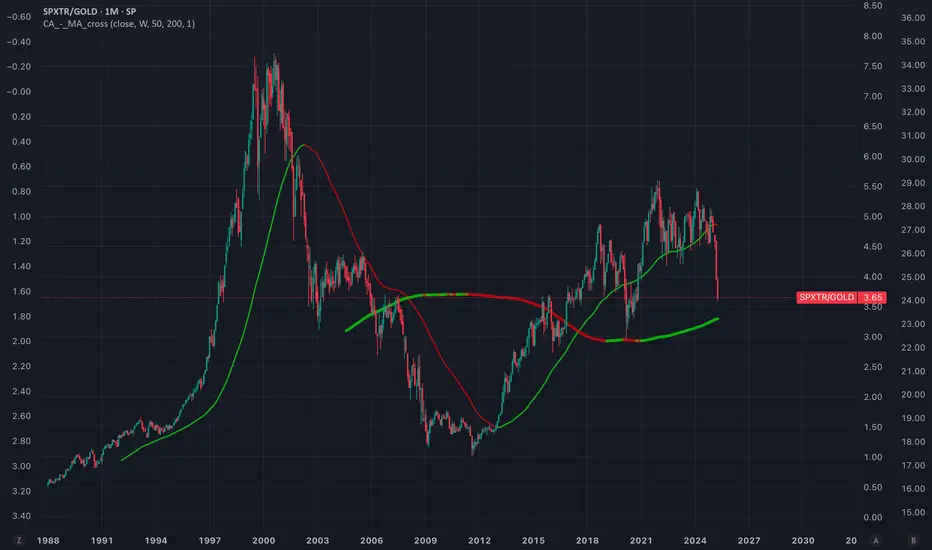
SPX/GOLD ratio near to key supportcrossing below moving average of 200 months could trigger a secular movement in favour of gold.
Potential global debt colapse and lack of confidence in USD + high valuation, mag-7 concentration and high growths expectations on AI are macro/fundamental facts that supports this idea.
XRP: Fresh Gains Ahead? Bullish Setup Intensifies.XRP Price Poised for Potential Breakout? Bulls Eye Fresh Gains Amid Bullish Setup as Open Interest Surges
The cryptocurrency market is a relentless arena of volatility, sentiment shifts, and technical battles. Among the major digital assets, XRP, the native token of the XRP Ledger, often finds itself at the center of intense debate and speculation, largely due to its unique position, technological proposition, and the long-standing regulatory shadow cast by the Ripple vs. SEC lawsuit in the United States. Recently, however, a confluence of factors has ignited discussions about XRP's potential for a significant upward move. With the price consolidating and holding firm above the psychologically crucial $2 mark, coupled with a notable surge in derivatives' open interest, bullish traders are keenly watching for signs that XRP might be coiling up for its next major run.
The Significance of the $2 Threshold: A Psychological and Technical Battleground
Price levels ending in round numbers often act as powerful psychological magnets in financial markets, and $2 is no exception for XRP. Crossing and holding above such a level can signal a significant shift in market sentiment, transforming previous resistance into potential support. For XRP, reclaiming and maintaining ground above $2 carries several implications:
1. Psychological Boost: A sustained presence above $2 instills confidence among existing holders and can attract new buyers who perceive it as a validation of strength. It breaks a mental barrier that may have previously deterred accumulation.
2. Technical Support: Historically significant price levels often become areas where buying interest clusters. If XRP consistently finds buyers stepping in around the $2 mark, it establishes this zone as a credible technical support level. A strong support base is crucial for launching further upside attempts, as it provides a foundation from which bulls can stage rallies.
3. Confirmation of Strength: In technical analysis, breaking above a major resistance level (which $2 may have been previously) and then successfully defending it as support (a "resistance-support flip") is considered a strong bullish signal. It suggests that the underlying demand is robust enough to absorb selling pressure at that level.
The current price action, characterized by XRP holding above $2 despite broader market fluctuations, is therefore a key factor fueling bullish optimism. It suggests resilience and a potential accumulation phase where buyers are absorbing supply, potentially setting the stage for the next leg higher. However, a decisive break below this level could conversely signal weakness and potentially trigger further downside.
Decoding the Bullish Technical Setup: Chart Patterns and Indicators Aligning?
Beyond the $2 level itself, chart patterns and technical indicators are providing further clues that bulls are closely monitoring. While specific patterns evolve rapidly, several common bullish setups could be in play or forming:
1. Consolidation Patterns: Often, before a significant price move (either up or down), an asset enters a period of consolidation. This can take the form of patterns like:
o Ascending Triangles: Characterized by a horizontal resistance line and a rising trendline of support (higher lows). A breakout above the horizontal resistance is typically considered a bullish continuation signal.
o Bull Flags or Pennants: These are short-term continuation patterns that form after a sharp price increase (the "flagpole"). They represent a brief pause before the trend potentially resumes. A breakout above the flag/pennant's upper boundary signals a likely continuation of the prior uptrend.
o Range Consolidation: Price trading sideways between defined support and resistance levels. A decisive break above the range resistance, especially on high volume, can signal the start of a new uptrend.
2. Moving Averages: Key moving averages (MAs) like the 50-day and 200-day simple moving averages (SMAs) are widely watched indicators of medium and long-term trends.
o Golden Cross: A bullish signal occurs when the shorter-term MA (e.g., 50-day SMA) crosses above the longer-term MA (e.g., 200-day SMA). This indicates that short-term momentum is strengthening relative to the long-term trend.
o Price Above Key MAs: XRP trading consistently above both the 50-day and 200-day MAs is generally viewed as a sign of a healthy uptrend. These MAs can also act as dynamic support levels during pullbacks.
3. Momentum Indicators:
o Relative Strength Index (RSI): This indicator measures the speed and change of price movements. An RSI reading above 50 suggests that bullish momentum is dominant, while readings above 70 indicate potentially overbought conditions (though an asset can remain overbought during strong uptrends). A sustained RSI above 50, possibly bouncing off this level during dips, supports a bullish outlook.
o Moving Average Convergence Divergence (MACD): This trend-following momentum indicator shows the relationship between two exponential moving averages (EMAs). A bullish signal occurs when the MACD line crosses above the signal line, especially if this happens above the zero line.
o
If multiple technical indicators and patterns align – for instance, XRP holding above $2, breaking out of a consolidation pattern, trading above key MAs, and showing strong momentum on the RSI and MACD – the case for a potential run becomes significantly stronger.
Open Interest Surges: Fueling the Fire or Adding Risk?
A particularly noteworthy development often accompanying potential price breakouts is a surge in Open Interest (OI) in the derivatives market (futures and perpetual swaps). Open Interest represents the total number of outstanding derivative contracts that have not been settled. It essentially measures the total amount of capital committed to that market.
• Rising OI + Rising Price: This is generally considered a bullish sign. It suggests that new money is flowing into the market, primarily opening long positions, reflecting increasing conviction among buyers that the price will continue to rise. The new longs add buying pressure and fuel the uptrend.
• Rising OI + Falling Price: This is typically bearish, indicating new money is entering to open short positions, betting on further price declines.
• Falling OI + Rising Price: This might suggest that the rally is driven by short-covering (short sellers buying back to close their positions) rather than new buying interest, potentially making the rally less sustainable.
• Falling OI + Falling Price: This often indicates that traders are losing conviction and closing out existing long positions, potentially signaling the end of a downtrend but not necessarily the start of an uptrend.
The reported surge in XRP's Open Interest while the price holds above $2 aligns with the bullish interpretation (Rising OI + Stable/Rising Price). It implies that traders are increasingly betting on upside continuation, adding capital to back their bullish theses.
However, high Open Interest also introduces risks. A large number of leveraged long positions makes the market vulnerable to a "long squeeze." If the price unexpectedly drops (perhaps due to negative news or a broader market downturn), it can trigger cascading liquidations of these leveraged longs. This forced selling adds intense downward pressure, potentially leading to a sharp price crash. Therefore, while rising OI can confirm bullish sentiment, it also amplifies potential volatility in both directions.
Fundamental Factors: The Ever-Present Shadow of the SEC Lawsuit and XRPL Developments
No analysis of XRP is complete without considering the fundamental factors, dominated by the ongoing legal battle between Ripple Labs and the U.S. Securities and Exchange Commission (SEC). The lawsuit, initiated in December 2020, alleges that Ripple conducted an unregistered securities offering through its sales of XRP.
• The SEC Lawsuit: This remains the single most significant factor influencing XRP's price potential, particularly concerning US-based investors and exchanges.
o Positive Outcome/Settlement: A favorable ruling for Ripple, a clear settlement defining XRP as not being a security, or favorable legislation clarifying the status of digital assets could remove a massive cloud of uncertainty. This would likely lead to relistings on US exchanges and potentially trigger a substantial price rally, potentially decoupling XRP somewhat from the broader market trend.
o Negative Outcome: A ruling deeming XRP a security could have severe negative consequences, potentially limiting its utility, hindering adoption (especially in the US), and causing a significant price decline.
o Ongoing Uncertainty: As long as the case drags on, it acts as a headwind, potentially suppressing XRP's price relative to other cryptocurrencies that don't face similar regulatory challenges. Positive developments or perceived wins for Ripple during the legal proceedings often cause short-term price spikes.
• XRP Ledger (XRPL) Developments and Adoption: Beyond the lawsuit, the underlying technology and its adoption matter.
o On-Demand Liquidity (ODL): Ripple's primary use case for XRP, facilitating low-cost, instant cross-border payments, continues to see adoption, primarily outside the US. Growth in ODL volume signifies real-world utility.
o Central Bank Digital Currencies (CBDCs): Ripple is actively engaging with central banks globally, exploring how the XRPL could potentially support CBDC initiatives. Success in this area could significantly boost the ledger's profile and potentially XRP's utility.
o Other Use Cases: Developments around NFTs, decentralized finance (DeFi), and smart contracts on the XRPL, while perhaps less mature than on other blockchains, contribute to the ecosystem's overall value proposition.
Will Buyers Push XRP Further? Potential Targets and Risks
Given the confluence of factors – holding the $2 support, potentially bullish technical setups, and rising open interest – the question remains: can buyers sustain the momentum and push XRP significantly higher?
• Potential Upside Targets: If the bullish scenario plays out and XRP breaks decisively upwards, potential resistance levels and targets could include:
o Recent swing highs (e.g., $2.20, $2.50, depending on recent price action).
o Psychologically important levels ($2.50, $3.00).
o Fibonacci extension levels based on previous price swings.
o The previous all-time high (around $3.40 - $3.84 depending on the exchange data).
• Key Risks: Despite the bullish signals, significant risks persist:
o SEC Lawsuit: Any negative news or ruling remains the primary threat.
o Market-Wide Correction: A downturn in Bitcoin or the broader crypto market could easily drag XRP down, regardless of its individual setup.
o Failure at Resistance: If XRP attempts to rally but fails to break through key overhead resistance levels, it could lead to a reversal.
o Breakdown Below Support: A decisive drop below the $2 support level would invalidate the immediate bullish thesis and could open the door to lower targets (e.g., $1.80, $1.50, or key moving averages).
o OI Liquidation Cascade: As mentioned, high open interest could fuel a sharp sell-off if sentiment sours.
Conclusion: Cautious Optimism Warranted
The current situation for XRP presents a compelling, albeit complex, picture. The ability to hold the crucial $2 support level is a significant show of resilience. Combined with potentially forming bullish technical patterns and a notable surge in open interest suggesting fresh capital inflow and conviction, the ingredients for a potential price run appear to be gathering. Bulls are rightly eyeing fresh gains, encouraged by these developments.
However, caution remains paramount. The cryptocurrency market is inherently volatile, and XRP carries the unique and substantial burden of the SEC lawsuit's uncertainty. While technicals and derivatives data might point towards bullish potential in the near term, fundamental risks and the ever-present possibility of market-wide corrections cannot be ignored. A breakdown below $2 support or negative news from the legal front could quickly invalidate the bullish outlook.
Traders and investors considering XRP must weigh the potentially explosive upside against these considerable risks. Monitoring the $2 level, key resistance zones, developments in the SEC case, and overall market sentiment will be crucial in navigating XRP's next potential move. While the setup looks promising for the bulls, confirmation through decisive price action and continued positive momentum is needed before declaring that XRP is definitively "ready to run."
Disclaimer: This article is for informational purposes only and should not be considered financial advice. Trading cryptocurrencies involves significant risk, and you could lose your entire investment. Always conduct your own thorough research and consult with a qualified financial advisor before making any investment decisions.

CrowdStrike: Member of a Small ClubThe broader market has been tumbling for months, but CrowdStrike has stood its ground.
The first pattern on today’s chart is the March 10 low of $303.79. While the Nasdaq-100 has revisited levels from over a year ago, CRWD has held lows from a month prior. Support at such a recent level may reflect positive sentiment.
Second, Wilder’s Relative Strength Index (RSI) made a higher low as the cybersecurity company made a slightly lower low. That positive divergence could also be viewed as a bullish signal.
Third, the 50-day simple moving average (SMA) had a “golden cross” above the 200-day SMA in November and has stayed there since. Is a longer-term uptrend still in effect?
Speaking of SMAs, CRWD is above its 20- and 200-day SMAs. That puts it in relatively elite clubs: Only 104 members of the S&P 500 are above their 20-day SMAs and just 138 are above their 200-day SMAs, according to TradeStation data.
Those points may also suggest sellers have been less active in the name.
TradeStation has, for decades, advanced the trading industry, providing access to stocks, options and futures. If you're born to trade, we could be for you. See our Overview for more.
Past performance, whether actual or indicated by historical tests of strategies, is no guarantee of future performance or success. There is a possibility that you may sustain a loss equal to or greater than your entire investment regardless of which asset class you trade (equities, options or futures); therefore, you should not invest or risk money that you cannot afford to lose. Online trading is not suitable for all investors. View the document titled Characteristics and Risks of Standardized Options at www.TradeStation.com . Before trading any asset class, customers must read the relevant risk disclosure statements on www.TradeStation.com . System access and trade placement and execution may be delayed or fail due to market volatility and volume, quote delays, system and software errors, Internet traffic, outages and other factors.
Securities and futures trading is offered to self-directed customers by TradeStation Securities, Inc., a broker-dealer registered with the Securities and Exchange Commission and a futures commission merchant licensed with the Commodity Futures Trading Commission). TradeStation Securities is a member of the Financial Industry Regulatory Authority, the National Futures Association, and a number of exchanges.
TradeStation Securities, Inc. and TradeStation Technologies, Inc. are each wholly owned subsidiaries of TradeStation Group, Inc., both operating, and providing products and services, under the TradeStation brand and trademark. When applying for, or purchasing, accounts, subscriptions, products and services, it is important that you know which company you will be dealing with. Visit www.TradeStation.com for further important information explaining what this means.

Nvidia (NASDAQ: $NVDA) Shares Rally Amid AI Sector OptimismShares of Nvidia Corporation (NASDAQ: NASDAQ:NVDA ) have gained over 3% on Friday 11th April. The positive results come after U.S. markets rallied on tariff news. President Trump announced a 90-day pause on new tariffs. Reciprocal tariffs for most countries dropped to 10%, sparking investor optimism.
Major U.S. indices rose sharply following the announcement after being under pressure from rising trade tensions. The pause was seen as a welcome shift toward calmer negotiations.
However, Trump excluded China from this relief. Instead, he stated that tariffs on Chinese goods would increase to 125%. This came after China announced new retaliatory tariffs on U.S. imports. The tough stance toward China contrasted with the softened approach to other countries.
Despite the relief, market uncertainty remains. Investors are unsure whether the rally will last. Ongoing trade disputes, especially with China, could disrupt momentum.
Nvidia's price rose to $110.78, gaining $14.99 on Friday's session. The stock reached an intraday high of $111.53 and a low of $107.48. The current resistance sits at $153.13 high.
Technical Analysis
Nvidia bounced sharply off the $92 support zone, highlighted by strong buying pressure. The RSI sits at 49, indicating neutral momentum. A clear resistance lies near $153.13 high. If Nvidia breaks this level, a move toward $180 is likely. If it fails, price may revisit the $92 zone. Two scenarios are possible. The stock could either continue upward to $180 or face rejection and fall back. Watch the $153 level closely for confirmation.

Ishares 20+ Treasury Bond | TLT | Long in the $90sIshares 20+ Treasury Bond NASDAQ:TLT are particularly sensitive to interest rates: the price moves up when they are lowered and down when they rise. Locally, I'm witnessing banks lower their interest rates for CDs and shorten the duration for those with high-yielding returns. The general political rhetoric, especially due to the election cycle, is a push for the Federal Reserve to drop them. Now, despite the possible negative economic implications of lowering interest rates too soon if inflation is high, there is a good probability they may be lowered (even slightly) in 2024... perhaps September?
This analysis isn't to time the bottom perfectly, though. Instead, it's a probability assessment. Personally, TLT in the low $90s is in a long-term "buy-zone".
Target #1 = $104
Target #2 = $122
Target #3 = $170+ (very long-term view / economic crash... let's hope not, though)


AvalonBay Inc Stock Quote | Chart & Forecast SummaryKey Indicators On Trade Set Up In General
1. Push Set Up
2. Range Set up
3. Break & Retest Set Up
Notes On Session
# Avalon Bay Communities Inc Stock Quote
- Double Formation
* (EMA Settings)) At 205.00 USD | Completed Survey
* (Downtrend Argument)) | Subdivision 1
- Triple Formation
* 0.5 Retracement Area | Short Set Up | Subdivision 2
* (TP1) | Subdivision 3
* Daily Time Frame | Trend Settings Condition
- (Hypothesis On Entry Bias)) | Logarithmic Settings
- Position On A 1.5RR
* Stop Loss At 200.00 USD
* Entry At 189.00 USD
* Take Profit At 170.00 USD
* (Downtrend Argument)) & Pattern Confirmation
* Ongoing Entry & (Neutral Area))
Active Sessions On Relevant Range & Elemented Probabilities;
European-Session(Upwards) - East Coast-Session(Downwards) - Asian-Session(Ranging)
Conclusion | Trade Plan Execution & Risk Management On Demand;
Overall Consensus | Sell

Chips May Have Broken DownThe Philadelphia Semiconductor Index has been skidding lower, and some traders may think it’s broken support.
The first pattern on today’s chart is last April's low of 4288. SOX bounced at that level last August and on March 11. But the index slid below it last week and this week peaked near the same zone. Has old support become new resistance?
Second, the 8-day exponential moving average (EMA) is under the 21-day EMA. That may reflect a bearish short-term trend.
Wednesday’s high was near the 21-day EMA. The index stalled at that line and quickly fell back below its 8-day EMA.
Next, the recent high was near a 50 percent retracement of the selloff that began in late January. That may also confirm its downward trend.
TradeStation has, for decades, advanced the trading industry, providing access to stocks, options and futures. If you're born to trade, we could be for you. See our Overview for more.
Past performance, whether actual or indicated by historical tests of strategies, is no guarantee of future performance or success. There is a possibility that you may sustain a loss equal to or greater than your entire investment regardless of which asset class you trade (equities, options or futures); therefore, you should not invest or risk money that you cannot afford to lose. Online trading is not suitable for all investors. View the document titled Characteristics and Risks of Standardized Options at www.TradeStation.com . Before trading any asset class, customers must read the relevant risk disclosure statements on www.TradeStation.com . System access and trade placement and execution may be delayed or fail due to market volatility and volume, quote delays, system and software errors, Internet traffic, outages and other factors.
Securities and futures trading is offered to self-directed customers by TradeStation Securities, Inc., a broker-dealer registered with the Securities and Exchange Commission and a futures commission merchant licensed with the Commodity Futures Trading Commission). TradeStation Securities is a member of the Financial Industry Regulatory Authority, the National Futures Association, and a number of exchanges.
TradeStation Securities, Inc. and TradeStation Technologies, Inc. are each wholly owned subsidiaries of TradeStation Group, Inc., both operating, and providing products and services, under the TradeStation brand and trademark. When applying for, or purchasing, accounts, subscriptions, products and services, it is important that you know which company you will be dealing with. Visit www.TradeStation.com for further important information explaining what this means.

Silver at a Crossroads: More Pain or a Rally Above 34?Silver is undergoing a potential trend change. The previous yellow uptrend channel has been broken, and a new, nearly flat-slightly downward channel (marked by blue lines) appears to be forming. While it may be too early to confirm this as an established trend, the structure is developing with increasing clarity.
Silver is now at a crossroads. The former trendline is being retested, and just above it lies a confluence of resistance: a previous demand zone and the 200-day moving average. These former support levels have now merged into a strong resistance area.
Unless this resistance zone is broken, downward pressure is likely to persist. However, a breakout could open the door for a medium-term move toward the 34 level.
Please check gold/silver chart for longer term understanding:

How To Find The #1 Stock To TradeHello in this video we dive deep
into using the screener
on trading view to find the best
stocks, and forex trades.
Also we look at what happened with the
US stock market crash as well.Its a very powerful video.
Because i am showing you all my trading secrets.
This knowledge is based on self education.So i would
encourage you to do you own research as it may not be
accurate.But life is full of ideas and
so look at my videos as brianstorming sessions.
Hopefully these brainstorming sessions will help you
on your trading journey.
Watch this video to learn more.
Disclaimer: Trading is risky please learn risk management and
profit taking strategies.Also feel free to use a
simulation trading account
before you trade with real money.

"Disbelief Rally" back to 52 week HighsPrior plunges below this custom weekly Keltner channel have a good track record of highlighting buying opportunities. In simile terms.. when markets plunge too much and too fast, a great accumulation occurs with wild oscillations. After the accumulation will come a "disbelief rally" where the market will continue to rip higher in a concave down curve to the previous 52 week high leaving market participants in disbelief that we didn't retest the plunge levels again. Each dip in this "disbelief rally" becomes a great opportunity for long-style trades.

USD/CAD bears eyeing deeper downside flushUSD/CAD bears will be eyeing a meaningful downside flush with the pair breaking and closing beneath the 200-day moving average on Thursday, hitting fresh year-to-date lows in the process.
The price now finds itself below 1.3947, the high set in August last year. The break may encourage others to join the bearish move, generating a setup where shorts could be established with a stop placed above the level for protection.
1.38115 screens as an initial target, with other minor levels such as 1.3748, 1.3700 and 1.3647 also in play. Momentum indicators favour retaining a bearish bias, with RSI (14) trending strongly lower but not yet oversold. MACD further bolsters the bearish signal.
If the price were to reverse back above the 200DMA, the overall bearish bias would be invalidated.
Good luck!
DS

U.S. Steel (X) Shares Drop 10% Following Presidential CommentsUnited States Steel Corporation (NYSE: NYSE:X ) shares dropped sharply after remarks from former President Donald Trump. He opposed the company's potential sale to Japan's Nippon Steel. Trump said he admired Japan but opposed the sale of an iconic American steel company.
He described U.S. Steel as “a very special company” and tied it to national interests. His statement caused a wave of uncertainty in the market. The stock dropped 15% shortly after the news. During extended trading, it fell as much as 16%.
As of 11:41 AM EDT, the stock trades at $42.03, down $3.11 (6.89%), as trading volume hits 19.7 million shares. Investors are concerned about the deal's future. U.S. Steel is central to U.S. economic and industrial discussions.
The takeover deal has raised questions about manufacturing and national security. The company is expected to report earnings between April 30 and May 5, 2025.
Technical Analysis
The 3-day chart shows a long-term uptrend. Price respects an ascending trendline starting at$16 in June 2022. Support lies above the 200-day moving average at $34.44. The 50-day and 100-day moving averages sit at $37.51 and $38.76, respectively.
The stock recently broke above $45 but pulled back after Trump's comments. Resistance lies at $50.20 and a breakout above this level could lead to further gains. The 3-day RSI sits at 55.89, suggesting neutral momentum that has room for the price to cover without reading an overbought reading.
However, a sharp drop could push it lower. Volume surged on the sell-off, confirming a strong market reaction. Adding to the bullish momentum is a complete head and shoulder pattern that signals potential recovery.
The short-term outlook depends on deal clarity and upcoming earnings. However, the trend remains intact above $34, and a move below could signal further downside.

Nickel Commodity Quote Settings | Chart & Forecast SummaryKey Indicators On Trade Set Up In General
1. Push Set Up
2. Range Set up
3. Break & Retest Set Up
Notes On Session
# Nickel Stock Quote
- Double Formation
* ((Triangle Structure)) | Completed Survey
* 012345 Wave Feature & Ongoing Wave (3)) | Subdivision 1
- Triple Formation
* (Continuation Argument)) | Short Set Up | Subdivision 2
* (TP1) | Subdivision 3
* Daily Time Frame | Trend Settings Condition
- (Hypothesis On Entry Bias)) | Logarithmic Settings
- Position On A 1.5RR
* Stop Loss At 17.100 USD
* Entry At 14.600 USD
* Take Profit At 10.900 USD
* (Downtrend Argument)) & Pattern Confirmation
* Ongoing Entry & (Neutral Area))
Active Sessions On Relevant Range & Elemented Probabilities;
European-Session(Upwards) - East Coast-Session(Downwards) - Asian-Session(Ranging)
Conclusion | Trade Plan Execution & Risk Management On Demand;
Overall Consensus | Sell

This 3 Step System Say Gold Is A Good BuyWhen you look at this chart you will notice that
the price of Gold has crossed down the parabolic SAR.
This is a very important thing for you to take note of
--
Because this indicator shows you that Gold TVC:GOLD
is in a good buy.When you understand this system,
you will begin to see buy opportunities.
--
This opportunities will work together.When you
see this collaboration, it will show you that
you are on the right path.
--
Another thing you see on this chart
are 3 steps:
1-The price is above the 50 EMA
2-The price is above the 200 EMA
3-The price has gapped up on the Parabolic SAR
--
That last step is very important for you
to remember.
Rocket boost this content to learn more
-------------------------------------------------------------------
Disclaimer: Trading is risky please learn risk
management and profit taking strategies.
Also feel free to use a simulation trading account.

$BTC Not Out Of The Weeds Yet - Must Break $84kIf CRYPTOCAP:BTC can break back above ~$84k then we could continue to follow my OG setup (yellow) and rip,
but since PA dumped slightly below the 50WMA it technically invalidated my inverse h & s idea.
A rejection of $84k would dump us back to ~$78k to form the right shoulder (red) and complete the setup.
nonetheless, i believe we've seen the bottom 👋
