₿itcoin Dominance New Cycle High 66% ₿itcoin Dominance reaches new cycle high tapping 66%
If there's one thing I learned this cycle, it's never to sell your CRYPTOCAP:BTC for Alts.
If you want to play the casino, play with USD 💯
Moving Averages

Beating the S&P 500 with TradingView's Stock ScreenerThis is Mo from MWRIGHT TRADING. The date is Friday, June 27th, 2025.
This video is about selecting stocks that collectively have the potential to consistently beat the S&P 500
I look for smooth and consistent long-, mid-, and short-term performance. For that we need
Building a Screener
What I look for
- Liquidity - that means money, or trading volume.
- Room to move - no overhead resistance
- Favorable trends - stable moving averages
- Good short term signals - a good intraday chart
Filters
- Market Cap 300M to 2B
Not too big, and not too small
- Perf 10Y > Perf 5Y
No long term dips in performance
- Perf 5Y > Perf 1Y
No short term dips in performance
- SMA(300) < Price
Price above moving average
- SMA(200) < Price
Price above moving average
- Avg Volume 10D > 100K
No lightly traded stocks. Liquidity needed
- + SMA(200) >= SMA(300)
Stacked long-term SMAs
- + SMA(50 >= SMA(200)
Stacked short-term SMAs
- + ROE, Trailing 12 Months > 0% (Chris Mayer)
Improving ROE
Examples
- SENEA
- DGII
Review the charts
- Verify short term performance
- Multi-VWAP (1 hr Chart) - Free Indicator
- Above a rising 5-Day AVWAP
- Magic Order Blocks (5 min Chart) - Free Indicator
- No major overhead resistance
- Verify fundamentals and long term performance
- ROE (Quarterly) - TV Indicator
- Rising ROE
- Float Shares Outstanding - TV Indicator
- Lower float means lower supply. When high demand occurs, this can act as a price catalyst.
- Multi VWAP from Gaps - Free Indicator
- Stacked is good
- 3 SMA Ladies - Custom Indicator
- Stacked is good

War is a Racket | DFEN | Long at $28.00The war machine keeps turning. Profits will reign. Direxion Aerospace and Defense 3x AMEX:DFEN never fully recovered from pandemic lows, but world peace is (unfortunately) far from reach. The uptrend in the chart has commenced. Personal entry point at $28.00.
Target #1 = $37.00
Target #2 = $50.00
Target #3 = $64.00

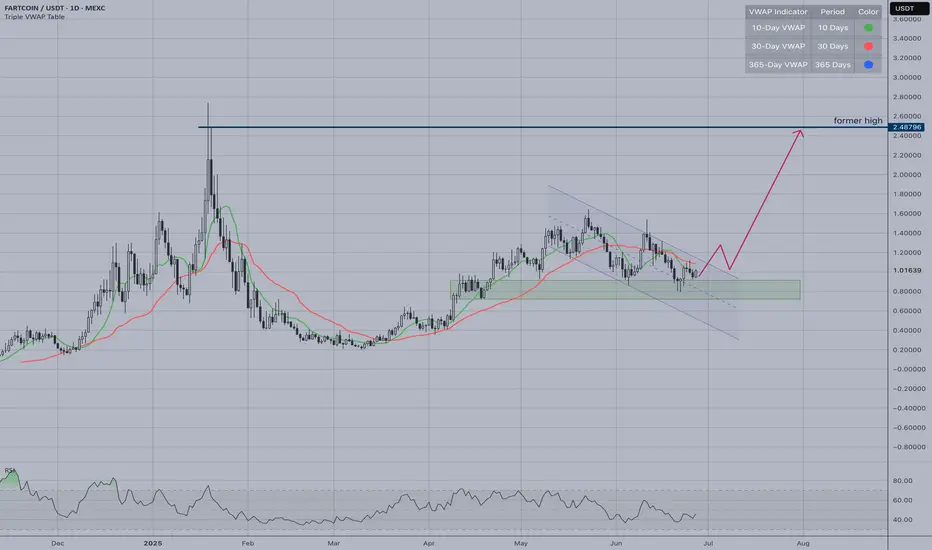
FARTCOIN | VWAP-30 Cross SetupAfter its massive 2025 rally, this consolidation could be preparing for the next leg higher. FARTCOIN has been one of the standout meme coin performers, making this technical setup particularly interesting for momentum traders.
Current Situation:
Price: ~$1.01, trading below 30-day VWAP (red line)
Consolidating in support zone ($0.80-1.00)
Waiting for break above VWAP resistance
The Setup:
VWAP crosses are significant technical signals. When price breaks above the 30-day VWAP with volume, it often indicates renewed institutional interest and can trigger sustained rallies.
Key Levels:
Support: $0.80-1.00 (current consolidation)
Resistance: 30-day VWAP + $1.20-1.30
Target: Previous high at $2.48
MOIL - Potential for 500 target with Crown pattern in makingMOIL has confirmation for Bullish crown formation .
It has closed above 20 & 50 EMA on day time frame.
Moreover MACD is signal line has turned positive.
With all this it has potential for following targets;
360 / 400 / 450 / 500
SL: 315

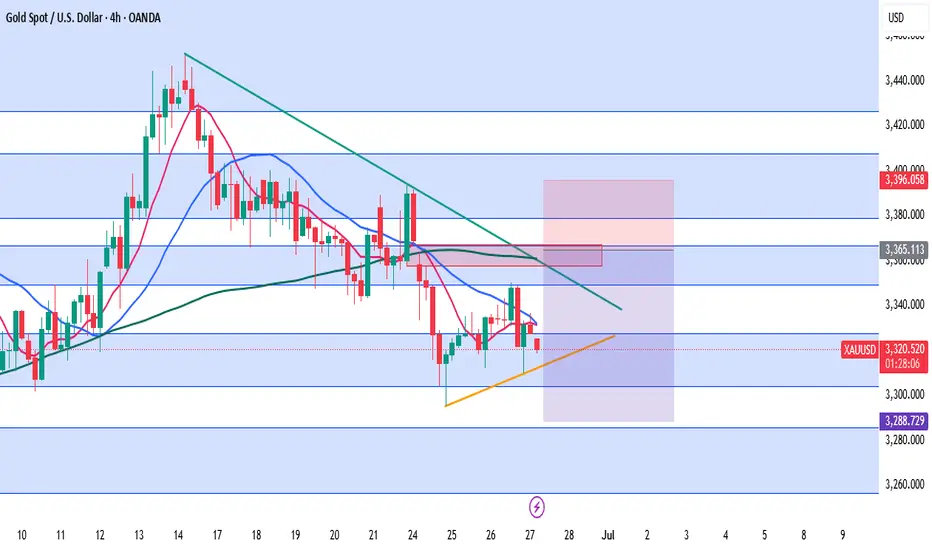
XAUUSD – Key Inflection Zone Before Core PCE Price Index m/mGold opened today with a bearish gap, once again struggling to stay above the 3327–3305 support zone, the same range where it hovered yesterday. While the price did form a higher low and higher high structure on the lower timeframes, this move still lacks the strength to signal a proper reversal—rather, it looks more like a minor consolidation ahead of tonight’s US GDP and Unemployment Claims release.
At this point, gold is trapped between two key forces:
A resilient resistance zone formed by the downtrendline, unfilled gap from earlier this week, and confluence of MA50 & MA200
A rising minor support trendline, creating a tightening range and indicating that the next breakout may provide a clearer direction.
⚠️ Technical Outlook
As long as gold remains below 3366–3367, the prevailing downtrend structure remains valid. Any rally into that zone should be viewed cautiously, especially if accompanied by weak volume or rejection candles. However, if gold manages to break and close H4 above 3367, it could trigger a short-term correction toward 3396 or even higher, aiming to fill the previous gap.
But so far, the momentum remains bearish, and lower highs continue to dominate the mid-term structure.
🔽 Trade Idea (Cautious Swing Trade)
Due to the wide stop-loss required, we recommend using reduced position size to maintain proper risk management.
🔵 Sell Area: 3358 – 3367
❌ Stop Loss: 3396 (above the trendline and prior key high)
🎯 Take Profit 1: 3331
🎯 Take Profit 2: 3306
🎯 Take Profit 3: 3289
🧠 Risk Level: Moderate to High (Lot size should be adjusted)
R3: 3379
R2: 3366
R1: 3350
Pivot: 3327
S1: 3305
S2: 3286
S3: 3256
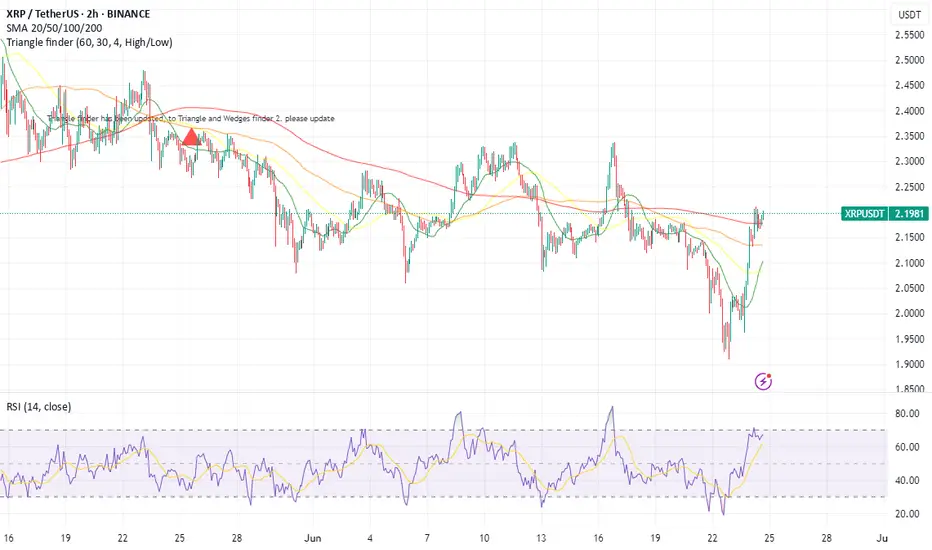
XRP to $3? Searches Surge as Whale Activity Hints at Price Boom
XRP, the cryptocurrency developed by Ripple Labs, has long been a subject of intense speculation and debate within the crypto community. Despite facing regulatory hurdles and market volatility, XRP has maintained a dedicated following, fueled by its potential to revolutionize cross-border payments. Recently, searches for "XRP to $3" have surged, reflecting renewed optimism among investors as the token exhibits signs of increased whale activity, institutional buying, and rising retail interest.
This article delves into the factors driving the renewed interest in XRP, examining the recent price movements, whale activity, and technical indicators that suggest a potential surge to $3. We will analyze the significance of the breakout above $2.20, the consolidation phase below this level, and the potential for XRP to reach $3.40. Furthermore, we will explore the factors that could either support or hinder XRP's ascent, providing a nuanced perspective on the potential for this cryptocurrency to reach new heights. By synthesizing these insights, we aim to offer a comprehensive overview of the factors that could shape XRP's price trajectory in the coming months.
Whale Activity and Institutional Buying: A Bullish Signal?
One of the key factors driving the renewed interest in XRP is the observed increase in whale activity. Whales, defined as individuals or entities holding large amounts of a particular cryptocurrency, can have a significant impact on market prices due to their ability to execute large buy or sell orders.
Recent data suggests that whales have been accumulating XRP, with whale-to-exchange transfers dropping to zero. This indicates that whales are not selling their XRP holdings, but rather holding onto them or even buying more. This accumulation by whales is often seen as a bullish signal, as it suggests that they believe the price of XRP is likely to increase in the future.
In addition to whale activity, there are also signs of increasing institutional buying of XRP. Institutional investors, such as hedge funds, asset managers, and corporations, are increasingly allocating capital to cryptocurrencies, including XRP. This increased institutional adoption can drive up the price of XRP and provide a more stable foundation for its long-term growth.
Breakout Above $2.20: A New Support Level
Another factor driving the renewed interest in XRP is the recent breakout above $2.20. This breakout is significant because it confirms a new support level for XRP. A support level is a price level at which buyers are likely to step in and prevent the price from falling further.
The breakout above $2.20 suggests that there is strong buying pressure for XRP at this level. This buying pressure could be driven by a combination of factors, including whale activity, institutional buying, and rising retail interest.
Consolidation Below $2.20: A Pause Before the Next Rally?
After breaking out above $2.20, XRP has entered a period of consolidation below this level. This consolidation phase is a normal part of the market cycle, allowing the market to digest the recent gains and prepare for the next leg up.
During the consolidation phase, the price of XRP is likely to fluctuate within a narrow range. This fluctuation can create opportunities for traders to buy low and sell high, but it can also be a period of uncertainty for investors.
The key question is whether the consolidation phase is a temporary pause before another rally or a sign that the breakout above $2.20 was a false signal. If the price can hold above $2.20 and eventually break out above the upper resistance levels, it would confirm the validity of the breakout and increase the likelihood of XRP reaching $3.
Potential for XRP to Reach $3.40: A Technical Target
Several analysts have suggested that XRP could potentially reach $3.40 in the near future. This target price is based on technical analysis, which involves studying price charts and other market data to identify patterns and predict future price movements.
One of the technical indicators that suggests a potential rally to $3.40 is the bull flag pattern. The bull flag is a bullish continuation pattern that signals a continuation of an existing uptrend. If XRP can break out above the upper trendline of the bull flag, it could potentially reach $3.40.
Another technical indicator that suggests a potential rally to $3.40 is the Fibonacci retracement levels. Fibonacci retracement levels are horizontal lines that are drawn on a price chart to identify potential support and resistance levels. If XRP can break above the Fibonacci retracement levels, it could potentially reach $3.40.
Technical Indicators: CMF and MACD Show Bullish Momentum
In addition to the bull flag pattern and Fibonacci retracement levels, other technical indicators also suggest that XRP is poised for a potential rally.
The Chaikin Money Flow (CMF) is a technical indicator that measures the amount of money flowing into or out of an asset. A positive CMF value indicates that money is flowing into the asset, which is a bullish signal. The CMF for XRP is currently positive, suggesting that there is strong buying pressure for the cryptocurrency.
The Moving Average Convergence Divergence (MACD) is a technical indicator that shows the relationship between two moving averages of an asset's price. A bullish MACD crossover occurs when the MACD line crosses above the signal line, which is a bullish signal. The MACD for XRP is currently showing a bullish crossover, suggesting that the cryptocurrency is poised for a potential rally.
Factors Hindering XRP's Ascent
While there are several factors that suggest XRP could reach $3 or even $3.40, it is important to acknowledge that there are also factors that could hinder its ascent.
• Regulatory Uncertainty: XRP has faced regulatory challenges in the past, and ongoing regulatory uncertainty could dampen investor sentiment and prevent the cryptocurrency from reaching its full potential. The lawsuit filed by the Securities and Exchange Commission (SEC) against Ripple Labs continues to cast a shadow over XRP's future.
• Market Volatility: The cryptocurrency market is known for its volatility, and sudden price swings could wipe out gains and deter investors.
• Competition: XRP faces competition from other cryptocurrencies and traditional payment systems.
• Demand Fades: If demand for XRP fades, the price could fall back to previous support levels, such as $1.54.
XRP Bulls On Alert: 'This Trendline Is Everything'
Despite the potential challenges, XRP bulls remain optimistic about the cryptocurrency's future. Many analysts have emphasized the importance of a key trendline, stating that "this trendline is everything." This trendline represents a critical support level that must be maintained for XRP to continue its upward trajectory.
If XRP can hold above this trendline, it would signal that the bullish momentum remains intact and that the cryptocurrency is on track to reach its potential targets. However, if the price breaks below this trendline, it could indicate that the bullish momentum is fading and that a further correction is likely.
XRP Price Prediction: Possible Bullish Moves Ahead
Based on the current market conditions, technical indicators, and whale activity, there are signs that suggest possible bullish moves ahead for XRP. However, it is important to remember that the cryptocurrency market is inherently unpredictable, and there is no guarantee that XRP will reach $3 or $3.40.
Investors should carefully consider the risks involved and conduct thorough research before making any investment decisions. It is also important to diversify your portfolio and avoid putting all of your eggs in one basket.
Conclusion
Searches for "XRP to $3" have surged, reflecting renewed optimism among investors as the token exhibits signs of increased whale activity, institutional buying, and rising retail interest. The breakout above $2.20, the consolidation phase below this level, and the potential for XRP to reach $3.40 are all factors that have contributed to this renewed interest.
However, it is important to acknowledge that there are also factors that could hinder XRP's ascent, such as regulatory uncertainty, market volatility, and competition. Investors should carefully consider the risks involved and conduct thorough research before making any investment decisions.
Ultimately, the future of XRP's price will depend on a complex interplay of technical factors, market sentiment, and fundamental developments. By staying informed and using proper risk management techniques, investors can position themselves to potentially profit from XRP's continued growth and success. As always, remember to consult with a qualified financial advisor before making any investment decisions. The potential for XRP to reach $3 offers a tantalizing glimpse of potential gains, but prudent analysis and risk mitigation are essential for navigating the volatile world of cryptocurrency.
Swing D1 Double TopHigherHigh > HigherLow structure is broken.
LowerHigh > LowerLow has formed, so the main trend is Short at present.
Trendline break until it occurs, until then the Long direction is lost.
MovingAverage retest may give strength to another Long trend...

#PAXGUSDT #1D (ByBit) Head & Shoulders near breakdownPax Gold printed a shooting star and is losing 50MA now, on daily.
Seems on the verge of a big retracement down towards 200MA support, once neckline is broken.
⚡️⚡️ #PAXG/USDT ⚡️⚡️
Exchanges: ByBit USDT
Signal Type: Regular (Short)
Leverage: Isolated (9.0X)
Amount: 4.9%
Entry Targets:
1) 3349.94
Take-Profit Targets:
1) 3049.06
Stop Targets:
1) 3500.75
Published By: @Zblaba
LSE:PAXG BYBIT:PAXGUSDT.P #1D #PaxGold TVC:XAU
Risk/Reward= 1:2.0
Expected Profit= +80.8%
Possible Loss= -40.5%
Estimated Gaintime= 1.5 months

BNB to Make History Before 2026 BeginsCRYPTOCAP:BNB is setting up for something big. Price is holding strong above the rising support line, with the 50 EMA acting as dynamic support.
It's consolidating just below the all-time high — a classic sign of strength. Structure looks solid, momentum is building, and the chart favors bulls.
Mark my words — BNB will not only retest its ATH, but break it and go beyond before the year ends.
DYOR, NFA

RELIANCE Croosed resistance, strong sentiments supporting upmove. Strong trend reversal clearly visible in weekly timeframe.

NZD/JPY: Bullish Breakout or Another Fade?NZD/JPY hasn’t closed above the 200-day moving average since July 2024, racking up more than ten failed bullish breaks in that time—seven of them in the past month alone. If today’s probe finds more traction, it could be the catalyst to bring bulls off the sidelines, especially on a close above 88.00 where wedge and horizontal resistance intersect.
If that plays out, traders could look to initiate longs above 88.00 with a stop below it or the 200-day moving average for protection. Minor resistance sits at 88.39, offering a nearby hurdle for the setup. Should that give way, 89.20 or 90.00 stand out as logical upside targets.
Alternatively, if the pair fails at the 200-day moving average again, the setup could flip, allowing shorts to be established beneath the level with a stop above for protection. 87.00 or wedge support around 50 pips lower may come into play as downside targets.
Momentum indicators favour upside near term. RSI (14) has broken its downtrend and moved further above 50, while MACD is on the cusp of a bullish crossover, confirming the signal.
Good luck!
DS

Ferrovial SE Stock Quote | Chart & Forecast SummaryKey Indicators On Trade Set Up In General
1. Push Set Up
2. Range Set Up
3. Break & Retest Set Up
Notes On Session
# Ferrovial SE Stock Quote
- Double Formation
* (Retest & Entry))
- Zone Feature Area - *Uptrend Condition | Completed Survey
* (A+ SIgnal)) - *Short Reversal | Subdivision 1
- Triple Formation
* (P1)) / (P2)) & (P3)) | Subdivision 2
* (TP1) = a / Long Consecutive Range
* (TP2) = b / Short Consecutive Pullback | Subdivision 3
* Daily Time Frame | Trend Settings Condition
- (Hypothesis On Entry Bias)) | Indexed To 100
- Position On A 1.5RR
* Stop Loss At 107.00 EUR
* Entry At 110.00 EUR
* Take Profit At 115.00 EUR
* (Uptrend Argument)) & No Pattern Confirmation
* Ongoing Entry & (Neutral Area))
Active Sessions On Relevant Range & Elemented Probabilities;
European-Session(Upwards) - East Coast-Session(Downwards) - Asian-Session(Ranging)
Conclusion | Trade Plan Execution & Risk Management On Demand;
Overall Consensus | Buy

Bark | BARK | Long at $0.84BARK, Inc. NYSE:BARK is a dog-focused company offering subscription-based products like BarkBox and Super Chewer, delivering monthly toys, treats, and pet supplies. It operates in Direct-to-Consumer and Commerce segments, selling through its website, retail partners, and e-commerce platforms. While not overly bullish here, especially given the economic / recession-fear headwinds, I think this is one of those stocks that may have a future "pop" as interest rates are lowered, or news emerges of the company expanding to new retail partners. A few insiders have recently purchased shares (~$75k under $1.00) and others have been awarded options. The book value currently rests near $0.64. It may dip between that price at $0.50 in the near-term. However, that's just been the trajectory of SO many of these SPAC stocks... dip then pop or bust.
Fundamentally, nothing to uproar over and this is a risky investment (Nasdaq delisting may occur). The positive is the debt-to-equity in 0.9x, which is pretty good for a small company. But 2026 is expected to be its worst earnings year. The future may look bright in 2027 and beyond, but can the company last? Time will tell.
Thus, for a swing trade, NYSE:BARK is in a personal buy zone at $0.84 with a risk of further near-term decline between $0.50 and $0.64.
Targets into 2027
$0.95 (+13.1%)
$1.25 (+48.8%)

(Daytring) APPL quickly trade1. Premarket created a support line
2. Sma 200,50 is here
3. Price goes up in the moring just pull back to retest.
=> entry. Take profit whenever i feel good

#RLCUSDT #1D (Binance Futures) Descending wedge on supportiExec RLC just printed a dragonfly doji which may have marked the bottom on daily.
A morning star is drawing now, recovery towards 100EMA resistance seems around the corner.
⚡️⚡️ #RLC/USDT ⚡️⚡️
Exchanges: Binance Futures
Signal Type: Regular (Long)
Leverage: Isolated (4.0X)
Amount: 5.9%
Current Price:
0.9126
Entry Targets:
1) 0.9002
Take-Profit Targets:
1) 1.1854
Stop Targets:
1) 0.7859
Published By: @Zblaba
GETTEX:RLC BINANCE:RLCUSDT.P #DePIN #AI #iExec iex.ec
Risk/Reward= 1:2.5
Expected Profit= +126.7%
Possible Loss= -50.8%
Estimated Gaintime= 1 month

#AXSUSDT #4h (Bitget Futures) Falling wedge breakout and retestAxie Infinity just pulled back to 50MA support where it's bouncing, looks ready for recovery towards 200MA resistance and more.
⚡️⚡️ #AXS/USDT ⚡️⚡️
Exchanges: Bitget Futures
Signal Type: Regular (Long)
Leverage: Isolated (4.0X)
Amount: 4.7%
Current Price:
2.509
Entry Zone:
2.489 - 2.407
Take-Profit Targets:
1) 2.758
2) 2.991
3) 3.224
Stop Targets:
1) 2.189
Published By: @Zblaba
NYSE:AXS BITGET:AXSUSDT.P #4h #AxieInfinity #P2E axieinfinity.com
Risk/Reward= 1:1.2 | 1:2.1 | 1:3.0
Expected Profit= +50.7% | +88.7% | +126.8%
Possible Loss= -42.3%
Estimated Gaintime= 1-2 weeks

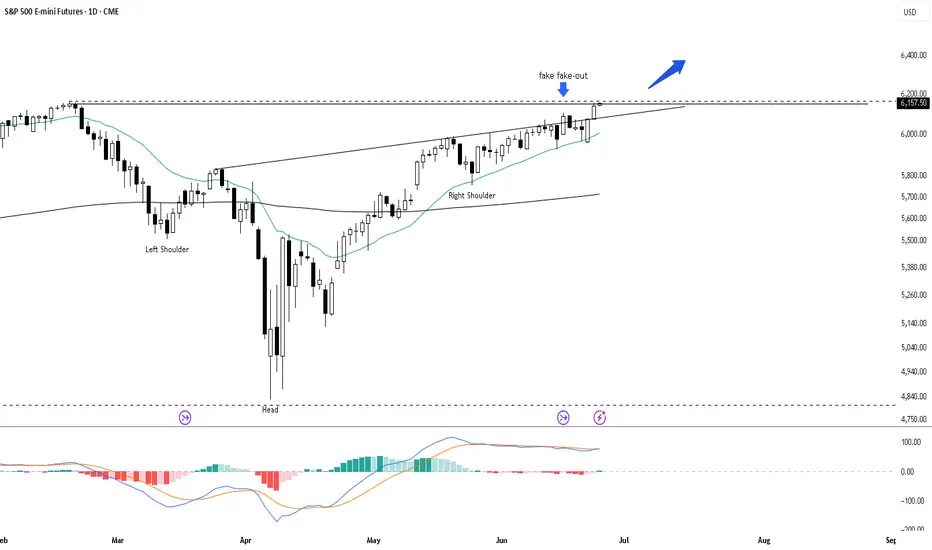
SPX Bullish Breakout: 18% Upside to $7,300The S&P 500 has broken out of an inverse head and shoulders formation, targeting approximately $7,300 within three months. The MACD shows strong bullish momentum with a recent crossover above the signal line. The price is holding above the 21-day EMA, further confirming bullish momentum.
SMCI: When a chart says it’s time to reconnect with the AI hypeOn the daily chart, Super Micro Computer Inc. (SMCI) is showing a clean bullish setup. Price broke out of a descending trendline (green dashed), confirmed it with a retest, and is now consolidating above the breakout zone. The golden cross — where the MA50 crossed above the MA200 — confirms a long-term trend reversal.
Volume profile indicates strong accumulation near $41–43. The 0.5 Fibonacci level at $41.84 acted as support. Above the current range, there’s low volume resistance up to $63.57 (0.786), followed by $66.44 and a final extension target at $79.82 (1.272).
Fundamentals: SMCI is a leading server hardware manufacturer. Demand for their systems has soared with the explosion of AI infrastructure. The company maintains solid financials, with rising quarterly revenue and growing presence in the cloud sector. Institutional investors have been actively increasing their positions since late 2023 — a sign of strong long-term conviction.
Tactical plan:
— Entry: market $42–43
— Target 1: $55.91
— Target 2: $63.57
When technicals scream textbook breakout and fundamentals bring AI momentum to the table — it might just be one of the best late entries in the AI wave this summer.

(Daytrading) APPL going upH1 chart is respecting the uptrend.
Price has retested the 50 SMA on the H1 timeframe.
Price also touched the Ichimoku Cloud on H1.
→ Based on the risk-to-reward ratio, I’m expecting a Call position.

Gold Slips on Ceasefire — Bearish Momentum Continues Below 3350XAUUSD Analysis – June 25, 2025
Gold slipped significantly and dropped by 1.79% following eased geopolitical tensions after a ceasefire agreement between Israel and Iran. As risk appetite recovered and the USD strengthened sharply, Gold finally broke below the key support at $3,350, falling straight to the next support level around $3,304.
This clean and aggressive sell-off suggests that sellers are still dominating the short-term market structure. Technically, Gold is now trading within a new support range of $3,304–$3,327, while the broader trend remains clearly bearish.
🔍 Technical Outlook:
After the break of 3,350, we can observe that price is forming lower highs and lower lows. The previous high is still located at 3,395, which makes any swing trade risky due to wide stop losses.
However, given the sharp drop, a short-term correction toward 3,327–3,336 is possible before another leg down. The current structure supports shorting the retracement, as long as no bullish reversal pattern emerges on the H4 or D1 timeframe.
📌 Trading Plan (Intraday / Short-term idea):
🔻 Sell Limit: 3,327
❌ Stop Loss: 3,337
🎯 Take Profit: 3,305
⚠️ Use a small lot size due to the 100-pip stop.
This is a short-term plan, best executed in the M15–H1 timeframe. We avoid swing entries until a better structure is confirmed.
📊 Key Levels (Pivot System):
R3: 3,379
R2: 3,366
R1: 3,350
Pivot: 3,327
S1: 3,305
S2: 3,286
S3: 3,256
💬 Summary:
Gold continues its bearish momentum. Watch closely for potential short-term correction toward 3,327–3,336. As long as price fails to break above 3,336 or form a bullish engulfing structure, we remain cautiously bearish.

Biogen Inc Stock Quote | Chart & Forecast SummaryKey Indicators On Trade Set Up In General
1. Push Set Up
2. Range Set Up
3. Break & Retest Set Up
Notes On Session
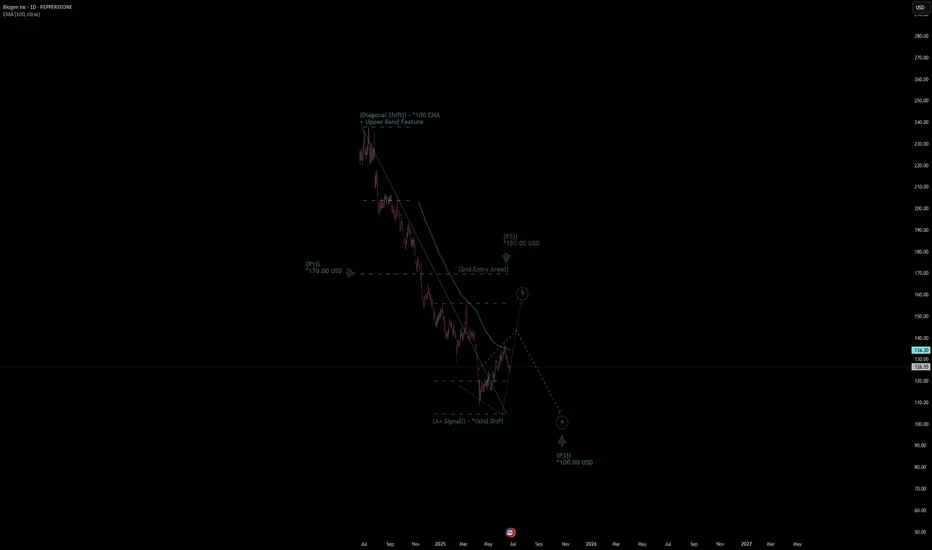
# Biogen Inc Stock Quote
- Double Formation
* (Diagonal Shift)) - *100 EMA | Completed Survey
* (A+ SIgnal)) - *Valid Shift | Subdivision 1
- Triple Formation
* (P1)) / (P2)) & (P3)) | Subdivision 2
* (TP1) = a / Long Consecutive Range
* (TP2) = b / Short Consecutive Pullback | Subdivision 3
* Daily Time Frame | Trend Settings Condition
- (Hypothesis On Entry Bias)) | Regular Settings
- Position On A 1.5RR
* Stop Loss At 143.00 USD
* Entry At 127.00 USD
* Take Profit At 103.00 USD
* (Downtrend Argument)) & No Pattern Confirmation
* Ongoing Entry & (Neutral Area))
Active Sessions On Relevant Range & Elemented Probabilities;
European-Session(Upwards) - East Coast-Session(Downwards) - Asian-Session(Ranging)
Conclusion | Trade Plan Execution & Risk Management On Demand;
Overall Consensus | Sell
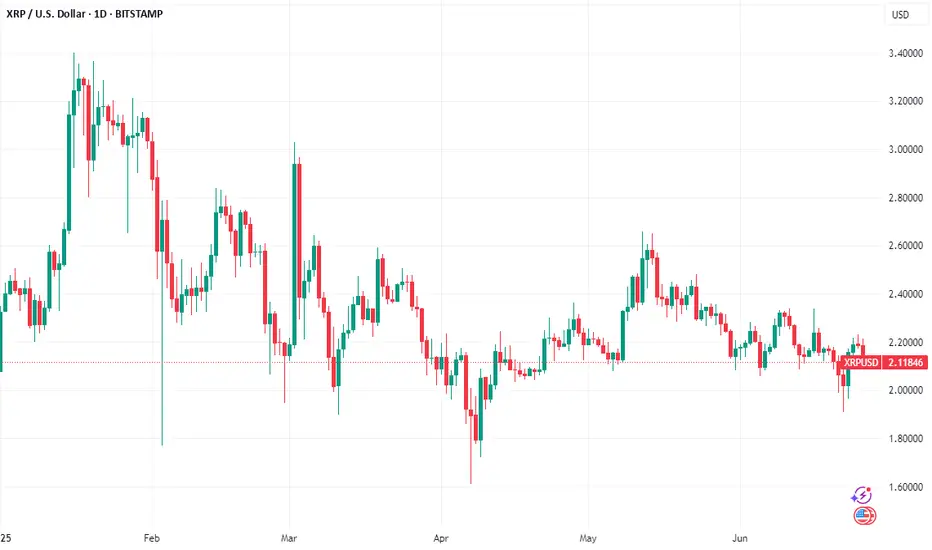
XRP Price Soars Past $2.15: Next Stop $2.38? XRP Price Prediction: What’s Next After Breaking $2.15 Resistance?
Ripple’s XRP has been making waves in the cryptocurrency market, recently breaking above the critical $2.15 resistance level and surging nearly 8% in the last 24 hours to trade at $2.18. With a further 9% climb in recent sessions and open interest jumping to $3.77 billion, the coin is showing strong bullish momentum. Analysts are now eyeing targets of $2.33 and even $2.38 in the near term. But what lies ahead for XRP after this breakout? Is this the start of a sustained rally, or could resistance at higher levels cap the gains?
________________________________________
XRP Price Action: Breaking Key Resistance at $2.15
XRP’s recent price surge has caught the attention of traders and investors alike. After trading in a consolidation range for weeks, the cryptocurrency initiated a fresh increase from the $1.92 zone, gaining momentum as it approached the $2.00 level. A significant development came when XRP broke above a key bearish trend line with resistance at $2.00 on the hourly chart of the XRP/USD pair (data sourced from Kraken). This breakout was followed by a decisive move past the $2.15 resistance, a level that had previously capped upward movements.
Currently, XRP trades above $2.18, sitting comfortably above the 100-hourly Simple Moving Average (SMA), a widely watched indicator of short-term trend direction. The price action over the last 24 hours shows an 8.2% increase, with some sessions recording gains as high as 14%, particularly following geopolitical developments like the Iran-Israel ceasefire, which boosted risk assets across markets. This recovery from the $1.90 low demonstrates strong buying interest and renewed confidence in XRP’s potential.
The immediate question for traders is whether XRP can sustain this momentum. The next resistance zone lies between $2.20 and $2.33, with some analysts even targeting $2.38 based on rising open interest and market volume. A close above $2.18 in the coming hours could signal the start of another leg up, while failure to hold this level might see a pullback toward $2.10 or lower.
________________________________________
Technical Analysis: Bullish Indicators and Key Levels to Watch
To understand XRP’s potential trajectory, let’s dive into the technical indicators and key levels shaping its price action.
Support and Resistance Levels
• Support: The $2.10 level, previously a resistance, now acts as a near-term support alongside the 100-hourly SMA. A break below this could see XRP test the $2.05 zone, with further downside potential to $1.92 if bearish pressure mounts.
• Resistance: The immediate hurdle lies at $2.20, a psychological barrier that has historically posed challenges. Beyond this, $2.33 emerges as a critical target, as breaking this level could confirm a short-term bullish continuation. Analysts also highlight $2.38 as a feasible target if momentum persists.
Moving Averages and Trend Indicators
XRP’s position above the 100-hourly SMA is a bullish sign, indicating that buyers are in control of the short-term trend. Additionally, the price recently crossed above the 50-hourly SMA during its 14% surge, further reinforcing the bullish outlook. The convergence of these moving averages suggests that a golden cross—a bullish signal where a shorter-term average crosses above a longer-term average—could be forming on lower timeframes, potentially attracting more buyers.
Relative Strength Index (RSI)
The RSI on the hourly chart currently sits around 65, indicating that XRP is approaching overbought territory but still has room to run before reaching extreme levels (above 70). This suggests that the current rally could extend further, provided no major negative catalysts emerge.
Volume and Open Interest
One of the most encouraging signs for XRP bulls is the surge in trading volume and open interest. Open interest in XRP futures has jumped to $3.77 billion, reflecting growing speculative interest and confidence in further price gains. High volume accompanying the breakout above $2.15 adds credibility to the move, as it indicates genuine market participation rather than a low-liquidity pump.
Symmetrical Triangle Pattern
On the longer-term charts, XRP has been forming a 334-day symmetrical triangle, a consolidation pattern often preceding major breakouts. Analysts predict that this pattern could resolve between July and September 2025, with potential targets ranging from $2 to $5 depending on the direction of the breakout. The recent move above $2.15 could be an early indication of bullish intent, though confirmation of a full breakout from the triangle remains months away.
________________________________________
XRP Price Prediction: Short-Term Outlook (Next 24-48 Hours)
Given the current momentum, XRP appears poised for further gains in the immediate term. Analysts predict a potential 7% move toward $2.33 within the next 24 hours if the price maintains its position above $2.18. This target aligns with the upper boundary of the recent trading range and represents a key Fibonacci retracement level from the prior downtrend.
However, traders should remain cautious of the $2.20 resistance zone, where selling pressure could emerge. A failure to close above this level on the hourly or 4-hour charts might trigger profit-taking, leading to a pullback toward $2.10 or $2.05. On the flip side, a decisive break above $2.20 with strong volume could pave the way for a test of $2.33 and potentially $2.38 in the coming days.
________________________________________
What XRP Users Are Talking About This Week: Rumors, Predictions, and Debates
The XRP community has been abuzz with discussions this week, fueled by the coin’s impressive price action and broader market developments. Here are some of the key topics dominating conversations on platforms like Twitter, Reddit, and crypto forums:
1. Geopolitical Impact on XRP: The recent Iran-Israel ceasefire has been credited with boosting risk-on sentiment across markets, including cryptocurrencies. Many XRP holders believe this event contributed to the 14% surge that saw the price reclaim $2.00, with some speculating that further de-escalation could drive additional gains.
2. Regulatory Clarity for Ripple: Ongoing debates about Ripple’s legal battle with the U.S. Securities and Exchange Commission (SEC) continue to influence sentiment. While a resolution seems closer than ever, with rumors of a potential settlement circulating, uncertainty remains a key concern. A favorable outcome could act as a major catalyst for XRP, potentially pushing it toward new highs.
3. Adoption and Utility: XRP users are excited about Ripple’s continued partnerships with financial institutions for cross-border payments. Recent announcements of pilot programs in new regions have fueled speculation that increased adoption could drive organic demand for XRP, supporting long-term price appreciation.
4. Price Predictions: Community predictions range from conservative targets of $2.50 in the near term to more ambitious forecasts of $5 or higher by the end of 2025. Much of this optimism hinges on the symmetrical triangle breakout expected next year, as well as broader market trends like the Bitcoin halving in 2024.
These discussions highlight the mix of optimism and caution within the XRP community. While the recent breakout has bolstered confidence, many users remain wary of external factors like regulatory developments and macroeconomic conditions that could impact the coin’s trajectory.
________________________________________
XRP Climbs 9% as Open Interest Jumps to $3.77B: Eyes $2.38 Target
XRP’s 9% climb in a recent session, coupled with open interest soaring to $3.77 billion, underscores the growing interest from both retail and institutional traders. Open interest represents the total value of outstanding derivative contracts, and its sharp increase suggests that market participants are betting on continued price movement—likely to the upside given the current trend.
This surge in open interest aligns with XRP’s break above $2.15, reinforcing the notion that the rally has strong backing. Analysts now eye a $2.38 target, which corresponds to the 61.8% Fibonacci retracement level from the previous major swing high to low. Achieving this target would require sustained buying pressure and a break above the $2.33 resistance, but the current market dynamics suggest it’s within reach if no major sell-offs occur.
However, high open interest also introduces the risk of volatility. If the price fails to break higher and sentiment shifts, a wave of liquidations could amplify downside moves. Traders should monitor funding rates on futures platforms to gauge whether speculative positions are becoming overly leveraged, as this could signal an impending correction.
________________________________________
Ceasefire Boosts XRP Recovery: Bullish Continuation
Above $2.33?
The geopolitical landscape has played a surprising role in XRP’s recent recovery. Following a low of $1.90 amid broader market uncertainty, the announcement of a ceasefire between Iran and Israel injected optimism into risk assets, including cryptocurrencies. XRP responded with a 14% jump to reclaim the $2.00 level, a move that has since solidified with the break above $2.15.
This recovery highlights XRP’s sensitivity to external catalysts. While technical factors like resistance levels and chart patterns drive day-to-day price action, macro events can act as significant tailwinds or headwinds. If the ceasefire holds and global markets remain stable, XRP could see continued buying interest from investors seeking exposure to high-growth assets.
The key level to watch now is $2.33. A break above this resistance with strong volume could confirm a short-term bullish continuation, potentially targeting $2.38 or higher. Conversely, if geopolitical tensions resurface or broader market sentiment sours, XRP might struggle to maintain its gains, with $2.10 acting as the first line of defense.
________________________________________
When Will XRP Price Hit All-Time High? Timeline Revealed
XRP’s all-time high (ATH) of $3.84, reached during the 2017-2018 bull run, remains a distant target for many holders. However, recent technical developments and market trends provide clues about when the coin might approach or surpass this level.
Symmetrical Triangle Breakout: July–September 2025
As mentioned earlier, XRP has been forming a 334-day symmetrical triangle on the weekly chart, a pattern characterized by converging trendlines as price swings narrow over time. Such patterns often precede significant breakouts, with the direction determined by market sentiment at the time of resolution. Analysts predict that this triangle could break between July and September 2025, offering a window for a major price move.
If the breakout is bullish, targets range from $2 (a conservative estimate based on prior resistance) to $5 (a more optimistic projection based on the triangle’s height). A $5 target would represent a new ATH, surpassing the 2018 peak by over 30%. This scenario assumes favorable market conditions, including a broader crypto bull run potentially triggered by the Bitcoin halving in 2024.
Factors Influencing an ATH
Several factors could influence whether XRP reaches a new ATH within this timeline:
• Regulatory Resolution: A positive outcome in Ripple’s SEC lawsuit could remove a major overhang, unlocking significant upside potential.
• Market Cycles: Crypto markets often follow cyclical patterns, with bull runs occurring every 3-4 years. If 2025 aligns with the next cycle peak, XRP could ride the wave to new highs.
• Adoption Growth: Increased use of XRP for cross-border payments through RippleNet could drive organic demand, supporting a higher price floor.
• Macro Environment: Favorable economic conditions, such as low interest rates or stimulus measures, could boost risk assets like XRP.
While predicting an exact date for an ATH is impossible, the July–September 2025 window provides a reasonable timeframe for a potential breakout. Investors should remain attentive to technical confirmation and external catalysts as this period approaches.
________________________________________
XRP Price Reclaims Key Resistance: Are More Gains on the Horizon?
XRP’s reclaiming of the $2.10 and $2.15 levels marks a significant milestone in its recovery from the $1.92 low. This move above key resistance zones suggests that bullish momentum is building, with the potential for further gains if higher levels are breached.
The price is now trading above $2.18, and a close above $2.20 could signal the start of a fresh increase. However, the $2.20-$2.33 range remains a critical battleground. Bulls will need to defend recent gains while pushing for a decisive break above these levels to confirm the next leg up. If successful, targets of $2.38 and beyond come into play, aligning with analyst predictions and Fibonacci extensions.
On the downside, a failure to hold $2.10 could see XRP retest lower supports at $2.05 or $1.92. Such a pullback would not necessarily invalidate the bullish trend but could delay the anticipated rally toward higher targets. Traders should use stop-loss orders and monitor volume trends to manage risk during this volatile period.
________________________________________
Long-Term XRP Price Prediction: $2 to $5 by 2025?
Looking beyond the immediate term, XRP’s long-term outlook remains optimistic, contingent on several key developments. The symmetrical triangle pattern, if resolved bullishly, could propel XRP toward $2-$5 by the end of 2025. This range accounts for both conservative and aggressive scenarios, with the higher end assuming a full market cycle peak and positive catalysts like regulatory clarity.
Even in a more cautious scenario, XRP appears well-positioned to reclaim its prior highs above $3 if adoption continues to grow and broader crypto sentiment remains favorable. Key drivers include Ripple’s expansion into new markets, potential listings on major exchanges post-SEC resolution, and technological upgrades to the XRP Ledger that enhance scalability and utility.
However, risks remain. Regulatory setbacks, competition from other payment-focused cryptocurrencies, and macroeconomic downturns could cap XRP’s upside. Investors with a long-term horizon should diversify their portfolios and remain adaptable to changing market conditions.
________________________________________
Conclusion: XRP’s Path Forward After $2.15 Breakout
XRP’s recent breakout above the $2.15 resistance has ignited optimism among traders and investors, with the coin now trading at $2.18 after an 8.2% surge in 24 hours. Technical indicators like the 100-hourly SMA and rising open interest of $3.77 billion support a bullish near-term outlook, with targets of $2.33 and $2.38 in sight if momentum holds. The geopolitical boost from the Iran-Israel ceasefire and ongoing community discussions about adoption and regulation further fuel the narrative of potential gains.
In the short term, XRP must overcome resistance at $2.20 to confirm the next leg up, while holding support at $2.10 to avoid a pullback. Looking further ahead, the symmetrical triangle pattern suggests a major breakout window between July and September 2025, with price targets ranging from $2 to $5—potentially marking a new all-time high if conditions align.
While challenges like regulatory uncertainty and market volatility persist, XRP’s current trajectory indicates that more gains could be on the horizon. Traders and investors should stay vigilant, monitoring key levels, volume trends, and external catalysts to capitalize on this evolving opportunity. Whether XRP sustains its rally or faces a correction, one thing is clear: the cryptocurrency remains a focal point of excitement and speculation in the ever-dynamic crypto market.