ETH - kiss of death repeating pattern confirmed - now what?Fact: Every time in history that we have closed a breakthrough candle on the monthly chart through the 21 SMA on ETHUSD, we have entered a bear market.
Fact: We did just that with February's monthly candle.
The same exact pattern has repeated 3x already.
Will this be any different this time?
Moving Averages

Engulfing candle as Entry and target using FibonacciMy Script is a personal experience of trading. i am looking for Engulfing candle to and validate the bias then i will make an entry position. my SL and TP is according to the Fibonacci calculation. that is why the target is dynamic defend on the result of Fibonacci.

#ZECUSDT #1D (Binance Futures) Descending channel breakoutZcash broke-out printing a morning star, looks good for recovery towards 100EMA resistance.
⚡️⚡️ #ZEC/USDT ⚡️⚡️
Exchanges: Binance Futures
Signal Type: Regular (Long)
Leverage: Isolated (2.0X)
Amount: 5.9%
Current Price:
36.12
Entry Zone:
36.05 - 33.55
Take-Profit Targets:
1) 41.83
1) 47.12
1) 52.42
Stop Targets:
1) 28.92
Published By: @Zblaba
SEED_DONKEYDAN_MARKET_CAP:ZEC BINANCE:ZECUSDT.P #1D #Zcash #Privacy z.cash
Risk/Reward= 1:1.2 | 1:2.1 | 1:3.0
Expected Profit= +40.4% | +70.8% | +101.3%
Possible Loss= -33.8%
Estimated Gaintime= 1-2 months

BTC | 4H - 1W | MACRO UpdateBTC has seen a clear bearish trend in the 4h timeframe, after the cup and handle pattern failed to play out. We also notice consecutive lower lows and lower highs, a key sign of a bearish trend.
The technical indicators have turned bearish, and from a macro timeframe is shows a stairstep down may be on the cards.
The moving averages in the daily has turned bearish as we lose the 200d MA.
I hate to say it - but BTC is in full fledge bear mode 🐻
________________
BINANCE:BTCUSDT

How Long Can Micron Hang On?Micron Technology has remained above a key level despite weakness in the broader market. Is it vulnerable to a breakdown?
The first pattern on today’s chart is the September 12 low of $84.12. MU has remained above that level, but would-be sellers may watch for a potential close below that support.
Second, the 50-day simple moving average (SMA) is below the 100-day SMA. Both are under the 200-day SMA. That may suggest its longer-term trend has gotten more bearish.
Third, our 2 MA Ratio script in the lower study shows the 8-day exponential moving average (EMA) has crossed below the 21-day EMA. That may suggest bears are gaining an edge in the short term.
Next, TradeStation data shows MU is the twelfth-busiest options underlier in the S&P 500. (Average volume in the last month is about 175,000 contracts per session.) That could make some traders look to position for moves with calls and puts.
Finally, earnings after the closing bell on March 20 may serve as a potential catalyst for movement.
TradeStation has, for decades, advanced the trading industry, providing access to stocks, options and futures. If you're born to trade, we could be for you. See our Overview for more.
Past performance, whether actual or indicated by historical tests of strategies, is no guarantee of future performance or success. There is a possibility that you may sustain a loss equal to or greater than your entire investment regardless of which asset class you trade (equities, options or futures); therefore, you should not invest or risk money that you cannot afford to lose. Online trading is not suitable for all investors. View the document titled Characteristics and Risks of Standardized Options at www.TradeStation.com . Before trading any asset class, customers must read the relevant risk disclosure statements on www.TradeStation.com . System access and trade placement and execution may be delayed or fail due to market volatility and volume, quote delays, system and software errors, Internet traffic, outages and other factors.
Securities and futures trading is offered to self-directed customers by TradeStation Securities, Inc., a broker-dealer registered with the Securities and Exchange Commission and a futures commission merchant licensed with the Commodity Futures Trading Commission). TradeStation Securities is a member of the Financial Industry Regulatory Authority, the National Futures Association, and a number of exchanges.
Options trading is not suitable for all investors. Your TradeStation Securities’ account application to trade options will be considered and approved or disapproved based on all relevant factors, including your trading experience. See www.TradeStation.com . Visit www.TradeStation.com for full details on the costs and fees associated with options.
Margin trading involves risks, and it is important that you fully understand those risks before trading on margin. The Margin Disclosure Statement outlines many of those risks, including that you can lose more funds than you deposit in your margin account; your brokerage firm can force the sale of securities in your account; your brokerage firm can sell your securities without contacting you; and you are not entitled to an extension of time on a margin call. Review the Margin Disclosure Statement at www.TradeStation.com .
TradeStation Securities, Inc. and TradeStation Technologies, Inc. are each wholly owned subsidiaries of TradeStation Group, Inc., both operating, and providing products and services, under the TradeStation brand and trademark. When applying for, or purchasing, accounts, subscriptions, products and services, it is important that you know which company you will be dealing with. Visit www.TradeStation.com for further important information explaining what this means.

‘Death Cross’ in Las Vegas SandsLas Vegas Sands has been trying to overcome weakness in travel stocks, but some traders may see downside risk.
The first pattern on today’s chart is the December high around $56, slightly above the peak in February 2024. Its failure to break out could suggest the casino operator is trapped in a range.
Second, the August low of $36.62 may be viewed as the potential bottom of the range. Does that create a potential space below Monday’s close of $45.34?
Third, LVS has been unable to stay above either its 50-day simple moving average (SMA) or its 200-day SMA.
Finally, the 50-day SMA just formed a “death cross” below the 200-day SMA. That may suggest its longer-term trend is weakening.
TradeStation has, for decades, advanced the trading industry, providing access to stocks, options and futures. If you're born to trade, we could be for you. See our Overview for more.
Past performance, whether actual or indicated by historical tests of strategies, is no guarantee of future performance or success. There is a possibility that you may sustain a loss equal to or greater than your entire investment regardless of which asset class you trade (equities, options or futures); therefore, you should not invest or risk money that you cannot afford to lose. Online trading is not suitable for all investors. View the document titled Characteristics and Risks of Standardized Options at www.TradeStation.com . Before trading any asset class, customers must read the relevant risk disclosure statements on www.TradeStation.com . System access and trade placement and execution may be delayed or fail due to market volatility and volume, quote delays, system and software errors, Internet traffic, outages and other factors.
Securities and futures trading is offered to self-directed customers by TradeStation Securities, Inc., a broker-dealer registered with the Securities and Exchange Commission and a futures commission merchant licensed with the Commodity Futures Trading Commission). TradeStation Securities is a member of the Financial Industry Regulatory Authority, the National Futures Association, and a number of exchanges.
TradeStation Securities, Inc. and TradeStation Technologies, Inc. are each wholly owned subsidiaries of TradeStation Group, Inc., both operating, and providing products and services, under the TradeStation brand and trademark. When applying for, or purchasing, accounts, subscriptions, products and services, it is important that you know which company you will be dealing with. Visit www.TradeStation.com for further important information explaining what this means.

EURCAD resistance zoneEURCAD is close to the multi-year resistance zone from where we could have a good opportunity for a pullback and a return to the bearish side.

Bad situation in IHSG IDXA lower low has formed, and the price has broken through all key moving averages. This might suggests a confirmed downtrend from here.

SP 500 is heading downThe S&P 500 appears to be losing its upward momentum, with a confirmed double top and key moving averages breaking down. A bearish reversal may be underway.

BTC reaction at the 200SMA is looking WICKED BTC is my leading market indicator so once spy pulls back 15% or so I’ll be looking for BTC to find a bottom.
It’s March and the market is going down as seasonality run its course. A healthy correction in Spy should be around 15% however -2/+2 could be more precise. The chart is labeled with 15% as the ideal support. I’ll be looking for January 2026 calls for yearly end targets based off analyst projections.

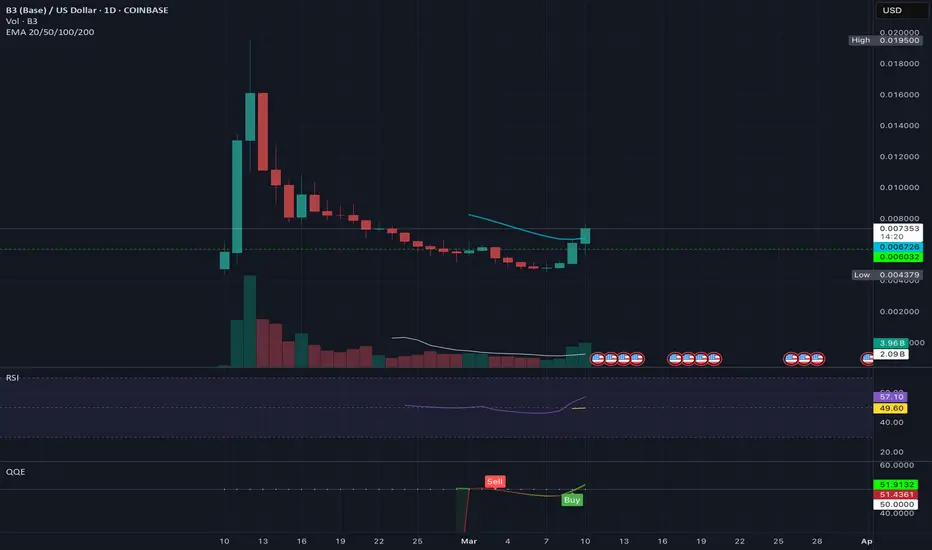
Lets see how this rolls out....B3 is closing above the 20 EMA for the first time since its Coinbase listing. It also crossed the 50 on the RSI, volume looks good, so lets see if the momentum holds. Im optimistic...
Its Been A Long Time Hasn't It?I see a possible horrible set up coming. But also an incredibly easy set up for the current US Administration to revert policy at a certain level.
I start to wonder if they are actually not looking at the market like they said. Its not like you need to look at the market for more than 5 minutes a day after doing a SINGLE in depth analysis on a longer time frame.
We will se what happens.

XLM Crashes Below Key Support – Is a Reversal Near?XLM has broken its previous low, raising the question: where is the next major support zone? To determine this, we will focus on fibonacci, moving averages, and order blocks to find a high-probability bounce area for a potential long position.
🔍 Fibonacci Retracement – Locating the Next Support Level
Using the Fibonacci retracement tool from the low at $0.0757 to the high at $0.6374:
0.618 Fib Retracement → $0.2903 (Already Lost) ❌ Current Price: $0.248
Next Major Fib Level – 0.786 Retracement at $0.1959
Since the 0.786 Fib level is a key retracement point, we need further confluence factors to confirm its strength as a potential support zone.
🔗 Confluence Factors Strengthening the Support Zone ($0.1959 – $0.17179)
1:1 Trend-Based Fibonacci Extension
High: $0.6374
A: $0.3179
B: $0.515
1:1 extension aligns at $0.1902 → Strong confirmation near 0.786 Fib retracement ✅
Wave A-B Fibonacci Extension
1.618 Fib extension from wave A to B is at $0.1875 → Aligns with the 1:1 trend-based extension ✅
Daily Support Level at $0.1962
Sits almost exactly at the 0.786 retracement ($0.1959) ✅
21 EMA & 21 SMA for Moving Average Support
21 EMA at $0.20338
21 SMA at $0.17187
Order Block Between $0.2208 – $0.1964
Demand area aligns with the major support zone ✅
Key Takeaway:
A high-probability support zone is now identified between $0.1959 and $0.17179, with multiple confluences suggesting a strong potential bounce.
Trade Plan – Scaling Into a Long Position
Given the strong confluence at the support zone, the best approach is scaling into a long trade.
DCA Entry Strategy:
Start scaling in at $0.22, as an order block exists between $0.2208 – $0.1964
Main focus remains on the support zone ($0.1959 – $0.17179)
Stop Loss:
Below the 21 SMA ($0.17187) for invalidation
Take Profit Levels for Optimal R:R:
First TP at $0.25 → Resistance area
Next TP at $0.30 → Strong psychological & resistance level
R:R Approximation:
2:1 R:R for first TP ($0.25)
3:1+ R:R if targeting $0.30
High-Probability Support Zone Identified
✔ Multiple confluences confirm a strong support zone at $0.1959 – $0.17179
✔ Scaling into a long from $0.22 to $0.17179, with stop loss below the 21 SMA ($0.17187)
✔ Take profit levels set at $0.25 & $0.30 for a solid R:R trade
Alternative bullish scenario: A reclaim of lost key low at $2526 with rising volume could signal a long opportunity, only on confirmation.
💬 Will XLM bounce from this key support? Let me know your thoughts in the comments! 🚀🔥

Short term bearish Daily - 03/10/25
Broke and closed under 50MA; seems bearish.
Trend: From 13.98 to 66.91. (Overnight trading price touched $40.00.)
Gaps: There are gaps that may need to be filled between 25.31 - 34.20.
Potential Buy Area: If the price tests and rejects 34.20, it could present a buying opportunity.
Indicators: Use RSI and MACD to confirm that buyers are in control. If the price breaks & Rejects 34.20, we’ll most likely see it drop to 25.31 and close those gaps before we make our way back up for earnings.
Disclaimer: This is not investment advice; invest at your own risk.

Redfin | RDFN | Long at $8.64Redfin $NASDAQ:RDFN. Yes, housing is starting to finally slide as mortgage rates remain high, housing inventory increases, and pending sales drop. I can see an argument to wait to enter NASDAQ:RDFN and I can't truly argue against it for 2025 (a dip is possible into the $4's if things really take a bad turn). But what I like about Redfin is they do not invest in homes where there is substantial risk during a housing pause or downturn. They purely make money through real estate services (brokerage and marketing), subscription services for listings, mortgage services (fees and interest), and other services.
When mortgage rates drop, the housing market will shift rapidly - which is honestly going to be a big problem in the long-term as the desperate buyer grabs a 4-5% mortgage (vs the current 6.5%-7%) for the "deal" on a home they can't truly afford...
During this eventual shift, Redfin and Zillow NASDAQ:Z will do well. It's just a matter of
"when" will it occur. At $8.64, NASDAQ:RDFN is in a personal buy zone. If the price dips further after earnings, I will be accumulating more shares (unless the company is crumbling).
Targets into 2027:
$11.00
$15.00
$20.00
$25.00

BTCUSDT: Signals a 2-Week Retest—Trend Still Alive
BTC’s been wild, but zoom out to the 2-week chart— we’ve got a solid uptrend with higher highs and lows. Last week’s dip isn’t a reversal—it’s a retest of the 50-day EMA (around $64.8k as of March 10, 2025). Volume’s thinning, RSI’s looks oversold. Indicators flashed a ‘hold’ here—no sell signal yet, which tells me the trend’s got legs or at least a bounce.
Bullish Case : If BTC holds the retested level (e.g., a prior resistance-turned-support), it could resume upward momentum. A two-week stabilization suggests accumulation, and a break above the recent high could target the next psychological level (e.g., $90,000).
Bearish Risk : If the retest fails—price breaks below the key level with high volume—it could signal a deeper correction, potentially revisiting lower supports (e.g., $70,000 or $60,000). A two-week trend turning into a failed retest might indicate profit-taking or macroeconomic pressure with all the news.
It's worth just taking a zoomed out look, no panic just yet and let it play out a little more.

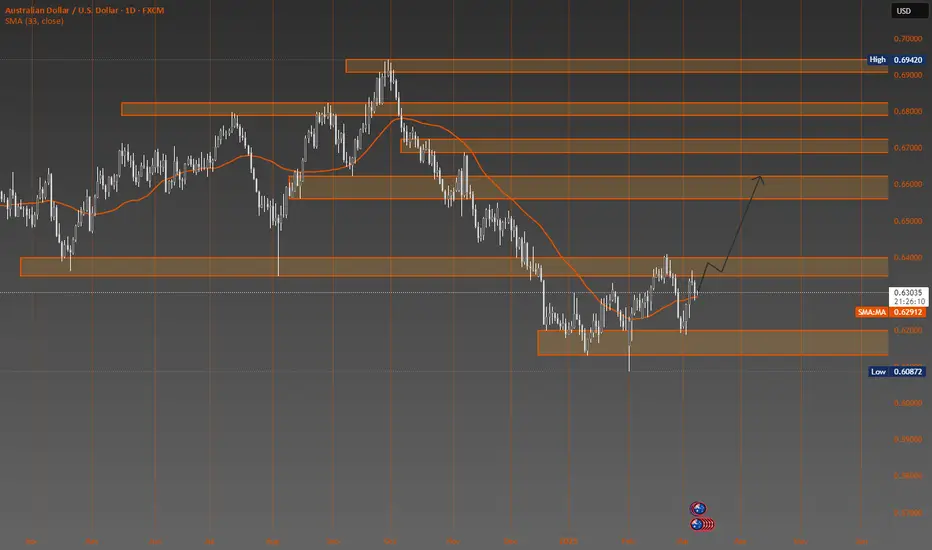
AUDUSD Buy - Take it or leave itAUDUSD / 10/03/2025 - 14/03/2025 / High impact news for USD on 11.12.13.14/03/2025.
GBPUSD BUYS WEEKLY ANALYSIS Hey guy’s second here’s my second pair that I will be interested for buys this week tho I trade only Gold but GBPUSD is giving a good buy projection so I can’t let it pass by..I will be waiting for price to pullback to that support zone and go to 4hr for some confirmation to take buys to the upside and I will update you guys if I’m executing this trade…Let’s have a win week…

XAUUSD WEEKLY BUY PROJECTION Hey everyone happy new trading week and hoping we get a nice signal to execute a trade it’s been 2weeks now No trade so this week on Gold my buy projection for now is I will waiting for price to breakout the consolidation zone with a nice retest and a bullish engulfing to take buys to the new ATH I will update you guys if I’m executing let’s have a win week…..

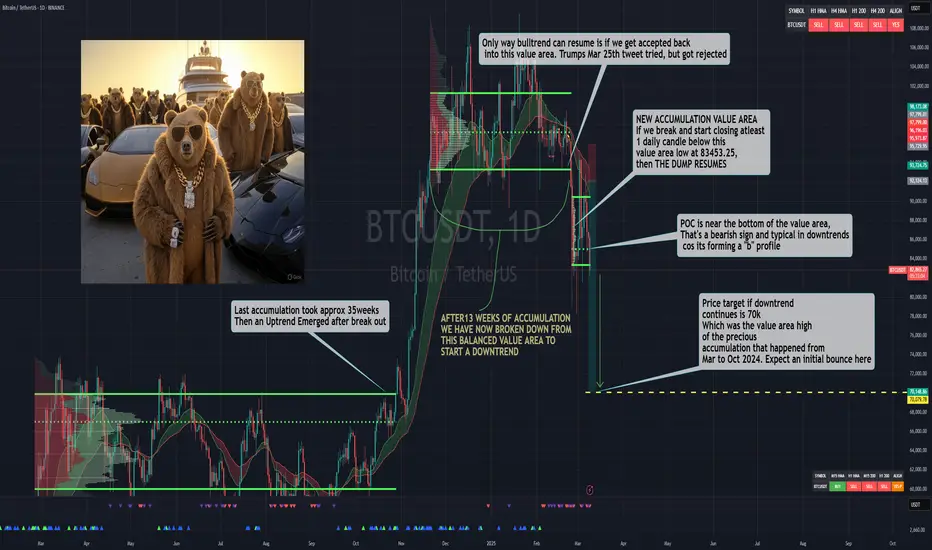
Welcome To The Long Awaited BTC Bear Market Fade the trend at your own risk.. It's always a good idea to SELL into WEAKNESS, and BUY into STENGTH.
The daily btc chart is confirmed bearish. Only the monthly and weekly chart are still bullish, but if the downtrend continues on the daily trend, then it will make its way to the Weekly chart and eventually the monthly chart.. This is going to happen slowly or a mega dump could speed it up. but the target remain the same.
We were all promised a "SUPER-CYCLE" and alot of people are still riding the narrative fueled by social media and constantly getting rekt . Trust ONLY what you see on charts ONLY !!.
I already started shorting the market way back since January when i stopped listening to the hype and started focusing on trading the trend on the chart as soon my trend indicator gave me a sell signal on the daily timeframe, everyone taught i was crazy in the chats for my bearish call outs. So far its been the BEST DECISION EVER !!
If you want to buy anything, just make sure its on Spot, you buy with the mindset that you are buying to hold until at least 2027 .There is no magical super cycle..The party is over until something crazy bullish happens or trump does something that sparks a new rally.
Behind the Buy&Sell Strategy: What It Is and How It WorksWhat is a Buy&Sell Strategy?
A Buy&Sell trading strategy involves buying and selling financial instruments with the goal of profiting from short- or medium-term price fluctuations. Traders who adopt this strategy typically take long positions, aiming for upward profit opportunities. This strategy involves opening only one trade at a time, unlike more complex strategies that may use multiple orders, hedging, or simultaneous long and short positions. Its management is simple, making it suitable for less experienced traders or those who prefer a more controlled approach.
Typical Structure of a Buy&Sell Strategy
A Buy&Sell strategy consists of two key elements:
1) Entry Condition
Entry conditions can be single or multiple, involving the use of one or more technical indicators such as RSI, SMA, EMA, Stochastic, Supertrend, etc.
Classic examples include:
Moving average crossover
Resistance breakout
Entry on RSI oversold conditions
Bullish MACD crossover
Retracement to the 50% or 61.8% Fibonacci levels
Candlestick pattern signals
2) Exit Condition
The most common exit management methods for a long trade in a Buy&Sell strategy fall into three categories:
Take Profit & Stop Loss
Exit based on opposite entry conditions
Percentage on equity
Practical Example of a Buy&Sell Strategy
Entry Condition: Bearish RSI crossover below the 30 level (RSI oversold entry).
Exit Conditions: Take profit, stop loss, or percentage-based exit on the opening price.

$AFRM $70 target into retest $80, pt. 1 chartI wish you could post multiple charts in the same size so you can see and I don't have to post twice. I looked at the D and W. This name should see it's IPO highs at some point this year, with the volatility it could be sooner than later as well. Resistance, in my opinion, looks to be $80 zone, a psyche area as well -- dating back to 3/2021, 1/2022, 2/2022, and 2/2025. Looks like $45-$50 which was once resistance now flipped to support. It touched the 200sma and riding the 200ema. & There almost seems like a huge cup and handle formed on the weekly as well... interesting. Also, look at the earnings on NASDAQ:AFRM ... lmao. Monstrous.
WSL

$SOL Trying For W Patter ReversalTHE MARKET REALLY WANTS TO GO UP.
Stronger coins, such as CRYPTOCAP:SOL
keep putting in higher lows.
If we close above the EMA9 on the Daily that will be really telling.
A bit premature to call a reversal, but I’ve been speculating on this W reversal pattern forming since Trump announced the Crypto Strategic Reserve.
Perfect setup for that.
The lack of liquidity is the only thing holding back the reversal and reason for the pump n dumps on every bit of news.
