Wake-Up Time for Walmart?Walmart has snoozed for months, but some traders may think it’s waking up.
The first pattern on today’s chart is the price range on either side of roughly $95. The retail giant peaked at that level in early December and is back near the same location more than six months later. That indicates a period of consolidation has occurred.
Second, a weekly low of $93.43 developed near the bottom of the range. WMT held it last week and bounced, which may suggest support is in place.
Third, stochastics have rebounded from an oversold condition and prices are bouncing at the 100-day simple moving average. Those signals may imply a longer-term uptrend remains in effect and is reasserting itself.
Finally, traders looking to the upside may notice the February 20 gap around $100. WMT probed that level in early June before backing down. Is another test coming?
Check out TradingView's The Leap competition sponsored by TradeStation.
TradeStation has, for decades, advanced the trading industry, providing access to stocks, options and futures. If you're born to trade, we could be for you. See our Overview for more.
Past performance, whether actual or indicated by historical tests of strategies, is no guarantee of future performance or success. There is a possibility that you may sustain a loss equal to or greater than your entire investment regardless of which asset class you trade (equities, options or futures); therefore, you should not invest or risk money that you cannot afford to lose. Online trading is not suitable for all investors. View the document titled Characteristics and Risks of Standardized Options at www.TradeStation.com . Before trading any asset class, customers must read the relevant risk disclosure statements on www.TradeStation.com . System access and trade placement and execution may be delayed or fail due to market volatility and volume, quote delays, system and software errors, Internet traffic, outages and other factors.
Securities and futures trading is offered to self-directed customers by TradeStation Securities, Inc., a broker-dealer registered with the Securities and Exchange Commission and a futures commission merchant licensed with the Commodity Futures Trading Commission). TradeStation Securities is a member of the Financial Industry Regulatory Authority, the National Futures Association, and a number of exchanges.
TradeStation Securities, Inc. and TradeStation Technologies, Inc. are each wholly owned subsidiaries of TradeStation Group, Inc., both operating, and providing products and services, under the TradeStation brand and trademark. When applying for, or purchasing, accounts, subscriptions, products and services, it is important that you know which company you will be dealing with. Visit www.TradeStation.com for further important information explaining what this means.
Moving Averages

Technology ETF Flirts with New HighsTechnology stocks have been coming to life recently, and some traders may expect new highs soon.
The first pattern on today’s chart of the SPDR Select Sector Technology Fund is last July’s peak around $238. As the fund retreated from that level, it began a period of underperformance. (See ratio chart in the lower study.) The weakness continued through April, when it started to outpace the broader market again.
Second is $240.84, the final price on December 6 and the highest weekly closing price ever. XLK is on track to potentially surpass that level, which could confirm a breakout.
Third, the 50-day simple moving average (SMA) is nearing a potential “golden cross” above the 200-day SMA. Is the longer-term trend turning bullish again?
Finally, price action in this fund could be important for the broader market because technology represents almost one-third of the S&P 500 index.
Standardized Performances for the ETF mentioned above:
SPDR Select Sector Technology ETF (XLK)
1-year: +9.87 %
5-years: +135.69%
10-year: +432.42%
(As of May 30, 2025)
Exchange Traded Funds ("ETFs") are subject to management fees and other expenses. Before making investment decisions, investors should carefully read information found in the prospectus or summary prospectus, if available, including investment objectives, risks, charges, and expenses. Click here to find the prospectus.
Check out TradingView's The Leap competition sponsored by TradeStation.
TradeStation has, for decades, advanced the trading industry, providing access to stocks, options and futures. If you're born to trade, we could be for you. See our Overview for more.
Past performance, whether actual or indicated by historical tests of strategies, is no guarantee of future performance or success. There is a possibility that you may sustain a loss equal to or greater than your entire investment regardless of which asset class you trade (equities, options or futures); therefore, you should not invest or risk money that you cannot afford to lose. Online trading is not suitable for all investors. View the document titled Characteristics and Risks of Standardized Options at www.TradeStation.com . Before trading any asset class, customers must read the relevant risk disclosure statements on www.TradeStation.com . System access and trade placement and execution may be delayed or fail due to market volatility and volume, quote delays, system and software errors, Internet traffic, outages and other factors.
Securities and futures trading is offered to self-directed customers by TradeStation Securities, Inc., a broker-dealer registered with the Securities and Exchange Commission and a futures commission merchant licensed with the Commodity Futures Trading Commission). TradeStation Securities is a member of the Financial Industry Regulatory Authority, the National Futures Association, and a number of exchanges.
TradeStation Securities, Inc. and TradeStation Technologies, Inc. are each wholly owned subsidiaries of TradeStation Group, Inc., both operating, and providing products and services, under the TradeStation brand and trademark. When applying for, or purchasing, accounts, subscriptions, products and services, it is important that you know which company you will be dealing with. Visit www.TradeStation.com for further important information explaining what this means.

Oil Price: Breakout or Fakeout? Watch This Zone Closely Technical Overview:
The current price action is testing the upper boundary of a descending wedge, a bullish reversal pattern. The recent strong green candle indicates a potential breakout attempt, yet price is hovering near a critical resistance level at $74.20 (Fib 0.5).
Key levels from the Fibonacci retracement are:
🔼 Resistance at $74.20 (0.5), then $78.16 (0.618)
🧲 Local support at $69.78 (0.382)
🛡️ Strong demand zone near $63.81 (0.236) if rejection occurs
Structure + Patterns:
Price has been compressing inside a falling wedge, which statistically resolves to the upside.
The breakout candle broke above the 20 EMA and touched the upper wedge resistance — signaling a decision point.
Volume is rising on bullish candles — initial confirmation of buyer interest, but not yet decisive.
Scenarios to Watch
Bullish Case:
Break and close above $74.20 on higher volume → likely move toward $78–$86 resistance zone.
Confirmation of wedge breakout could trigger trend reversal, aligning with bullish fib levels.
Momentum could accelerate if macro factors support demand (see geopolitics below).
Bearish Case:
Failure to close above $74.20 = fakeout risk → price may reject down to $69.78 or even retest $63.81.
Bearish rejection wick on the daily/4H would be an early signal.
Macro & Geopolitical Factors to Monitor:
Middle East Tensions: Any escalation (especially around Iran or shipping lanes) could spike oil due to supply fears.
US Strategic Reserves & Elections: Moves to refill reserves or control inflation could support demand.
China Demand Recovery: Data showing improved industrial output or stimulus from PBoC may strengthen global oil outlook.
Final Thoughts:
Price is at a pivot zone — breaking this wedge with strength could shift the short-to-midterm trend. Until then, this remains a "show me" breakout . Watch how the next 1–2 weekly candles close around the $74–$75 area to confirm direction.

Bullish Reversal Detected on Marriott (4H) – Triple Confirmation---
🕵️♂️ Bullish Reversal Detected on Marriott (4H) – Triple Confirmation Setup
📆 Timeframe: 4H
📍 Symbol: NASDAQ:MAR (Marriott International)
Just spotted a clean triple confirmation setup using candlestick patterns, momentum, and price action reaction. This is the kind of entry that stands out when you’re waiting patiently for the market to align.
---
✅ Setup Breakdown:
1. Bullish Engulfing Pattern (BE)
A strong engulfing candle formed at the bottom of a down move.
Backed up by a second BE, strengthening the reversal signal.
2. Hammer Candle (H)
A hammer appeared right after, confirming rejection of lower prices.
This added strong confluence to the setup.
3. Stochastic RSI Reversal
Stoch RSI bounced from below 20 and is now above 60.
Momentum has shifted upward — clear sign of strength.
4. Price Action Follow-Through
Strong bullish candle followed the pattern.
Price reacted exactly how you'd want to see after a bottom setup.
---
🎯 Trade Plan:
Entry: Above the bullish engulfing high (~$256.50+)
Stop Loss: Below the hammer low (~$251.00)
Target: Around $268–$272 (recent resistance zone)
---
📌 Summary:
When candlestick structure, momentum indicators, and reaction candles all agree — that’s a powerful signal. I’ll continue to watch how price behaves near resistance.
How do you approach entries like this? Do you wait for this kind of pattern confluence too?
--
Rocket Boost This Content To Learn More
---
⚠️ Disclaimer:
This post is for educational and informational purposes only and does not constitute financial advice. Always do your own research and consult a licensed financial advisor before making any trading decisions. Trading involves risk and can result in the loss of capital.

$SOL Local Bottom FormingCRYPTOCAP:SOL closed the day back within the POI.
RSI oversold.
Should see a retest ~$136 to confirm the local bottom.

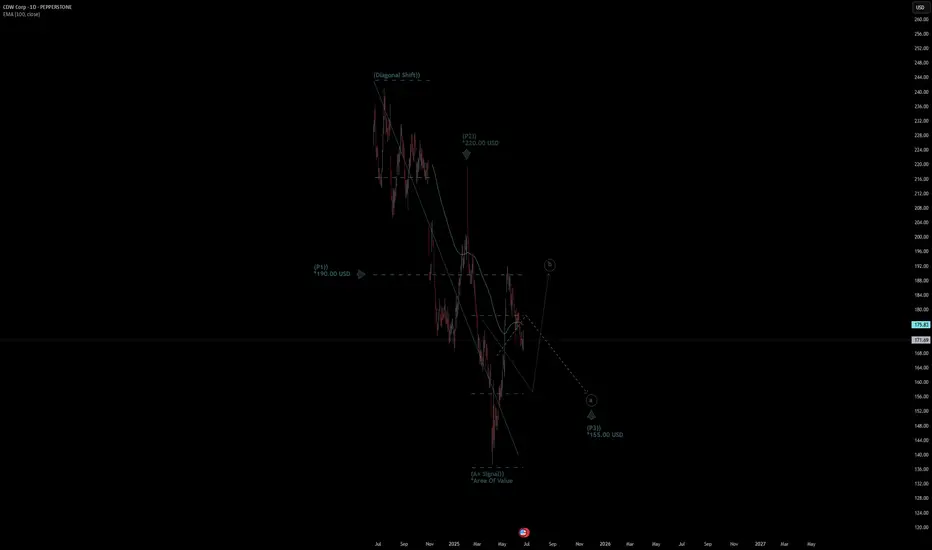
CDW Corp Stock Quote | Chart & Forecast SummaryKey Indicators On Trade Set Up In General
1. Push Set Up
2. Range Set Up
3. Break & Retest Set Up
Notes On Session
# CDW Corp Stock Quote
- Double Formation
* (Diagonal Shift)) At 240.00 USD | Completed Survey
* (A+ SIgnal)) - *Area Of Value | Subdivision 1
- Triple Formation
* (P1)) / (P2)) & (P3)) | Subdivision 2
* (TP1) = a / Long Consecutive Range
* (TP2) = b / Short Consecutive Pullback | Subdivision 3
* Daily Time Frame | Trend Settings Condition
- (Hypothesis On Entry Bias)) | Regular Settings
- Position On A 1.5RR
* Stop Loss At 180.00 USD
* Entry At 170.00 USD
* Take Profit At 158.00 USD
* (Downtrend Argument)) & No Pattern Confirmation
* Ongoing Entry & (Neutral Area))
Active Sessions On Relevant Range & Elemented Probabilities;
European-Session(Upwards) - East Coast-Session(Downwards) - Asian-Session(Ranging)
Conclusion | Trade Plan Execution & Risk Management On Demand;
Overall Consensus | Sell
Bank of America: Potential BreakoutBank of America squeezed into a range, and now it may be breaking out.
The first pattern on today’s chart is $44.84, the high on March 4 as the megabank gapped lower.
It spent more than a month pushing against that level while making higher lows. The resulting ascending triangle is a potentially bullish continuation pattern.
Second, BAC closed above the resistance on Friday and is now potentially entering the gap from March 4. Is a breakout underway?
Third, Bollinger Bandwidth has narrowed. That may create potential for prices to expand following a period of compression.
Next, the 8-day exponential moving average (EMA) has remained above the 21-day EMA. Prices have also held above their 200-day simple moving average. Those signals may reflect bullishness in the short and long terms.
Finally, BAC is an active underlier in the options market. Its 122,000 average daily contracts in the last month rank 23rd in the S&P 500, according to TradeStation data. That could help traders take positions with calls and puts.
Check out TradingView's The Leap competition sponsored by TradeStation.
TradeStation has, for decades, advanced the trading industry, providing access to stocks, options and futures. If you're born to trade, we could be for you. See our Overview for more.
Past performance, whether actual or indicated by historical tests of strategies, is no guarantee of future performance or success. There is a possibility that you may sustain a loss equal to or greater than your entire investment regardless of which asset class you trade (equities, options or futures); therefore, you should not invest or risk money that you cannot afford to lose. Online trading is not suitable for all investors. View the document titled Characteristics and Risks of Standardized Options at www.TradeStation.com . Before trading any asset class, customers must read the relevant risk disclosure statements on www.TradeStation.com . System access and trade placement and execution may be delayed or fail due to market volatility and volume, quote delays, system and software errors, Internet traffic, outages and other factors.
Securities and futures trading is offered to self-directed customers by TradeStation Securities, Inc., a broker-dealer registered with the Securities and Exchange Commission and a futures commission merchant licensed with the Commodity Futures Trading Commission). TradeStation Securities is a member of the Financial Industry Regulatory Authority, the National Futures Association, and a number of exchanges.
Options trading is not suitable for all investors. Your TradeStation Securities’ account application to trade options will be considered and approved or disapproved based on all relevant factors, including your trading experience. See www.TradeStation.com . Visit www.TradeStation.com for full details on the costs and fees associated with options.
Margin trading involves risks, and it is important that you fully understand those risks before trading on margin. The Margin Disclosure Statement outlines many of those risks, including that you can lose more funds than you deposit in your margin account; your brokerage firm can force the sale of securities in your account; your brokerage firm can sell your securities without contacting you; and you are not entitled to an extension of time on a margin call. Review the Margin Disclosure Statement at www.TradeStation.com .
TradeStation Securities, Inc. and TradeStation Technologies, Inc. are each wholly owned subsidiaries of TradeStation Group, Inc., both operating, and providing products and services, under the TradeStation brand and trademark. When applying for, or purchasing, accounts, subscriptions, products and services, it is important that you know which company you will be dealing with. Visit www.TradeStation.com for further important information explaining what this means.

Crypto $TOTAL Market Cap Hopeful Weekly CloseWhat a wild close to the Week for the Crypto CRYPTOCAP:TOTAL Market Cap
Closed just above the 50% Gann level within the POI, but failed to close above the EMA9.
Strong bounce off the SMA20 still shows bull have some gas left in the tank, but I suspect we go lower with such a massive bearish candle on the week.
SMA50 is ~2.8T

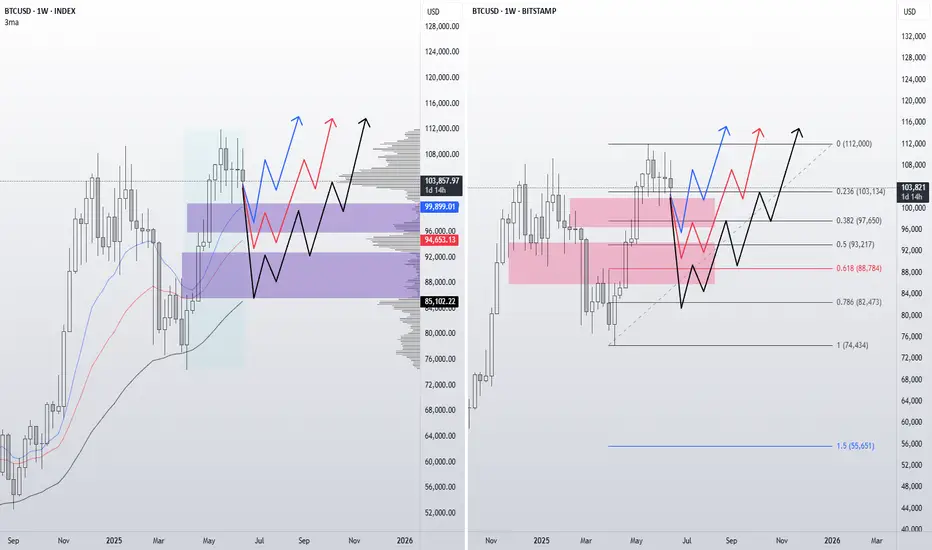
$BTC Heading to the Long-Awaited 200DMA Retest ~$96kFULFILL THY PROPHECY 📖
CRYPTOCAP:BTC making its way down to the long-awaited 200DMA retest, which just so happens to show confluence with the .618 Fib level at $96k.
RSI shows a bit more room to the downside as well.
Make sure to get those bids in!

BTC.D + USDT.D + USDC.D > FLIGHT TO SAFETY SurgingStructures are being broken across the board 🚨
Looks like the Flight to Safety chart is closing the week at a new cycle ATH.
Should push to 74% before we see a meaningful turn around.

$ROOT IS IN A LONG TERM WEDGE WHICH SHOULD BREAK OUT SOONNASDAQ:ROOT that is in that bullish wedge is constricting and consolidating, it's like a rocket ship getting ready to launch NASDAQ:ROOT to $200 and higher like $230 or so.

BTC/USD BUY 22/06/2025🇺🇸 This trade setup offers a strong buying opportunity, supported by several technical confluences. We observe a retest of the lower boundary of a descending range within a broader bullish trend, reinforced by a bullish RSI divergence and the presence of a key support zone. The strategy is to wait for a potential retest of the range low before entering a long position around the \$100,000 to \$101,000 area, with a stop loss set at \$98,000 to manage risk. The target (TP) is set at \$110,000, aiming for a risk-to-reward ratio (RR) greater than 3, which makes this setup highly attractive in terms of risk management.
From a fundamental perspective, this bullish bias is further supported by growing institutional interest and an uncertain macroeconomic environment, marked by inflation and geopolitical tensions. These factors continue to drive demand for alternative assets like Bitcoin as a store of value.

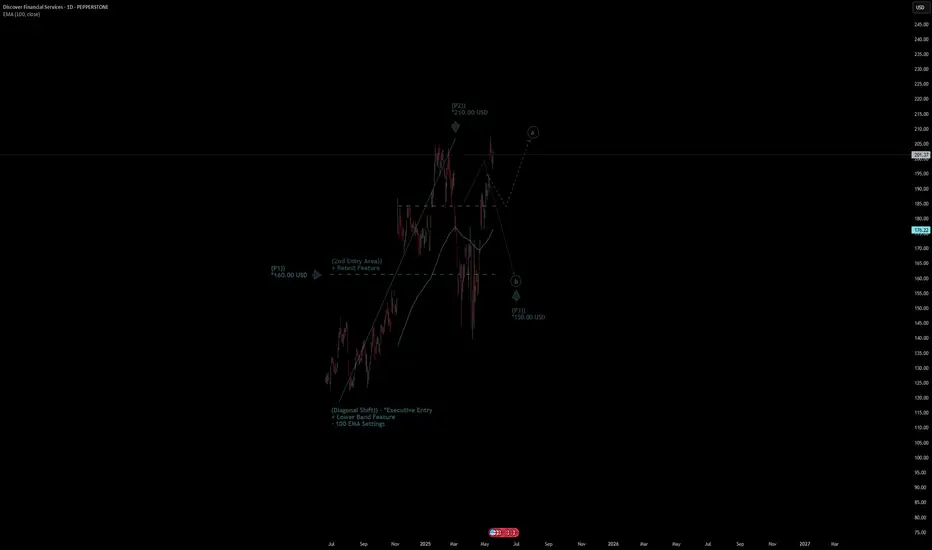
Discover Financial Serv. Stock Quote | Chart & Forecast SummaryKey Indicators On Trade Set Up In General
1. Push Set Up
2. Range Set Up
3. Break & Retest Set Up
Notes On Session
# Discover Financial Services Stock Quote
- Double Formation
* (Diagonal Shift)) - *Executive Entry | Completed Survey
* (2nd Entry Area)) + Retest Feature | Subdivision 1
- Triple Formation
* (P1)) / (P2)) & (P3)) | Subdivision 2
* (TP1) = a / Long Consecutive Range
* (TP2) = b / Short Consecutive Pullback | Subdivision 3
* Daily Time Frame | Trend Settings Condition
- (Hypothesis On Entry Bias)) | Regular Settings
- Position On A 1.5RR
* Stop Loss At 185.00 USD
* Entry At 200.00 USD
* Take Profit At 225.00 USD
* (Uptrend Argument)) & No Pattern Confirmation
* Ongoing Entry & (Neutral Area))
Active Sessions On Relevant Range & Elemented Probabilities;
European-Session(Upwards) - East Coast-Session(Downwards) - Asian-Session(Ranging)
Conclusion | Trade Plan Execution & Risk Management On Demand;
Overall Consensus | Buy
USDCAD LONG SETUPI am expecting the US Dollar to be bullish this week.
Weekly closed as a bullish engulfing.
Expecting price to make a minor pull back on the daily before taking making another bullish push.
Price is also showing a bullish divergence on the daily, which furthers strengthens my perspective.
The 2H TF also illustrates somewhat of a Cup-and-Handle Candle Stick Formation
Will look to enter longs on the lower TFs (1-4h)

If BTC BullishIf I were a bull and perceived the current divergences to the main indicators as corrections, and not as a change in the market to bearish, then I would present support levels in this form.
In this form, where, as they say, all the stars came together.
Here are the gap levels, and EMA 13/26/52.
Fibonacci levels and mirror levels.
And three options in continuation of Bullish BTC.
Round and round, pick who you’ve found! ))
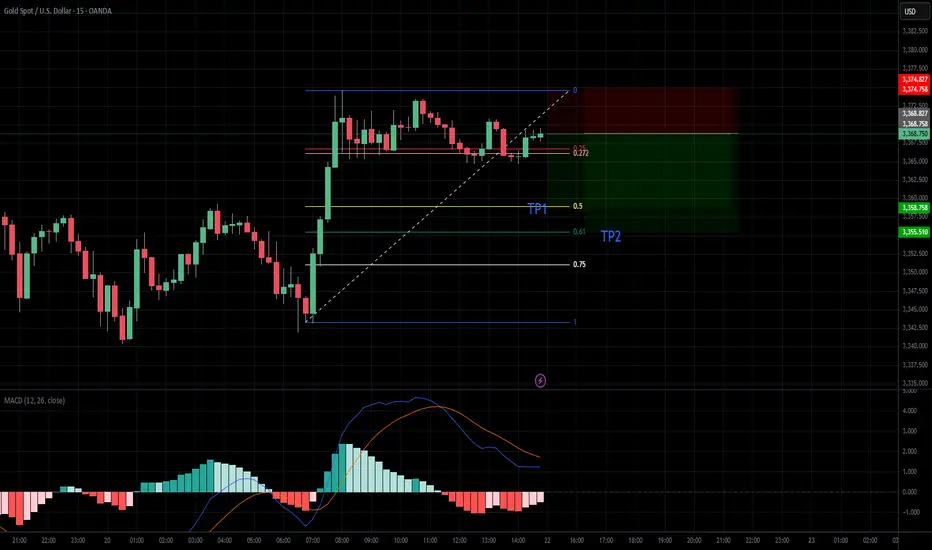
Short on GOLD for the first min of the dayJust a small idea of what could happen at the begging of the market on Mon
ZETA: when a wedge isn’t just a wedge — it’s a launchpadTechnically, this setup is textbook clean. Price completed the fifth wave within a falling wedge and instantly reacted with a bullish breakout. The expected breakdown didn’t happen — instead, buyers stepped in, confirmed by rising volume. All EMAs are compressed at the bottom of the structure, signaling a clear shift in momentum. The volume profile shows strong accumulation around $14, while the area above current levels is a vacuum — ideal conditions for acceleration.
The key resistance zone is $16.70–17.20 — former base highs and the 0.236 Fibonacci retracement. If price breaks this area with volume, the next stop is likely $24.48 (0.5 Fibo). Classical wedge targets land at $38.28 and $55.33 (1.272 and 1.618 extensions). If a trending leg begins, it could move fast — because there’s simply no supply overhead.
Fundamentals:
ZETA isn’t a profitable company yet, but it shows consistent revenue growth and aggressive expansion. Capitalization is rising, debt is manageable, and institutional interest has increased over recent quarters. In an environment where tech and AI are regaining momentum, ZETA could be a speculative second-tier breakout candidate.
Tactical plan:
— Entry: market or after a retest of $14.00–14.30
— First target: $17.20
— Main target: $24.48
— Continuation: $38.28+
— Stop: below $13.00 (bottom wedge boundary)
When the market prints a wedge like this and the crowd ignores it — that’s often the best trap setup. Only this time, it’s not for retail buyers. It’s for the shorts. Because when a falling wedge breaks to the upside with volume — it’s time to buckle up.

Pullback in GE AerospaceGE Aerospace has been rallying, and now it’s pulled back.
The first pattern on today’s chart is the steady advance in April and May that established GE at its highest levels since 2001. Is an accumulation phase underway?
Second is the May 23 close of $232.79. The industrial stock tested and held it yesterday after lingering above it all last week. That could mean new support is in place.
The pullback also represented approximately a 50 percent retracement of the move following the breakout.
Next, stochastics are turning up from an oversold condition.
Finally, the 8-day exponential moving average (EMA) has stayed above the 21-day EMA. That may reflect a bullish trend.
Check out TradingView's The Leap competition sponsored by TradeStation.
TradeStation has, for decades, advanced the trading industry, providing access to stocks, options and futures. If you're born to trade, we could be for you. See our Overview for more.
Past performance, whether actual or indicated by historical tests of strategies, is no guarantee of future performance or success. There is a possibility that you may sustain a loss equal to or greater than your entire investment regardless of which asset class you trade (equities, options or futures); therefore, you should not invest or risk money that you cannot afford to lose. Online trading is not suitable for all investors. View the document titled Characteristics and Risks of Standardized Options at www.TradeStation.com . Before trading any asset class, customers must read the relevant risk disclosure statements on www.TradeStation.com . System access and trade placement and execution may be delayed or fail due to market volatility and volume, quote delays, system and software errors, Internet traffic, outages and other factors.
Securities and futures trading is offered to self-directed customers by TradeStation Securities, Inc., a broker-dealer registered with the Securities and Exchange Commission and a futures commission merchant licensed with the Commodity Futures Trading Commission). TradeStation Securities is a member of the Financial Industry Regulatory Authority, the National Futures Association, and a number of exchanges.
TradeStation Securities, Inc. and TradeStation Technologies, Inc. are each wholly owned subsidiaries of TradeStation Group, Inc., both operating, and providing products and services, under the TradeStation brand and trademark. When applying for, or purchasing, accounts, subscriptions, products and services, it is important that you know which company you will be dealing with. Visit www.TradeStation.com for further important information explaining what this means.

ATOM | SLEEPING GIANT | Altcoin GEMATOM is an alt that I have high expectations for.
From a 4h perspective, we can see the short term price is still very bearish.
This is confirmed by trading under the moving averages, which indicates that the sellers are in control.
The great news about this is that the price doesn't stay long UNDER the moving averages in the 4h. From the chart below, we see a very evident bearish trend - the price STAYS under the moving averages, with occasional, random wicks above and to the upper purple (200d MA).
After the bottom, marked the " BIG TURNAROUND ", we see the price trading mostly just under or just above, as we observe range trading. This is how we know, the bottom is in / close. And from here, it's only a matter of time until we start turning around to another bullish cycle . Where the gains far outweigh the risk.
Following this logic, the next reasonable ( very reasonable ) target, is the purple moving averages, and beyond. Currently at $4.3, a nice +8% from here.
_______________________

The Trendline Price is consolidating around the 200EMA, and right on a trendline, if price breaks below the trendline possible price target is 9.58, and 9.58 would be the bulls last stand against the bears. Please be careful and watch out for fakeouts.

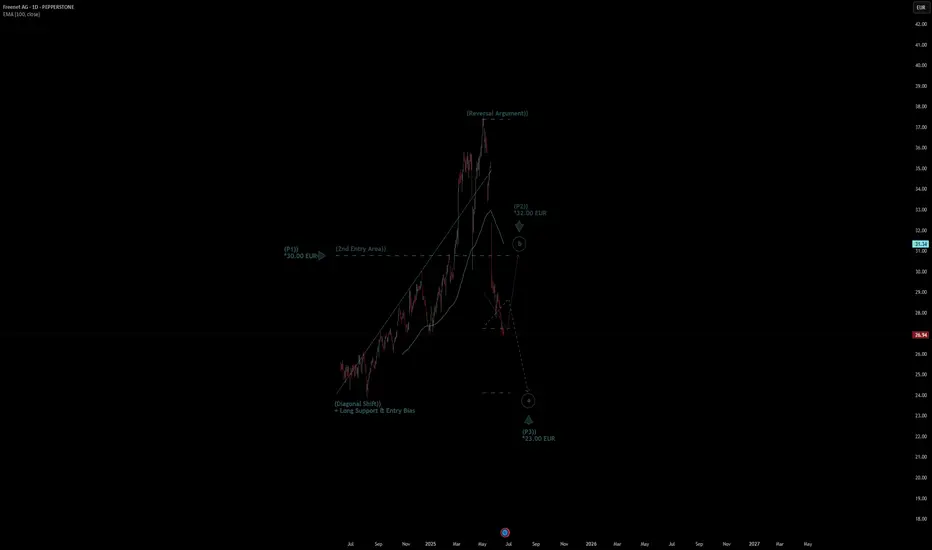
Freenet AG Stock Quote | Chart & Forecast SummaryKey Indicators On Trade Set Up In General
1. Push Set Up
2. Range Set Up
3. Break & Retest Set Up
Notes On Session
# Freenet AG Stock Quote
- Double Formation
* (Diagonal Shift) + Long Support & Entry Bias | Completed Survey
* (2nd Entry Area)) At 30.00 EUR | Subdivision 1
- Triple Formation
* (P1)) / (P2)) & (P3)) | Subdivision 2
* (TP1) = a / Long Consecutive Range
* (TP2) = b / Short Consecutive Pullback | Subdivision 3
* Daily Time Frame | Trend Settings Condition
- (Hypothesis On Entry Bias)) | Regular Settings
- Position On A 1.5RR
* Stop Loss At 28.00 EUR
* Entry At 27.00 EUR
* Take Profit At 25.00 EUR
* (Downtrend Argument)) & No Pattern Confirmation
* Ongoing Entry & (Neutral Area))
Active Sessions On Relevant Range & Elemented Probabilities;
European-Session(Upwards) - East Coast-Session(Downwards) - Asian-Session(Ranging)
Conclusion | Trade Plan Execution & Risk Management On Demand;
Overall Consensus | Sell
Crypto consolidating ahead of rally towards All Time HighsWith US equity markets closed for Juneteenth, I'm checking in on an equal weight basket of cryptos. Recently I said crypto looked to be heating up for a run at new highs.
As I look today, prices appear range bound on the daily chart. There's a bearish double-top formation, beside declining momentum. The bottom of the range resting at the 200 Day Moving Average, and a test of it seems likely.
Should there be a bounce off the 200 Day SMA, and a break through the top end of the range we might get a shot at those new All Time Highs.

INDU - Long trade - Stop loss hunted by smart playerINDUS Motors stoploss hunted by some very very smart player yesterday :)
Brought down to 1685 level and then brought it up to just over its Fib 0.786 level.
It is taking support from its SMA20 level and a golden cross is about to happen next month.
This is the best time to hold onto it (my personal opinion, not a buy / sell call).
It requires patience though. This stock is not for impatient. As per my last analysis of INDU, its targets are minimum 3200 to 3500 (May go further upwards).
Moreover, it is a very good dividend stock. Ideal for long term investment.
Liquidity sweep can also be observed in last two days ;)
