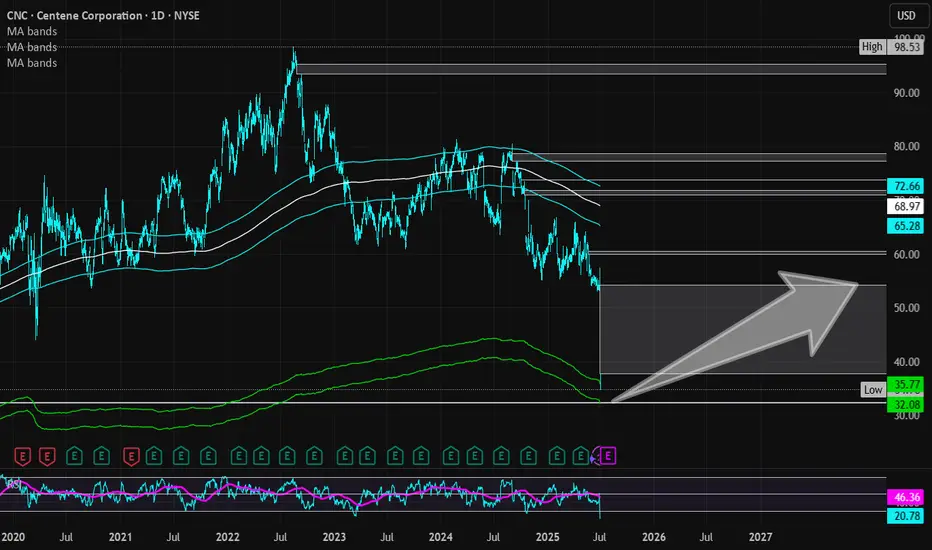
Centene Corp | CNC | Long at $35.00Centene Corp NYSE:CNC is a healthcare enterprise providing programs and services to under-insured and uninsured families, commercial organizations, and military families in the U.S. through Medicaid, Medicare, Commercial, and other segments. The stock dropped almost 40% this morning due to recent challenges, such as a $1.8B reduction in 2025 risk adjustment revenue and rising Medicaid costs (leading to withdrawal of 2025 earnings guidance). However, the company has a book value near $56, debt-to-equity of 0.7x (healthy), a current P/E of 5x, and a forward P/E of 9x.
It may be a few years before this stock recovers. But the price has entered my "crash" simple moving average area (currently between $32 and $36) and there is a price gap on the daily chart between $32 and $33 that will likely be closed before a move higher. Long-term, and potentially a new political administration, new life may enter this stock once again as the baby boom generation requires more healthcare services. But holding is not for the faint of heart...
Thus, at $35.00, NYSE:CNC is in a personal buy zone with a likely continued dip into the low $30s or high $20s before a slow move higher (where I will be accumulating more shares). Full disclosure: I am also a position holder in the $60s and cost averaging down.
Targets into 2028:
$45.00 (+28.6%)
$54.00 (+54.3%)
Moving Averages
DXY Long-Term Technical Outlook: Channel Structure, Pullbacks & ## **DXY (Dollar Index) Technical Analysis – 2W Chart**
### **1. Uptrend Since 2008**
The Dollar Index (DXY) has been in a **long-term uptrend** since the 2008 bottom (around 70.70). The chart shows a clear pattern of **higher highs and higher lows**, establishing a bullish market structure over the past 15+ years.
---
### **2. Ascending Channel**
The price has been moving consistently within a well-defined **ascending channel**. Several reactions from the channel boundaries are visible:
- **Support (lower trendline):** 2008, 2011, 2018, 2021, 2024
- **Resistance (upper trendline):** 2009, 2017, 2022
This suggests that the market is respecting the technical boundaries of the channel remarkably well.
---
### **3. Historical Pullbacks Within the Channel (13.5% – 15%)**
The chart highlights major **pullbacks** from local tops, all falling within the **-12.6% to -16.9%** range, showing high consistency:
| Year | Drop | % Decline |
|-------------|----------|----------------|
| 2009 | -14.76 | -16.47% |
| 2010 | -14.97 | -16.90% |
| 2017 | -15.17 | -14.61% |
| 2020 | -13.65 | -13.25% |
| 2022 | -14.90 | -12.98% |
| 2024/2025 | -13.90 | -12.61% |
This implies that **a retracement of 13–15%** from a local high is a historically "normal" correction within the ongoing uptrend.
---
### **4. EMA Analysis – 24, 120, 240** (2Y,5Y,10Y)
The chart includes three Exponential Moving Averages (EMAs), reflecting short-, medium-, and long-term trends:
- **EMA 24 (white line):** Reacts to short-term price action. Price is currently breaking below it, suggesting weakness in short-term momentum.
- **EMA 120 (red line):** Reflects the mid-term trend. Price is **right at the edge**, often acting as a **support level** in bullish markets.
- **EMA 240 (blue line):** Represents the long-term outlook. **Price has never stayed below this level for long** over the past 15 years, making this EMA a **critical support** for the long-term trend.
---
### **Conclusion & Potential Scenarios**
📉 **Bearish Scenario:**
If DXY breaks below the **EMA 240** and the **lower channel boundary**, it could indicate a **reversal of the long-term uptrend**, which hasn’t happened since 2008.
📈 **Bullish Scenario:**
If DXY holds above the **EMA 120** or bounces from the **EMA 240** and the **channel support**, we could expect a rally toward the **Fibonacci levels** (0.5 at 102.04 or 0.382 at 105.04), or even a retest of the highs around **114.78**.


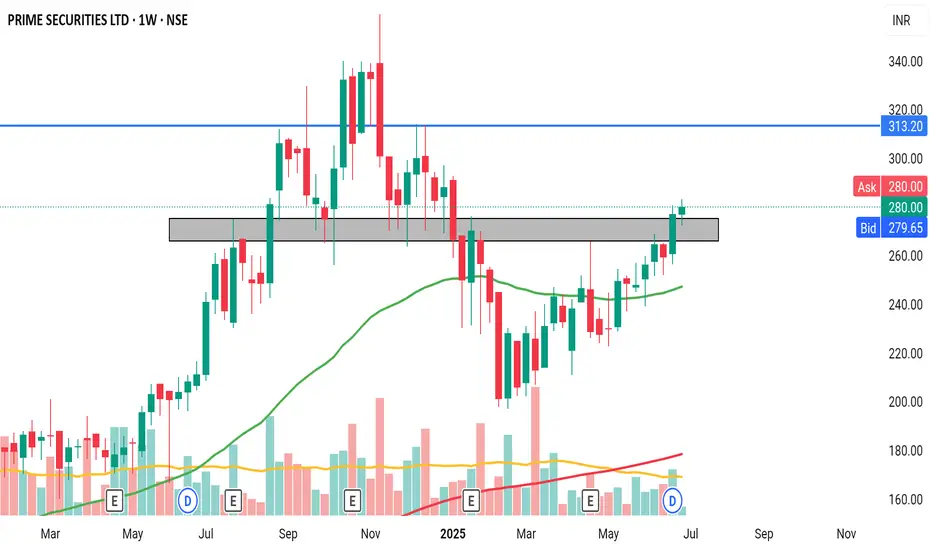
PRIME SECURITIES Crossed resistance with good volume in weekly timeframe. Price above 50 EMA indicates bullishness.
Trading The 3 Step Rocket Booster StrategyTrading within a certain time frame has shown me that its better to set a time stop limit.
This time stop limit tells you when to stop trading your entry.
-
Now does this work? am not sure but i will try anything
that will produce results.
-
Right now am focusing on short term trading strategies.The main aim is to enter on 4 hour time frames.
-
Am hoping that this will increase my trading skills.Either way my focuss is on learning how to trade better setups.
-
Key Point:Dont stop journal-ling your trades on trading-view community.
-
Now on this entry am looking at a rising volume from the bottom of the market.
-
Also we are looking at the rocket booster strategy:
-
It has the following steps:
-
-The price has to be above the 50 EMA
-The price has to be above the 200 EMA
-The price has to gap up.
-
This strategy has become so popular its shocking.Because when i began teaching...
-
it it was not as popular.
-
I call it the 3-Step Rocket Booster Strategy
If you want to learn more about how to find
stocks such as NYSE:KO
-
Rocket boost this content to learn more.
-
Disclaimer:Trading is risky please learn risk management and profit taking strategies.Also do not use margin trading.And use a simulation trading account before you trade with real money.

B&G Foods | BGS | Long at $4.45B&G Foods NYSE:BGS , owner of over 50 food brands including Green Giant, Ortega, Cream of Wheat, Mrs. Dash, and Crisco, has dropped nearly 92% in price since its high in 2021. Currently trading at $4.43 and with a book value of $6.43, NYSE:BGS may have some running room in the next 1-2 years for a forward P/E of 10x (currently negative, so there is anticipated growth, though small). This is another company that would greatly benefit from lowered interest rates due to its high debt-to-equity (4x).
So, while debt and consumer spending declines may pose a threat to NYSE:BGS , I believe it is currently undervalued. If the stock drops due to poor earnings (which could drop to under $2.00), I will be entering another position unless fundamental / outlook truly change.
Thus, at $4.45, NYSE:BGS is in a personal buy zone.
Targets into 2027:
$5.25
$6.25

EMA SystemThe system of Moving Averages I started out using is the 9-21-50 SMA. I would use the Fast EMA as a trailing stop loss and only trade long when it's above the 50 SMA. The 21 SMA is often a zone where price can bounce back.
12-21 EMA—EMA of EMA can work as well. So can 50-200 SMA or EMA of EMA for telling the larger trend if you want to enter an Option, then trading against it can be fatal.

#BCHBTC #1W (Binance) Big falling wedge breakoutCRYPTOCAP:BCH just regained 50MA weekly support in sats, performing better than CRYPTOCAP:BTC
Seems likely to continue bullish towards 200MA resistance, probably after a pull-back.
⚡️⚡️ #BCH/BTC ⚡️⚡️
Exchanges: Binance
Signal Type: Regular (Long)
Amount: 7.0%
Current Price:
0.004885
Entry Targets:
1) 0.004657
Take-Profit Targets:
1) 0.006329
Stop Targets:
1) 0.003987
Published By: @Zblaba
CRYPTOCAP:BCH BINANCE:BCHBTC #BitcoinCash #PoW bitcoincash.org
Risk/Reward= 1:2.5
Expected Profit= +35.9%
Possible Loss= -14.4%
Estimated Gaintime= 4-7 months

Snowflake Inc Stock Quote | Chart & Forecast SummaryKey Indicators On Trade Set Up In General
1. Push Set Up
2. Range Set Up
3. Break & Retest Set Up
Notes On Session
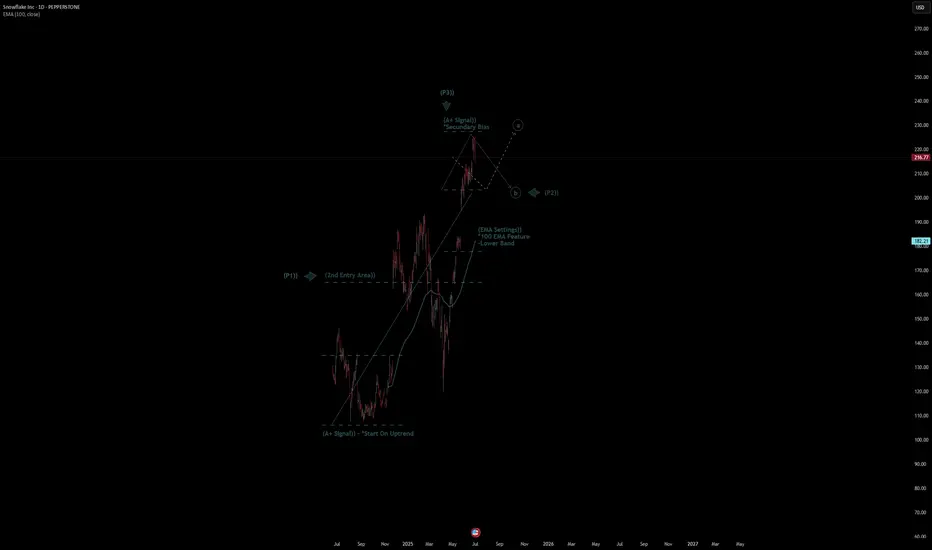
# Snowflake Inc Stock Quote
- Double Formation
* (A+ SIgnal)) - *Start On Uptrend | Completed Survey
* (2nd Entry Area)) | Subdivision 1
- Triple Formation
* (P1)) / (P2)) & (P3)) | Subdivision 2
* (TP1) = a / Long Consecutive Range
* (TP2) = b / Short Consecutive Pullback | Subdivision 3
* Daily Time Frame | Trend Settings Condition
- (Hypothesis On Entry Bias)) | Regular Settings
- Position On A 1.5RR
* Stop Loss At 201.00 USD
* Entry At 216.00 USD
* Take Profit At 240.00 USD
* (Uptrend Argument)) & No Pattern Confirmation
* Ongoing Entry & (Neutral Area))
Active Sessions On Relevant Range & Elemented Probabilities;
European-Session(Upwards) - East Coast-Session(Downwards) - Asian-Session(Ranging)
Conclusion | Trade Plan Execution & Risk Management On Demand;
Overall Consensus | Buy
Valero Breaks the DowntrendValero Energy spent more than a year in a downtrend, but some traders may think conditions have changed.
The first pattern on today’s chart is the series of lower highs between April 2024 and May 2025. VLO pushed above that falling trendline last month and has remained there since. That may suggest its longer-term direction is turning higher.
Second is the price area between roughly $132 and $136. The oil refiner peaked there in March, April and May. But it made a low in the same zone last week and this week. Is old resistance becoming new support?
Third, prices have remained above the rising 21-day exponential moving average. They’re also above the 200-day simple moving average. Those patterns may be consistent with emerging bullishness in the short and long terms.
Check out TradingView's The Leap competition sponsored by TradeStation.
TradeStation has, for decades, advanced the trading industry, providing access to stocks, options and futures. If you're born to trade, we could be for you. See our Overview for more.
Past performance, whether actual or indicated by historical tests of strategies, is no guarantee of future performance or success. There is a possibility that you may sustain a loss equal to or greater than your entire investment regardless of which asset class you trade (equities, options or futures); therefore, you should not invest or risk money that you cannot afford to lose. Online trading is not suitable for all investors. View the document titled Characteristics and Risks of Standardized Options at www.TradeStation.com . Before trading any asset class, customers must read the relevant risk disclosure statements on www.TradeStation.com . System access and trade placement and execution may be delayed or fail due to market volatility and volume, quote delays, system and software errors, Internet traffic, outages and other factors.
Securities and futures trading is offered to self-directed customers by TradeStation Securities, Inc., a broker-dealer registered with the Securities and Exchange Commission and a futures commission merchant licensed with the Commodity Futures Trading Commission). TradeStation Securities is a member of the Financial Industry Regulatory Authority, the National Futures Association, and a number of exchanges.
TradeStation Securities, Inc. and TradeStation Technologies, Inc. are each wholly owned subsidiaries of TradeStation Group, Inc., both operating, and providing products and services, under the TradeStation brand and trademark. When applying for, or purchasing, accounts, subscriptions, products and services, it is important that you know which company you will be dealing with. Visit www.TradeStation.com for further important information explaining what this means.

Paramount Global | PARA | Long at $11.00 (Jan '26 Call Options)Paramount Global NASDAQ:PARA may be gearing up for a price move to reach my historical simple moving average (white and green lines). It appears to be consolidating in the $9-$11 range, but the company is on shaky grounds. Currently, their debt is not well covered by operating cash flow, the dividend of 1.82% is not well covered by earnings, and there has been some insider selling lately. But earnings and cashflow are expected to grow in the future. So, it's a tossup in terms of fundamentals if the future actually plays out. Thus, while I have no desire to hold shares given the risks, the chart is enticing. January 2026 call options (strike of $12.50) are $0.90 each and that may be enough time for this to either move up or implode. The personal risk is small, but the reward could be generous.
Target #1 - $12.50 (January 16, 2026 call options, priced at $0.90 each)

BCH | Long-Term Bullish StructureBitcoin Cash presents an attractive long-term bullish structure with multiple technical confluences suggesting higher prices ahead. The patient approach of waiting for the VWAP retest provides optimal entry conditions for this long-term bullish thesis, rather than chasing current elevated prices.
Technical Analysis:
Strong support zone holding at $303.62 with multiple successful tests
365-day VWAP trending upward around $400-420, acting as dynamic support
Descending resistance from previous highs being challenged
Entry Strategy:
Traders should wait for a pullback to the 365-day VWAP ($400-420 zone) before entering long
positions.
This approach offers:
Better risk/reward ratio
Clear stop placement below major support at $300
Entry at a proven dynamic support level
Key Levels:
Entry: $400-420 (VWAP pullback)
Stop: Below $300 support
Target: Above descending trendline toward $600+

Monster Beverage: Breakout and PullbackMonster Beverage broke out to a new all-time high in May, and now it’s pulled back.
The first pattern on today’s chart is the March 2024 high of $61.23. The maker of energy drinks hesitated at that level in early May but pulled back to hold it last week. Has old resistance become new support?
Second, MNST is trying to stabilize at its rising 50-day simple moving average. That may reflect a bullish intermediate-term trend.
Third, the most recent dip pulled stochastics into oversold territory.
Finally, bullish price action after the last two earnings reports may reflect positive sentiment.
Check out TradingView's The Leap competition sponsored by TradeStation.
TradeStation has, for decades, advanced the trading industry, providing access to stocks, options and futures. If you're born to trade, we could be for you. See our Overview for more.
Past performance, whether actual or indicated by historical tests of strategies, is no guarantee of future performance or success. There is a possibility that you may sustain a loss equal to or greater than your entire investment regardless of which asset class you trade (equities, options or futures); therefore, you should not invest or risk money that you cannot afford to lose. Online trading is not suitable for all investors. View the document titled Characteristics and Risks of Standardized Options at www.TradeStation.com . Before trading any asset class, customers must read the relevant risk disclosure statements on www.TradeStation.com . System access and trade placement and execution may be delayed or fail due to market volatility and volume, quote delays, system and software errors, Internet traffic, outages and other factors.
Securities and futures trading is offered to self-directed customers by TradeStation Securities, Inc., a broker-dealer registered with the Securities and Exchange Commission and a futures commission merchant licensed with the Commodity Futures Trading Commission). TradeStation Securities is a member of the Financial Industry Regulatory Authority, the National Futures Association, and a number of exchanges.
TradeStation Securities, Inc. and TradeStation Technologies, Inc. are each wholly owned subsidiaries of TradeStation Group, Inc., both operating, and providing products and services, under the TradeStation brand and trademark. When applying for, or purchasing, accounts, subscriptions, products and services, it is important that you know which company you will be dealing with. Visit www.TradeStation.com for further important information explaining what this means.

Gold (XAUUSD) – FRL Classic Double Bottom After CorrectionGold forms a clean double bottom after a correction within an upward channel.
The neckline aligns precisely with the 100 MA – a classic Fractal Reversal Law (FRL) setup, indicating a phase shift back into the bullish structure.
Why This Setup:
✅ Trend Structure:
Gold remains inside its upward channel, respecting each phase with corrective trends that end with clear reversal patterns.
✅ FRL Double Bottom:
• The corrective downtrend completes with a double bottom.
• The neckline is strictly horizontal, matching the start of the last impulse (FRL principle).
• Alignment with the 100 MA confirms the phase and scale.
✅ Confirmation:
We wait for a full H4 candle close above the neckline for entry confirmation.
Trade Plan:
📈 Entry:
After H4 confirmation above the neckline or on a retest of the neckline.
🎯 Targets:
Take Profits are aligned with the key levels from the chart:
• TP1: First resistance in the mid-channel zone.
• TP2: Next resistance level within the channel.
• TP3: Upper channel boundary.
🛑 Stop Loss:
Placed just below the smaller low of the double bottom, maintaining a clean and logical risk structure.
FRL Key Notes:
Every correction is also a trend that ends with a reversal pattern.
The neckline = the beginning of the last impulse, always horizontal.
The 100 MA is used to align the timeframe with the market phase.

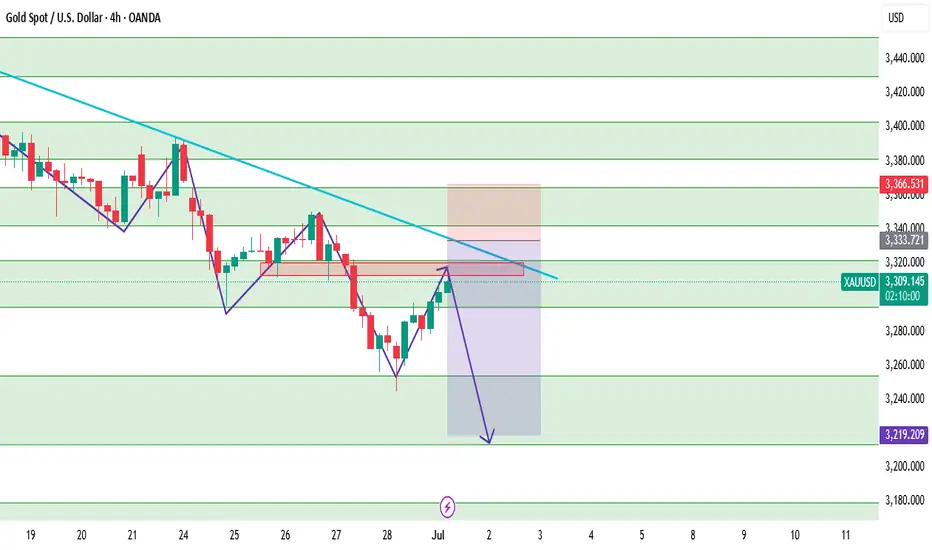
XAUUSD – Technical Outlook 4HXAUUSD is currently undergoing a corrective move after last week's bearish continuation. Price is now testing the minor resistance zone of 3295–3322, and could potentially extend the correction to test the descending trendline near 3333–3342.
The overall market structure remains bearish, with lower highs and lower lows clearly intact. Price has yet to break above the dynamic resistance trendline or the key swing high at 3366 — making any bullish move at this stage corrective, not a reversal.
Unless we see a strong bullish break and close above 3366, we expect sellers to return once price reaches the trendline or supply area around 3333–3342.
📌 Trade Plan (Sell on Pullback)
Sell Limit: 3333–3342
SL: 3368
TP1: 3296
TP2: 3255
TP3: 3220
📊 Key Levels:
R2: 3342
R1: 3322
Pivot: 3295
S1: 3254
S2: 3214
S3: 3180
Summary: Wait for bearish confirmation at the supply zone before entering. Bias remains bearish until proven otherwise by a structural break above 3366. Use smaller lot size or scale in slowly if price approaches the sell zone with weak bullish momentum.
I'm betting on the rise of the S\&P 500, therefore I'm betting oWe broke through the local level and are confidently moving toward the all-time high.
We are also above all moving averages, which gives us additional confidence in our trade.

Whales Dump on Wall Street, Fueling Bitcoin's 'Inevitable' SurgeIn the high-stakes world of cryptocurrency, where fortunes are made and lost in the blink of an eye, a new narrative is taking shape. With Bitcoin's price hypothetically hovering around a robust $107,000, a significant portion of market analysis now suggests that a new all-time high is not just a possibility, but an inevitability. This confidence stems from a complex interplay of technical strength, unprecedented institutional demand, and a massive, yet healthy, transfer of wealth from early adopters to the new titans of finance.
The market is currently witnessing a fascinating dynamic: while the price consolidates above the monumental $100,000 psychological barrier, long-term holders, often referred to as "OG whales," are systematically selling their holdings. This activity, which could be misconstrued as bearish, is being interpreted by many as a necessary and constructive phase. Instead of suppressing the price, this distribution is meeting a voracious appetite from Wall Street, primarily through the mechanism of spot Bitcoin Exchange-Traded Funds (ETFs). This creates a state of equilibrium, a period of sideways consolidation where the market digests enormous gains and builds a foundation for its next explosive move. The target on the horizon is a liquidity cluster around $109,000, a key level that, if decisively flipped to support, could unlock a path to uncharted territory.
This article will delve into the multifaceted dynamics of this hypothetical market scenario. It will explore the significance of consolidating above $100,000, dissect the "great transfer" of Bitcoin from early believers to institutional giants, and analyze the technical and on-chain metrics pointing toward an imminent breakout. Finally, it will consider the potential risks and counterarguments that could challenge the prevailing bullish thesis, providing a comprehensive overview of a market at a pivotal crossroads.
Part 1: The New Paradigm - Consolidating Above $100,000
The act of breaking and holding a price level as significant as $100,000 represents more than just a numerical achievement; it is a profound psychological and structural shift for Bitcoin. In this hypothetical scenario, the market is not just visiting this level but is actively building a base above it, a process known as consolidation. This phase is crucial, characterized by sideways price movement within a defined range, often accompanied by decreasing trading volume, as the market takes a collective breath and establishes a new sense of fair value.
The Psychology of a Six-Figure Asset
For years, $100,000 was a distant, almost mythical target for Bitcoin. Surpassing and, more importantly, sustaining this level transforms market perception. It solidifies Bitcoin's status as a mature, global macro asset, moving it further away from its speculative past. This psychological victory attracts a new wave of capital from more conservative investors, wealth funds, and corporations who may have been hesitant to enter before such a milestone was reached. The consolidation phase above this level acts as a proof of stability, demonstrating that the asset can absorb significant profit-taking without collapsing, thereby building trust and confidence for the next wave of adoption.
Market Structure and Institutional Support
This period of stability is not happening in a vacuum. It is underpinned by a fundamental change in market structure, primarily the advent and overwhelming success of spot Bitcoin ETFs. These regulated financial products have provided a seamless bridge for Wall Street to pour billions of dollars into Bitcoin, creating a formidable wall of buy-side demand. In this scenario, where Bitcoin oscillates between $102,000 and $110,000, spot ETFs would be consistently recording massive net inflows, absorbing the supply being offered by sellers.
This dynamic is a textbook example of healthy consolidation. It is a tug-of-war where the immense selling pressure from profit-takers is effectively matched by the persistent buying pressure from new institutional entrants. This prevents a sharp price decline and allows the market to methodically transfer coins from one cohort to another without inducing panic. Technically, this phase often forms recognizable patterns like sideways ranges, bullish flags, or ascending triangles, all of which suggest that pressure is building for an eventual breakout to the upside. The decreasing volume during this time indicates that the market is reaching an equilibrium before the next major directional move.
Historical Precedent in a New Era
Bitcoin has experienced consolidation phases after breaking previous major milestones, such as $1,000 and $20,000. However, the current hypothetical consolidation above $100,000 is fundamentally different in both scale and participants. Previous cycles were largely driven by retail investors and a smaller group of early adopters. The current cycle is defined by the heavyweight presence of institutional players who bring not only massive capital but also a long-term strategic investment horizon.
The amount of capital required to absorb selling pressure at a six-figure price point is orders of magnitude greater than in any previous cycle. The fact that the market can achieve this stability highlights the depth and maturity it has developed. While past consolidations were precursors to further retail-driven mania, the current phase is about the systematic absorption of early investor supply by the largest financial institutions in the world, setting the stage for a rally built on a much stronger and more diverse foundation. This isn't just a pause; it's the construction of a launchpad for the next chapter in Bitcoin's story.
Part 2: The "Great Transfer" - Long-Term Holders vs. Wall Street
At the heart of the market's current dynamic is a historic transfer of wealth. This is the moment where the earliest and most steadfast believers in Bitcoin, the "OG Whales" or Long-Term Holders (LTHs), are realizing their life-changing gains by selling to the new behemoths of the financial world: Wall Street institutions. This process is not the bearish signal it might imply, but rather a critical market function that fuels the bull run's continuation.
Defining the Players: "OG Whales" and Long-Term Holders
Long-Term Holders (LTHs) are typically defined in on-chain analysis as addresses that have held their Bitcoin for more than 155 days (approximately five months). These are investors who have weathered significant volatility and have a deep conviction in the asset. "OG Whales" are a subset of this group, representing individuals or entities who accumulated vast amounts of Bitcoin in its nascent stages, often at prices of three figures or less. For them, selling at over $100,000 represents astronomical returns on their initial investment.
Their motivation to sell is rational and expected. It is a common market pattern for patient bottom buyers to take profits as the market approaches and surpasses new all-time highs. They understand that the euphoria surrounding these record prices is what attracts the necessary buy-side demand to absorb their large sell orders. This selling, or "distribution," is a hallmark of every Bitcoin bull market peak. The key question is whether the demand is strong enough to absorb this supply without crashing the price.
Deconstructing the "Dumping on Wall Street" Narrative
The essence of this transfer is that since the launch of spot Bitcoin ETFs, LTHs have been the primary source of selling pressure. They are, in effect, providing the liquidity that the newly launched ETFs require to meet the relentless demand from their clients.
This dynamic is precisely why the price has been able to stabilize at such high levels. The institutional buying frenzy is absorbing the supply unloaded by LTHs. This is not a malicious act of suppression but a symbiotic relationship: LTHs need massive buyers to sell to, and Wall Street needs massive sellers to source coins from. This is simply the natural ebb and flow of a market cycle where supply and demand are meeting at a new, higher equilibrium.
On-Chain Evidence of a Healthy Distribution
Several on-chain metrics provide a clear window into this phenomenon, confirming that the current selling is a sign of a healthy bull market, not an impending top.
• Spent Output Profit Ratio (SOPR): This metric shows the degree of realized profit for all coins moved on-chain. In this scenario, the LTH-SOPR would be extremely high, indicating that the coins being sold were acquired at a much lower cost basis and are now being sold for massive profits. While this signals profit-taking, it is typical of a bull market and, on its own, does not signal a top.
• Realized Profit: On-chain data would show a massive spike in realized profits, confirming that sellers are locking in gains. The market's ability to absorb these profits and continue consolidating is a sign of immense strength.
• Coin Days Destroyed (CDD) / Value Days Destroyed (VDD): These metrics measure the activity of older coins. A spike in VDD is synonymous with the LTH cohort spending their coins. This typically peaks shortly after breaking all-time highs because sellers need the liquidity that new buyers bring. The fact that this selling is being met with such strong institutional demand prevents it from turning into a bear market trigger.
• Long-Term Holder Supply: While some LTHs are selling, the overall supply held by this cohort may still be growing or stabilizing. This is because investors who bought six months prior are continuously "aging" into LTH status. This indicates that while the oldest hands are selling, a new generation of convicted holders is forming, providing a solid foundation for the market.
In essence, the "great transfer" is a feature, not a bug, of the current bull market. It is a sign of Bitcoin's maturation, where the asset is moving from the strong hands of early pioneers to the deep pockets of the global financial system. This process allows the market to de-risk, shed its over-leveraged players, and build a stronger base for what many believe is the inevitable next leg up.
Part 3: The Path to $109K and Beyond - Technical and Liquidity Analysis
With the market having established a strong foundation above $100,000, all eyes turn to the next key resistance levels. Technical and on-chain analysis points to a significant cluster of liquidity around the $109,000 mark, which is viewed as the final hurdle before Bitcoin can enter a new phase of price discovery. The argument for the "inevitability" of a new all-time high rests on a confluence of bullish technical patterns, resetting momentum indicators, and the overwhelming force of market liquidity.
Understanding Liquidity at $109,000
In financial markets, liquidity refers to the ease with which an asset can be bought or sold without causing a significant price change. On a price chart, liquidity is concentrated at levels with a high density of buy and sell orders. The area around $109,000 to $111,000 represents a major liquidity cluster. This is composed of:
• Sell Orders (Asks): A large number of investors who bought at lower prices have placed take-profit orders at this psychological and technical level.
• Short Position Liquidations: Traders who are betting against Bitcoin have placed their stop-losses above this resistance. If the price breaks through, these short positions are automatically closed with a buy order, creating a "short squeeze" that adds explosive fuel to the rally.
Analysis of order book data shows significant liquidation levels stacked just above this zone. Successfully breaking through and absorbing this sell-side liquidity would remove a significant barrier, clearing the path for a rapid move higher. A decisive flip of the $109,000 level from resistance to support is what bulls are watching for as the ultimate confirmation of upward momentum.
Bullish Technical Indicators
The consolidation phase has allowed Bitcoin's technical indicators to cool off and prepare for the next advance.
• Chart Patterns: On higher timeframes, the price action is forming classic bullish continuation patterns. There is potential for formations like an inverted head-and-shoulders pattern or a bullish engulfing candlestick, both of which have historically high success rates in predicting upward moves. A bullish engulfing pattern on the daily chart, for instance, has shown a high probability of leading to new local highs when appearing in a broader uptrend.
• Momentum Oscillators: Indicators like the Relative Strength Index (RSI) and the MACD (Moving Average Convergence Divergence) have likely reset from "overbought" conditions during the consolidation. This reset is healthy and necessary, allowing momentum to build again from a neutral base rather than an overheated one. It signals that the market has shed its speculative froth and is ready for a more sustainable trend.
• Moving Averages: Throughout the consolidation period, the price would find strong support at key moving averages, such as the 21-week exponential moving average (EMA) or the 50-day simple moving average (SMA). These levels act as dynamic support, with dip buyers consistently stepping in, reinforcing the strength of the underlying trend.
•
The "Inevitability" Thesis Synthesized
The argument that a new all-time high is "inevitable" is built on the convergence of these powerful forces:
1. Unprecedented Demand: The constant, price-agnostic inflows from spot Bitcoin ETFs provide a demand floor that the market has never experienced before.
2. Supply Absorption: The selling pressure from long-term holders, which would have crushed the market in previous cycles, is being successfully absorbed by this new institutional demand.
3. Healthy Reset: The market has undergone a healthy consolidation, allowing technicals to cool off, leverage to be flushed out, and a strong support base to be built.
4. Psychological Breakthrough: The conquest of the $100,000 level has fundamentally altered market perception and opened the door to price discovery, with the next logical target being the liquidity pool at $109,000.
While no outcome in financial markets is ever truly guaranteed, the confluence of persistent institutional buying, constructive on-chain dynamics, and bullish technical setups creates a powerful case that Bitcoin is coiling for a significant breakout. The move through $109,000 is seen not as a question of "if," but "when."
Part 4: Risks and Counterarguments
Despite the overwhelmingly bullish sentiment in this hypothetical scenario, a prudent analysis requires examining the potential risks and counterarguments that could challenge or delay the ascent to new all-time highs. The cryptocurrency market remains susceptible to a variety of internal and external shocks, and overconfidence can be a precursor to sharp corrections.
Macroeconomic Headwinds
Bitcoin's increasing integration into the global financial system means it is more sensitive to macroeconomic conditions than ever before. A sudden and severe global recession, an unexpected spike in inflation leading to aggressive monetary tightening by central banks, or major geopolitical conflicts could trigger a "risk-off" event across all asset classes, including Bitcoin. Investors might flee to the perceived safety of cash or government bonds, causing even the strong institutional demand for Bitcoin to waver. It is often noted that traders wait for clarity on key macroeconomic data and policy updates before committing to a trend, and any negative surprises could trigger a sell-off.
Overwhelming Profit-Taking
The thesis of a new all-time high hinges on the ability of institutional demand to absorb the selling from long-term holders. However, there is a risk that this supply could become too overwhelming. The profits held by early investors are immense, and there may be a price point—perhaps on the approach to $110,000 or just beyond—where profit-taking accelerates to a pace that even the ETFs cannot sustain. If a large cohort of whales decides to sell in unison, it could create a supply shock that temporarily breaks the market structure and forces a deeper correction.
Market Exhaustion and Valuation Metrics
While consolidation is healthy, a prolonged sideways period can sometimes signal exhaustion rather than accumulation. On-chain metrics that compare Bitcoin's market value to its realized value are crucial for gauging how overheated the market is. These tools help identify periods of extreme overvaluation. If such metrics were to enter their highest zones, it would suggest that the market is reaching peak froth, making it vulnerable to a sharp reversal, regardless of the positive narrative. It is understood that while Bitcoin's price has a strong correlation to global liquidity, internal market dynamics can cause it to decouple, especially during periods of extreme valuation.
Regulatory and Black Swan Risks
The risk of unforeseen "black swan" events always looms over the market. This could include a sudden and harsh regulatory crackdown in a major jurisdiction, the collapse of a major crypto exchange or institution, or the discovery of a critical flaw in the Bitcoin protocol itself. Furthermore, the concentration of Bitcoin within a few large ETF products, while providing demand, also introduces a new vector of risk. If these institutions were to face regulatory pressure or decide to offload their holdings for strategic reasons, the resulting sell pressure could be catastrophic.
In conclusion, while the path to a new all-time high appears clear and well-supported by current dynamics, it is by no means guaranteed. A combination of adverse macroeconomic shifts, overwhelming selling pressure, extreme valuations, or an unexpected black swan event could easily derail the bullish momentum. Investors and analysts must remain vigilant, balancing the optimistic on-chain and technical data with a realistic appreciation of the inherent risks in this volatile asset class.
Conclusion
The hypothetical scenario of Bitcoin consolidating above $100,000 while eyeing a breakout to $109,000 and beyond represents a pivotal moment in the asset's history. It paints a picture of a market that has achieved a new level of maturity, driven by a paradigm shift in its investor base. The central thesis—that a new all-time high is now "inevitable"—is not born from baseless hype, but from a powerful confluence of observable market forces.
The successful establishment of the six-figure price level as a support floor, rather than a speculative peak, is the first pillar of this argument. This consolidation is made possible by the voracious and sustained demand from Wall Street institutions, which are using spot Bitcoin ETFs to absorb the immense selling pressure from early adopters. This dynamic, the "great transfer" of Bitcoin from OG whales to institutional treasuries, is not a sign of a market top but a healthy and necessary distribution that de-risks the market and fuels the next leg of the bull run.
The on-chain analysis provides a framework for understanding this phase not as stagnation, but as a constructive consolidation where the market builds energy for a parabolic advance. This narrative is supported by bullish technical patterns, resetting momentum indicators, and a clear liquidity target at $109,000, which, once breached, could trigger a powerful short squeeze and propel Bitcoin into a new phase of price discovery.
However, this bullish outlook must be tempered with an awareness of the significant risks that remain. Macroeconomic instability, the sheer scale of potential profit-taking, and the ever-present threat of regulatory or black swan events could challenge the prevailing trend.
Ultimately, this analysis reveals a Bitcoin that is at a crossroads, but one where the path forward appears more clearly defined and well-supported than ever before. The interplay between the old guard of crypto and the new titans of finance is forging a stronger, more resilient market. While no outcome is certain, the evidence strongly suggests that Bitcoin is not at the end of its run, but is merely pausing to build a higher launchpad for its journey into the financial mainstream.

GBPUSD PullbackGBPUSD is in an overall bullish market
However, after a large bullish push, I am expecting price to pullback (sell off).
Price met resistance a weekly supply zone and closed as an indecision candle on the Daily.
The lower blue EMA crossed below the higher RED EMA on the 1hr chart.
Expecting price to selloff and find support at the 50.0 Fib level which also correlates with a demand zone, before continuing the overall trend.

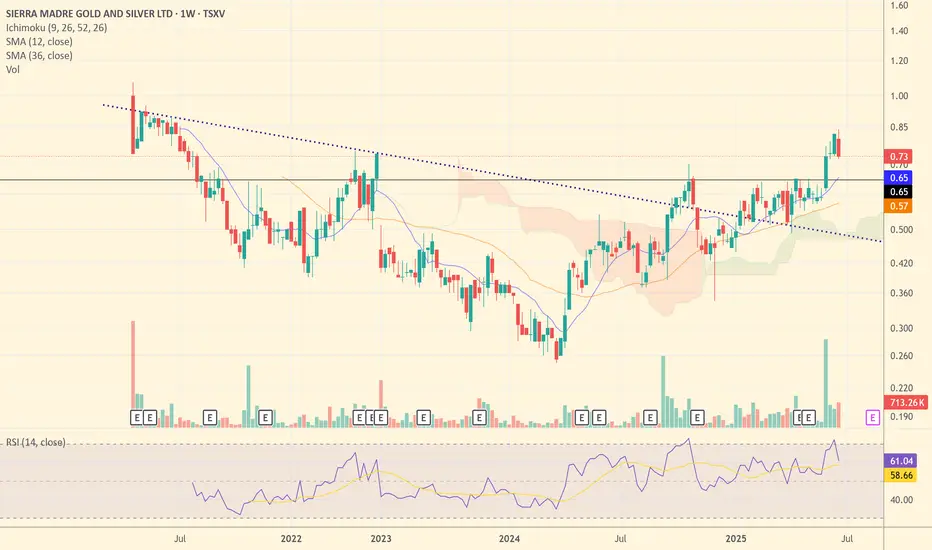
SM: Poised for Silver Alpha? - A Producer's Growth StorySierra Madre Gold and Silver (TSXV: SM) is shaping up to be a prime candidate for significant upside in a rising silver market. Having recently transitioned to commercial production and achieved positive cash flow in Q1 2025, SM has moved past the riskiest development hurdles and is now firmly in the "Production & Growth" phase of the Lassonde Curve.
Why SM Stands Out for Potential Upside:
- Operational Momentum: In Q1 2025, SM achieved positive cash flow with sales of 165,000 ounces of silver equivalent (AgEq), a critical milestone that validates the Guitarra project's viability.
- Improving Cost Structure: All-in Sustaining Costs (AISC) have been brought down to approximately $29/ounce AgEq. This efficiency directly translates to expanded margins as silver prices climb.
- Exponential Leverage to Silver Price: At a $40/ounce silver price scenario, SM's margin would jump to over $11/ounce AgEq. This significant increase in profitability is a powerful catalyst for share price appreciation, generating robust free cash flow for reinvestment.
- Clear Growth Catalysts: The company has ambitious plans to optimize operations, implement new flotation systems, and expand mill capacity to 1,200-1,500 tonnes per day. This could boost annual production to 2.5-3 million ounces of silver, creating substantial organic growth.
- Supportive Environment: A observed positive shift in the Mexican regulatory environment towards mining further enhances investment appeal.
Technical Analysis Snapshot:
SM's chart shows promising technical signs. After a period of consolidation (akin to a "valley" in the Lassonde Curve), the stock has recently experienced a breakout above a long-term downtrend line, signaling a potential shift from bearish to bullish sentiment. Volume accompanying this breakout is crucial for conviction. The stock appears to be establishing new support levels, indicating a potential accumulation phase. Investors should monitor for sustained trading above key moving averages and continued volume confirmation as indicators of a strengthening trend.
Risk-Reward Profile:
- Risk Profile: Medium to High (as a new, smaller producer with expansion execution risks)
- Potential Return at $40 Ag: Very High (due to dramatic profitability increase and accelerated growth)
Conclusion:
Sierra Madre Gold and Silver is well-positioned to capitalize on a bullish silver market. Its proven production, cost efficiency, and clear expansion roadmap make it a compelling candidate for significant price appreciation as silver prices head towards $40/ounce. For investors seeking "alpha" with a calculated approach to risk, SM offers a compelling growth story.
How To Short Sell This Forex Pair In A 4h (Time Frame) EntryAm always a curious person and thats what
allows me to penetrate any culture.I have this knack for adventure.
This is means i enjoy challenging myself.
I dont want to live a boring life.So even when i visit
a "Extremely High" poverty area, am good.
Because i know i have to check in.
Every place in the world has these places.
You have to check in with the G's of
that area otherwise you cooked!!. These areas
are notorious to high crime, and disease.
So if you dont check in bro you f'*d!
Remember every trading signal has to have a double confirmation
think of this double confirmation like
checking in the "hood".
You might be the king in your area
but in another area bro you aint the king.
You have to stay humble.
If you want to learn more you have to check in
with the financial trading experts like myself.
Is that fair? heck no.But you gots to check in man.
If you want more coaching just hit
me up for a reason fee on a monthly
basis and i got you.
Rocket boost this content to learn more.
Disclaimer:Trading is risky learn risk management
and profit taking strategies.Also don't use margin.
Use a simulation trading account
before you trade with real money.

$BTC Bullish Engulfing Weekly CloseCRYPTOCAP:BTC closes the Week with a Big Bullish Engulfing candle back within the POI.
Should retest ATH soon.

$SOL Bullish Engulfing On WeeklyCRYPTOCAP:SOL closes the week with a Bullish Engulfing candle.
50WMA at $170 next target to smash.

SP500 - Cycle Analysis; New V-Bottom24 Dec 2018 - V-Bottom Trough:
This marks a clean V-bottom. Both the 227-ROC and 114-ROC showed simultaneous positive acceleration after price reacing its low. Shortly after, both crossed their 57-SMA almost in sync — increasing the probability of a sustained bullish move. Price confirmed this by breaking resistance and forming a V pattern. This was further validated by the centered moving average crossover (114-CMA crossing above 227-CMA).
25 Mar 2020 - Deep COVID Crash Trough:
During this phase the priced broke below the support, creating a deep trough. Altough both ROC lines initially showed strong negative acceleration due to the COVID-19 crash, they soon reversed above their 57-SMAs, signaling a major shift in momentum. This coincided with the price breaking above the key resistance which was also crossed in 2019 when confirming the old V-pattern. After this breakout, a brief pullback followed before the uptrend resumed with increasing strength.
22 Jun 2021 to 19 Dec 2023 - Pattern
During the initial period a bearish divergence was visible in the ROC, nevertheless price and rate of change both declined making a low in early October 2022. A technical pattern began to form, which appears to align more closely with a symmetrical triangle; So when measuring its height and projecting it from the breakout point aligns with the new all-time highs that were reached on 27 June 2025.
21 Mar 2025 - New Cycle Trough
A new V-bottom formed shortly after the current cycle began. Both ROC indicators had already crossed their SMAs to the upside, showing early signs of positive acceleration, days before of price broke through the resistance and reached the new record high.
The 227-SMA is likely to cross from below the fast SMA while a possibility of a pullback increase.
Following that, the 114-CMA will probably has the chance to cross back the 227-CMA, with the price potentially confirming a new support level and resuming its uptrend - in line with the broader cycle timeline.
