GOOGL potential break and retestGOOGL strong break of 171.2 level, if it comes back down to retest and hold it could go up to 175.35 and would probably line up with a 9 ema test
Moving Averages

ETH Technical Structure: Bullish Bias Unless This Level BreaksEthereum is at an interesting spot.
After forming a clear bullish structure with Higher Highs (HH) and Higher Lows (HL), ETH entered an accumulation zone right below the key resistance zone.
Currently, price is retesting the 50 EMA + 100 EMA confluence zone — a critical area of demand. This level has previously acted as a strong support, and the Stoch RSI is bouncing from oversold territory, signalling possible bullish momentum ahead.
If ETH holds this accumulation zone and the EMA support, we could see another push toward the key resistance zone or even a breakout. However, if this zone fails, a deeper pullback toward lower support levels is likely.
For now, watch how price reacts here — this is a decision point.
If you liked it, do comment and follow us for regular market updates.
THANK YOU

Imperial Brands Stock Quote | Chart & Forecast SummaryKey Indicators On Trade Set Up In General
1. Push Set Up
2. Range Set up
3. Break & Retest Set Up
Notes On Session
# Imperial Brands Stock Quote
- Double Formation
* (Box Thinking Bias)) - *A+ | Completed Survey
* (Uptrend Argument)) - *2nd Entry Area | Subdivision 1
- Triple Formation
* (P1)) / (P2)) & (P3)) | Subdivision 2
* (TP1) | Subdivision 3
* Daily Time Frame | Trend Settings Condition
- (Hypothesis On Entry Bias)) | Indexed To 100
- Position On A 1.5RR
* Stop Loss At 142.00 GBP
* Entry At 160.00 GBP
* Take Profit At 183.00 GBP
* (Uptrend Argument)) & No Pattern Confirmation
* Ongoing Entry & (Neutral Area))
Active Sessions On Relevant Range & Elemented Probabilities;
European-Session(Upwards) - East Coast-Session(Downwards) - Asian-Session(Ranging)
Conclusion | Trade Plan Execution & Risk Management On Demand;
Overall Consensus | Buy

Team Internet Group Stock Quote | Chart & Forecast SummaryKey Indicators On Trade Set Up In General
1. Push Set Up
2. Range Set up
3. Break & Retest Set Up
Notes On Session
# Team Internet Group Stock Quote
- Double Formation
* (A+ Set Up))
# Diagonal / Short Settings | Completed Survey
* (Neutral Area)) - *A+| Subdivision 1
- Triple Formation
* (P1)) & (P2))| Subdivision 2
* (TP1) | Subdivision 3
* Daily Time Frame | Trend Settings Condition
- (Hypothesis On Entry Bias)) | Regular Settings
- Position On A 1.5RR
* Stop Loss At 84.00 GBP
* Entry At 64.00 GBP
* Take Profit At 34.00 GBP
* (Downtrend Argument)) & No Pattern Confirmation
* Ongoing Entry & (Neutral Area))
Active Sessions On Relevant Range & Elemented Probabilities;
European-Session(Upwards) - East Coast-Session(Downwards) - Asian-Session(Ranging)
Conclusion | Trade Plan Execution & Risk Management On Demand;
Overall Consensus | Sell


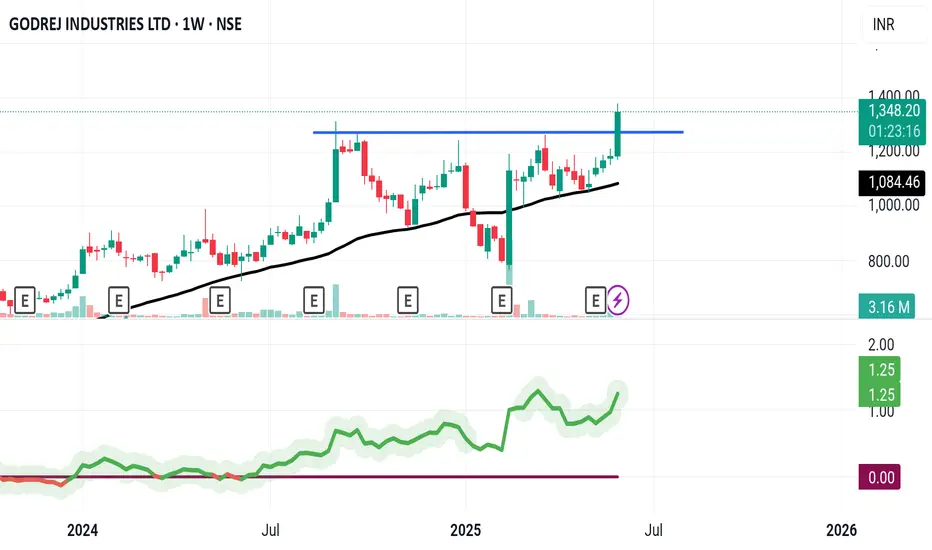
GODREJ INDUSTRIES LTDBreakout happend in this stock with rising 200dma and RS indicator is also showing strength.
Keep your risk and reward ratios according to your own preferance.
This is for educational purpose, do your own research before investing.
Ethereum & June's pivot supportEthereum price is now playing below the 200 daily MA, but the price about 2350 is the pivot and holding as a support, and I'm expecting to see upside movement in the coming days to about 3400 which is the resistance 2 for the pivot.

Consolidation Breakout forming on Dhampur Sugar1. Stock is consolidating below 151 resistance, forming higher lows with a bullish structure.
a breakout required above 151 with strong volume to a fresh bullish move.
2. price action shows a volatility contraction.
3. moving averages sloping up trend intact. wait for volume breakout and bullish close.
4. volume has since declined but remains stable, showing healthy consolidation.

$TOTAL Crypto Market Cap Meltdown As suspected, a head and shoulders pattern has formed on the CRYPTOCAP:TOTAL Crypto Market Cap.
We could see a big relief rally with the golden cross happening today, but i expect the market to sell off to 2.85T before seeing any real signs of reversal.
RSI also shows more downside ahead on the Daily.

DYNAMIC CABLES LTDStock fundamentally strong
Breakout with DOJI above key resistance and both EMAs.
Strong volume spike.
Bullish structure with higher highs and higher lows and trend line support.

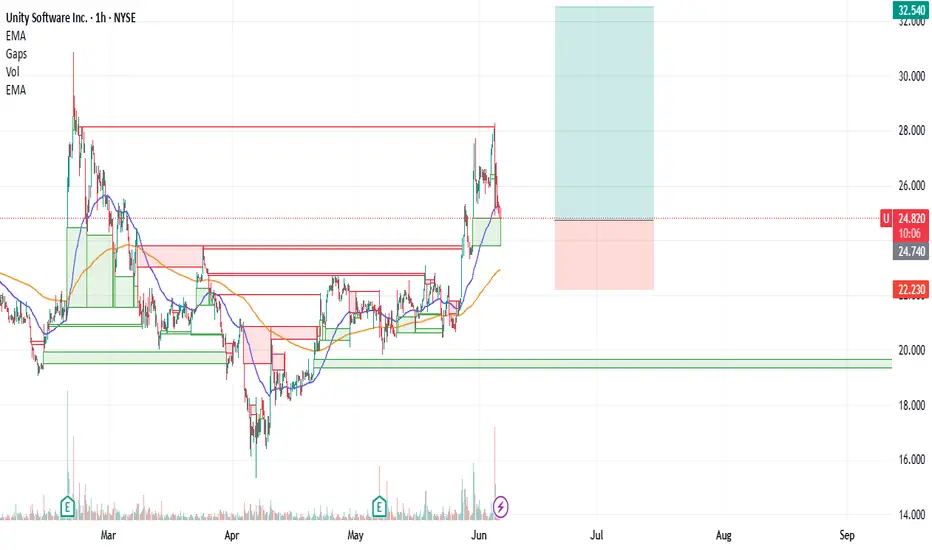
U : Long There were both good and bad developments for Unity.
While the joint project opportunity with BMW Group is very positive news,
Departure of the current CEO was negative news.
Technically, it is above the 50 and 200 period moving averages, and the 50 period ema is also above the 200 period ema.
A risk/reward ratio of 3.00 can be evaluated, with the Stop-Loss being close to the 200-period ema and the target price being targeted at the large gap closing value.(Small position size)
Entry : 24.76 - 24.81
Risk/Reward Ratio : 3.00
Stop-Loss : 22.23
Take Profit Level: 32.54
NBIS : Long worth TryingNebius group stocks are technically strong.
The downtrend since November 9, 2021 has been broken and the price is trading above the 50 and 200-period moving averages.
When we draw a medium-term Fibonacci level, we can take the take profit point at 0.618 and the stop-loss point at 0.382.
This gives us a Risk/Reward Ratio of 3.00.
A small position size is ideal.
Risk/Reward Ratio : 3.00
Stop-Loss : 43.46
Take-Profit : 60.00

Bitcoin 4 hour update and longer term outlook for next 5 days
Bitcoin is in a Rising channel after dropping.
This can be easily called a BEAR FLAG and it needs to be paid attention to for a number of reasons.
The line of support that held PA up in May is now close overhead resistance and we are climbing towards an apex around 11 June.
PA always reacts before APEX
I would expect this to happen from the 8th June but could obviously happen before.
I can see PA dropping to around 102K, on the POC ( red dotts ) off the VRVP
We will have to see what happens form there but there is a strong line of support just below this.
The 4 hour MACD is currently being rejected from Neutral back down into oversold.
The Daily MACD is continuing to fall Bearish and will reach neutral bu the weekend, the 7th
This could be the beginning of a longer term Bearish move and could end up back in the mid 95K before it finishes over the next 8 weeks
HOWEVER, PA does have the ability to turn the tables on the newly woken Bears
We will have to take this a step at a time right now.
But as emtioned in apost earlier today, I do expect us to NOT move to much higher in the near future but more to range once again, maybe for up to 8 - 10 Weeks
We shall see and watching the Dominance chars right now is a VERY good idea

Stocks on the rise...The NASDAQ is on its way to print a new ATH. Shoutout to the lads still waiting on a 2008-style meltdown.
Target Sputters as Market Recovers Target has sputtered as the broader market recovers, and some traders may think the retailer has further downside risk.
The first pattern on today’s chart is the steady decline between early February and early April. TGT tried to stabilize after the move but barely rebounded. It also failed to hold the rally on May 12 after Treasury Secretary Scott Bessent cut tariffs on China. That feeble price action may suggest sellers remain in control.
Second, the stock spent about a month at its 50-day simple moving average (SMA) early this year before continuing lower. It’s now spent about three weeks at the same line without closing above it. Is the intermediate-term trend still bearish?
Third, the move between April 8 and May 20 may be viewed as a potentially bearish flag that’s now broken to the downside.
Next, the 8-day exponential moving average (EMA) recently crossed below the 21-day EMA. MACD has also turned negative. Those patterns may reflect a bearish short-term trend.
Finally, TGT is an active underlier in the options market. (It averages more than 70,000 contracts per day, according to TradeStation data.) That could help traders take positions with calls and puts.
Check out TradingView's The Leap competition sponsored by TradeStation.
TradeStation has, for decades, advanced the trading industry, providing access to stocks, options and futures. If you're born to trade, we could be for you. See our Overview for more.
Past performance, whether actual or indicated by historical tests of strategies, is no guarantee of future performance or success. There is a possibility that you may sustain a loss equal to or greater than your entire investment regardless of which asset class you trade (equities, options or futures); therefore, you should not invest or risk money that you cannot afford to lose. Online trading is not suitable for all investors. View the document titled Characteristics and Risks of Standardized Options at www.TradeStation.com . Before trading any asset class, customers must read the relevant risk disclosure statements on www.TradeStation.com . System access and trade placement and execution may be delayed or fail due to market volatility and volume, quote delays, system and software errors, Internet traffic, outages and other factors.
Securities and futures trading is offered to self-directed customers by TradeStation Securities, Inc., a broker-dealer registered with the Securities and Exchange Commission and a futures commission merchant licensed with the Commodity Futures Trading Commission). TradeStation Securities is a member of the Financial Industry Regulatory Authority, the National Futures Association, and a number of exchanges.
Options trading is not suitable for all investors. Your TradeStation Securities’ account application to trade options will be considered and approved or disapproved based on all relevant factors, including your trading experience. See www.TradeStation.com . Visit www.TradeStation.com for full details on the costs and fees associated with options.
Margin trading involves risks, and it is important that you fully understand those risks before trading on margin. The Margin Disclosure Statement outlines many of those risks, including that you can lose more funds than you deposit in your margin account; your brokerage firm can force the sale of securities in your account; your brokerage firm can sell your securities without contacting you; and you are not entitled to an extension of time on a margin call. Review the Margin Disclosure Statement at www.TradeStation.com .
TradeStation Securities, Inc. and TradeStation Technologies, Inc. are each wholly owned subsidiaries of TradeStation Group, Inc., both operating, and providing products and services, under the TradeStation brand and trademark. When applying for, or purchasing, accounts, subscriptions, products and services, it is important that you know which company you will be dealing with. Visit www.TradeStation.com for further important information explaining what this means.

AUDUSD SELL OPPORTUNITY Don't be deceived
Sell opportunity on AUDUSD
Entry: 1.65000
Sl: 1.65200
TP: 1.6400
Comment your opinion
Follow me on X for account management

GBPUSD: Potential Reversal After Strong RallyThe British Pound has shown strong gains against the US Dollar, approaching a key resistance area. After such an extended move, a correction or reversal would be a logical expectation.
Technical Setup
There is a clear series of bearish divergences on the CCI (14) indicator. Price is forming a narrowing rising wedge, which often signals trend exhaustion.
Trade Plan
Sell limit orders: 1.3690 and 1.3850
Market entry: Only after confirmation — either a trendline break or a moving average crossover
Conclusion
GBPUSD shows signs of weakening at the top. I remain focused on short setups from resistance areas, waiting for confirmation to act.

AAPL Bounce at 200 EMA- Remains in ascending channelAAPL has been in ascending price channel since August 2020. At the end of April we saw a retest of support where it temporarily broke through, tested the 200 ema, bounced, then broke back above the previous support line. I believe AAPL will remain in this channel and price will continue to rise with an eventual retest of resistance.

BTCUSD - Further retracement to 97700 after protracted reversalOn the daily chart, a large head and shoulders pattern appears close to completion, suggesting a potential reversal of the recent uptrend. The formation is somewhat uneven, but in volatile markets like this one, clean textbook patterns are rarely seen.
Continued bullish sentiment has slowed the reversal, with buyers stepping in to support the price during each dip.
If we consider the April to May uptrend as a single move, the first Fibonacci retracement level aligns with support at 103,000. This level has been respected on both sides of the head and also serves as the neckline of the head and shoulders pattern. A break below 103,000 in the coming days could open the way toward the next support level near 98,000.
The right shoulder has not yet fully developed. Unless the price moves decisively above 106,900, we may continue to see the kind of sideways movement that formed the left shoulder, leading up to a potential breakout to the down side.
Should the price break above 107,000 with strong momentum, the pattern could fail, potentially triggering a bullish breakout and a long opportunity. However, recent candles appear more bearish than those of previous sessions.
Decreasing volume trend across the H&S pattern, along with a falling RSI and a bearish MACD crossover, provides further evidence of a reversal. The momentum appears to be shifting in favour of the bears, while the bulls are losing steam.

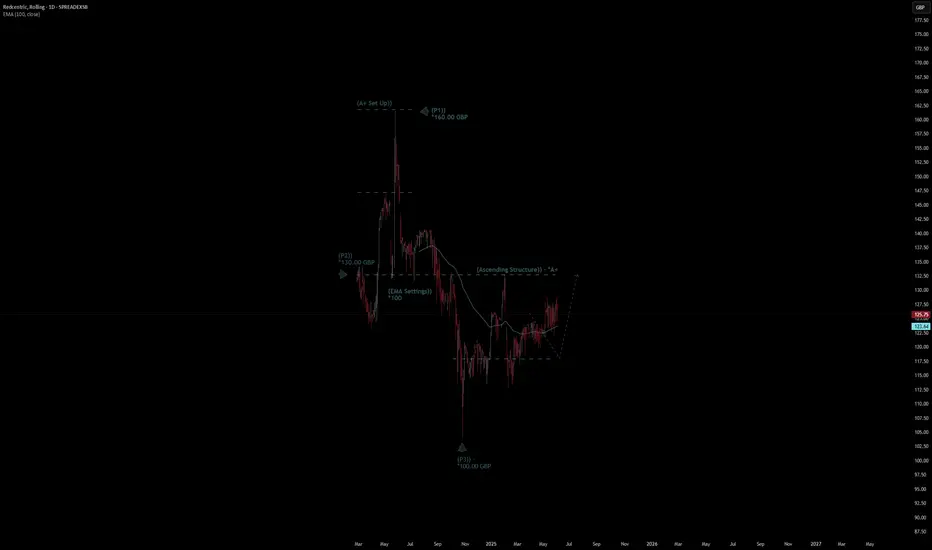
Redcentric Stock Quote | Chart & Forecast SummaryKey Indicators On Trade Set Up In General
1. Push Set Up
2. Range Set up
3. Break & Retest Set Up
Notes On Session
# Redcentric Stock Quote
- Double Formation
* (A+ Set Up)) - *Short Set Up & Entry | Completed Survey
* (Ascending Structure)) - *A+ | Subdivision 1
- Triple Formation
* (P1)) / (P2)) & (P3)) | Subdivision 2
* (TP1) | Subdivision 3
* Daily Time Frame | Trend Settings Condition
- (Hypothesis On Entry Bias)) | Regular Settings
- Position On A 1.5RR
* Stop Loss At 118.00 GBP
* Entry At 125.00 GBP
* Take Profit At 137.00 GBP
* (Uptrend Argument)) & No Pattern Confirmation
* Ongoing Entry & (Neutral Area))
Active Sessions On Relevant Range & Elemented Probabilities;
European-Session(Upwards) - East Coast-Session(Downwards) - Asian-Session(Ranging)
Conclusion | Trade Plan Execution & Risk Management On Demand;
Overall Consensus | Buy
Fidelity China Stock Quote | Chart & Forecast SummaryKey Indicators On Trade Set Up In General
1. Push Set Up
2. Range Set up
3. Break & Retest Set Up
Notes On Session
# Fidelity China Stock Quote
- Double Formation
* (A+ Set Up)) - *Ranging Period | Completed Survey
* (Neutral Area)) - *A+ | Subdivision 1
- Triple Formation
* (P1)) / (P2)) & (P3)) | Subdivision 2
* (TP1) | Subdivision 3
* Daily Time Frame | Trend Settings Condition
- (Hypothesis On Entry Bias)) | Regular Settings
- Position On A 1.5RR
* Stop Loss At 237.00 GBP
* Entry At 255.00 GBP
* Take Profit At 278.00 GBP
* (Uptrend Argument)) & No Pattern Confirmation
* Ongoing Entry & (Neutral Area))
Active Sessions On Relevant Range & Elemented Probabilities;
European-Session(Upwards) - East Coast-Session(Downwards) - Asian-Session(Ranging)
Conclusion | Trade Plan Execution & Risk Management On Demand;
Overall Consensus | Buy

Hydrogenone Stock Quote | Chart & Forecast SummaryKey Indicators On Trade Set Up In General
1. Push Set Up
2. Range Set up
3. Break & Retest Set Up
Notes On Session
# Hydrogenone Stock Quote
- Double Formation
* (EMA Settings)) - *Upper Band Feature | Completed Survey
* (Downtrend Argument)) / 2nd Trade Set Up | Subdivision 1
- Triple Formation
* (P1)) / (P2)) & (P3)) | Subdivision 2
* (TP1) | Subdivision 3
* Daily Time Frame | Trend Settings Condition
- (Hypothesis On Entry Bias)) | Regular Settings
- Position On A 1.5RR
* Stop Loss At 37.00 GBP
* Entry At 26.00 GBP
* Take Profit At 11.00 GBP
* (Downtrend Argument)) & No Pattern Confirmation
* Ongoing Entry & (Neutral Area))
Active Sessions On Relevant Range & Elemented Probabilities;
European-Session(Upwards) - East Coast-Session(Downwards) - Asian-Session(Ranging)
Conclusion | Trade Plan Execution & Risk Management On Demand;
Overall Consensus | Sell

Games Workshop Stock Quote | Chart & Forecast SummaryKey Indicators On Trade Set Up In General
1. Push Set Up
2. Range Set up
3. Break & Retest Set Up
Notes On Session
# Games Workshop Stock Quote
- Double Formation
* (A+ Set Up)) - *Entry & Long Support | Completed Survey
* (Retest & Entry)) / 2nd Trade Set Up | Subdivision 1
- Triple Formation
* (P1)) / (P2)) & (P3)) | Subdivision 2
* (TP1) | Subdivision 3
* Daily Time Frame | Trend Settings Condition
- (Hypothesis On Entry Bias)) | Indexed To 100
- Position On A 1.5RR
* Stop Loss At 153.00 GBP
* Entry At 162.00 GBP
* Take Profit At 170.00 GBP
* (Uptrend Argument)) & No Pattern Confirmation
* Ongoing Entry & (Neutral Area))
Active Sessions On Relevant Range & Elemented Probabilities;
European-Session(Upwards) - East Coast-Session(Downwards) - Asian-Session(Ranging)
Conclusion | Trade Plan Execution & Risk Management On Demand;
Overall Consensus | Buy
