BEARISH EU - Short Term SellPrice Has Broken Structure To The Downside And Rejected Major Resistance
Price Is Also Trading Below The EMA and Just Rejected It
SEEING IF WE CAN GET A BEARISH PUSH FROM REJECTION OF THE EMA
TP Areas Are Lower Support Levels
#HAPPYTRADING
#PROTECTYOURCAPITAL
Moving Averages

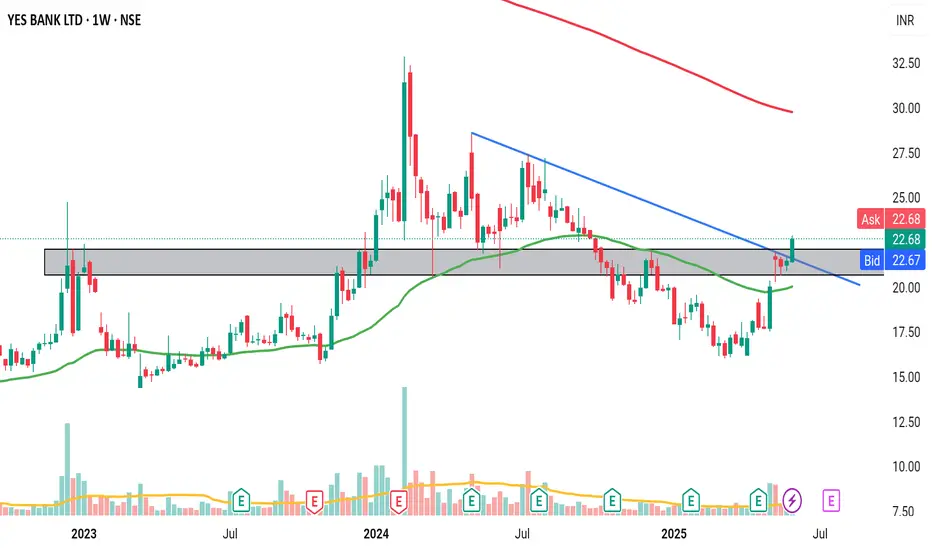
Long termLong term position can be made now as it has crossed 50 EMA with big green candles in weekly TF.
Ethereum Rally (?) : Strong Infusion with Volume RequiredEthereum can make a very strong rally of at least 35-40 percent.
And so the same goes for the Ishares Ethereum Trust ETF. (ETHA ETF)
But it needs to break the pennant.
And we need to observe strong volume.
Also, if we stay above the 50 and 200 period moving averages while this is happening, good things can happen.
Still, I am neutral until we break the pennant.

SBM Offshore Stock Quote | Chart & Forecast SummaryKey Indicators On Trade Set Up In General
1. Push Set Up
2. Range Set up
3. Break & Retest Set Up
Notes On Session
# SBM Offshore Stock Quote
- Double Formation
* (A+ Set Up)) - *Entry & Long Support | Completed Survey
* 150 EMA - *Lower Band Feature | Subdivision 1
- Triple Formation
* (P1)) / (P2)) & (P3)) | Subdivision 2
* (TP1) | Subdivision 3
* Daily Time Frame | Trend Settings Condition
- (Hypothesis On Entry Bias)) | Indexed To 100
- Position On A 1.5RR
* Stop Loss At 157.00 EUR
* Entry At 170.00 EUR
* Take Profit At 186.00 EUR
* (Uptrend Argument)) & No Pattern Confirmation
* Ongoing Entry & (Neutral Area))
Active Sessions On Relevant Range & Elemented Probabilities;
European-Session(Upwards) - East Coast-Session(Downwards) - Asian-Session(Ranging)
Conclusion | Trade Plan Execution & Risk Management On Demand;
Overall Consensus | Buy

ATAI Life Sciences | ATAI | Long at $1.30ATAI Life Sciences NASDAQ:ATAI , a clinical-stage biopharmaceutical company aiming to transform the treatment of mental health disorders, is fast approaching my selected historical simple moving average (SMA). Often, but not always, the closer the price gets to this line, the higher chance there is for a fast upward move. In anticipation of this move, NASDAQ:ATAI is in a personal buy zone at $1.30.
A word of caution: this is a pure technical analysis play and this company is not expected to be profitable for many, many years...
Target #1 = $1.75
Target #2 = $2.50
Target #3 = $2.95

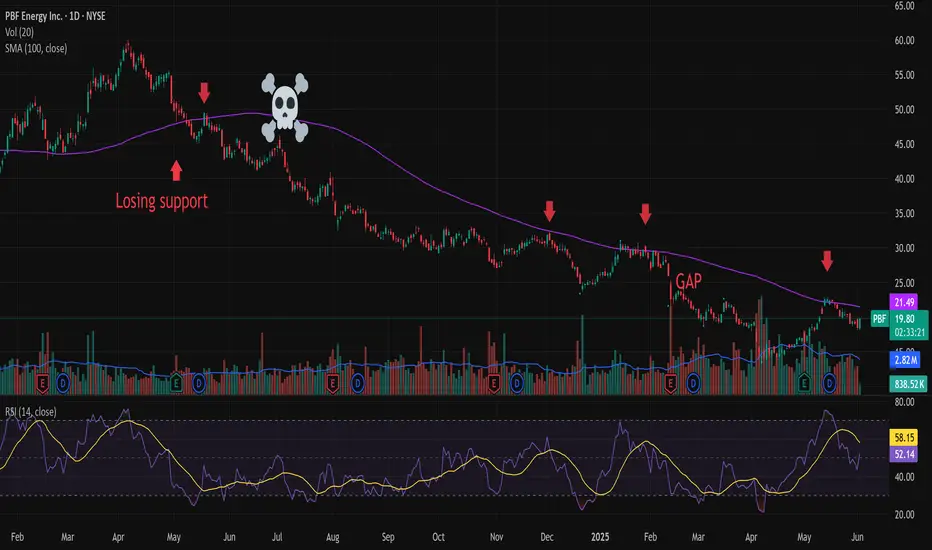
PBF Energy turnaround happening?Fundamentals:
The stock is trading at 0.42x book value, and pays 5.58% dividend. Of course, if profitability deteriorates further, the dividend can be cut and the P/B value can fall lower, but!
PBF is doing a good job on cost cuts, in the last earnings report posted narrower loss than expected
The mexican company 'Control Empresarial de Capital' is continously buying shares of the company, and nor Carlos Slim, neither another insiders-holders selling shares.
Technicals:
The 100 day moving average is the Boogeyman for PBF Energy.
One year ago, early May 2024 the price lost it, and never got back above.
Death cross happened in 2024 July.
Got rejected by the 100MA 4 times, as seen on the picture. The 50day got under the 100, but not worked as support. In 2025 Jan-Feb it tried, but failed.
Is this time different?
A final washout is already happened to $13.45 in April.
In May 2025, the 100MA rejected the price again, but this time the 50MA held as support.
Now the price battles with the 100MA again, break above means a target of $25, as this is an unfilled gap of 2025 February, and the 200 day MA.
Short-term traders can set $25 as target.
Long-term investors can eye $32-36 with proper risk management, or continous buying-selling. Can take a year or two.
GXO to $58 this year?Fundamentals:
-GXO, a 3PL logistics company, a Nike/Apple supplier has more than 1000 warehouses worldwide
-doubled it's revenue in 5 years
-The global commerce is facing difficulties, if we see those get cleared, shipping can be hot for H2 2025
Technicals:
-On buyout news it went to $63, but the plan failed
-In tarrif routs fell to $30,46, all time low
-The April candle is a bullish hammer candle, what putted an end to this decline
-The 50MA was a springboard in 2024 october, before the buyout news, and the lost support when the buyout failed
-In 2025 May, the stock broke above the 50MA
-We have an inverse H&S formation, pointing towards $49, this is an R1 resistance level on the yearly pivot level. $49 we can have in few weeks, then the price will meet a lof of overhead resistance, so it's a good exit point for the short-term.
-At $58 there is an unfilled gap, wich can be filled until the end of the year, or maybe in 2026, on the 2024Q4 earnings release.

Dollar Tree | DLTR | Long at $67.00Dollar Tree NASDAQ:DLTR has taken a massive hit to its stock price as low-income spenders are cutting back (recession red flag, anyone?). It recently touched my selected "crash" simple moving average area (white lines on the chart) and may take many years before true recovery occurs. However, the Director recently bought $150k+ in shares after this recent drop, showing confidence in the company as a whole. I don't think we'll see all-time highs again for some time, but I believe at $67.00 there is a longer-term opportunity into 2026 and beyond. This does not mean I feel the bottom has occurred yet. I wouldn't be surprised if it hits around the $50.00 mark with more bad economic news. No one truly knows. But, I personally choose to position build over time while using charts and fundamental information. At $67.00, NASDAQ:DLTR is in a personal buy zone. If it drops further and fundamentals don't nosedive, more shares will likely be added.
Target #1 = $81.00
Target #2 = $88.00
Target #3 = $94.00

Haleon, Rolling Stock Quote | Chart & Forecast SummaryKey Indicators On Trade Set Up In General
1. Push Set Up
2. Range Set up
3. Break & Retest Set Up
Notes On Session
# Haleon, Rolling Stock Quote
- Double Formation
* (Pennant Structure)) - *Entry & Long Support
# 150 EMA Settings Guide | Completed Survey
* (Neutral Area)) At 420.00 GBP | Subdivision 1
- Triple Formation
* (P1)) / (P2)) & (P3)) | Subdivision 2
* (TP1) | Subdivision 3
* Daily Time Frame | Trend Settings Condition
- (Hypothesis On Entry Bias)) | Regular Settings
- Position On A 1.5RR
* Stop Loss At 390.00 GBP
* Entry At 410.00 GBP
* Take Profit At 440.00 GBP
* (Uptrend Argument)) & Pattern Confirmation
- (Pennant Structure))
* Ongoing Entry & (Neutral Area))
Active Sessions On Relevant Range & Elemented Probabilities;
European-Session(Upwards) - East Coast-Session(Downwards) - Asian-Session(Ranging)
Conclusion | Trade Plan Execution & Risk Management On Demand;
Overall Consensus | Buy

The return of the ICO. AI Style?Virtuals Genesis Launches is one of the most interesting things I have seen in a long time. The Virgen points system is really well done. Allowing projects to both raise the starting capital they want as well as getting a lot of smaller holders that can be early users/promoters. All the attention Virtuals got previously was from the Prototype Agents setup. That setup is honestly kind of garbage. My goal is to farm points and get small exposure to a lot of AI start-up ideas. Many of these will fail but a lot of them are really trying to build something interesting. Unlike IPO's it allows small investors to back projects early. Typically the range seems to be 0.01 to 566 Virtual. That's roughly 2 cents to $1132.
Found support above 34 EMA around $1.80.
MACD is trending down on the daily chart now.
RSI is heading down.
STOCH RSI is also not showing anything bullish currently.
Though I am holding spot Virtuals, there is a lot of evidence to show price could go down here. There is currently not a lot of great news for bulls.
Disclaimer: The information provided in this post is for educational and informational purposes only. It does not constitute financial advice, investment recommendations, or a solicitation to buy or sell any financial instruments. All investments involve risk, and the past performance of a security, market, or trading strategy does not guarantee future results. I am not a financial advisor. Please conduct your own thorough research and consult with a qualified financial professional before making any investment decisions. You are solely responsible for any investment decisions you make.

Cookie the AI alpha seeker.Cookie is a very interesting application. Like Coingecko for AI Crypto projects. I am seeing other platforms build their insights into their websites. A change in regulatory environment has allowed AI projects to come out in a way that has not been seen since ICO era. What has changed is it become viable to publicly fund projects again without fear of regulators. As regulatory bodies in the US like the SEC, seen as hostile to crypto last year are now much more friendly. At #382 on CoinGecko this project is still relatively small. People who want to find and buy AI projects definitely want Cookie as a data source.
The chart is beautiful for Long positions. You have very clean trend of higher highs and higher lows. While riding on the moving averages. I am using 8 SMA, 21 EMA, 34 EMA, 50 SMA, and 200 SMA. With a previous price low around 15 cents, the price needs to remain above that level.
MACD is moving up consistently with the price action. I am not seeing anything concerning here. As I am interested in day and week trends not intraday trades.
With a previous high of 78, there is still a lot of room to work with.
Looks like this could be just the start of this move.
Disclaimer: The information provided in this post is for educational and informational purposes only. It does not constitute financial advice, investment recommendations, or a solicitation to buy or sell any financial instruments. All investments involve risk, and the past performance of a security, market, or trading strategy does not guarantee future results. I am not a financial advisor. Please conduct your own thorough research and consult with a qualified financial professional before making any investment decisions. You are solely responsible for any investment decisions you make.

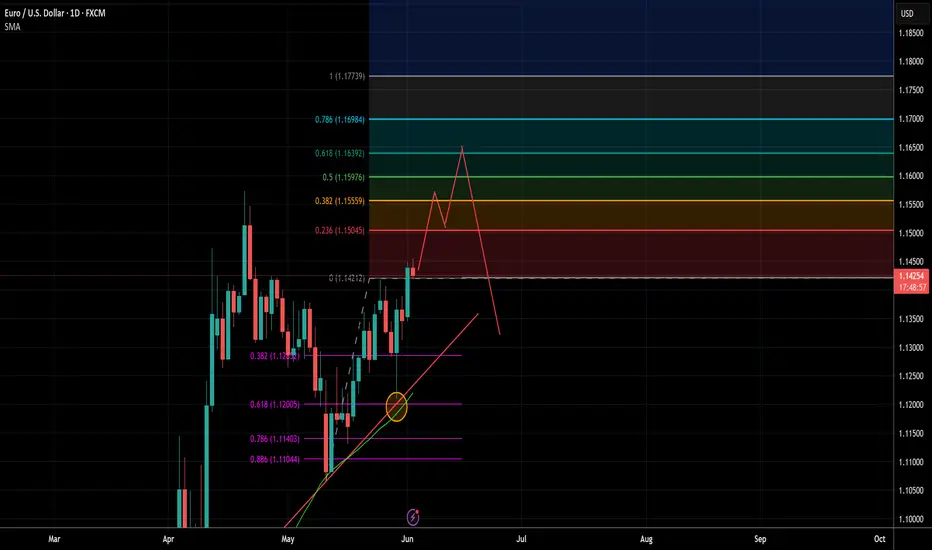
EURUSD - Swing Short Potential OpportunityEURUSD may potentially retest the previous high and trade between fib extension levels 38.2% and then range potentially in that level before pushing higher to the 61.8% extension level retesting and breaking out for a liquidity grab and stop hunt for retails before pushing back down trending back to the mean and retesting previous floor. The 1.1550 & 1.1650 are key historic levels where there has been lots of EURUSD previous action. Expect price to bounce around these areas and trap longs what I think has a high probability of happening per my prediction.
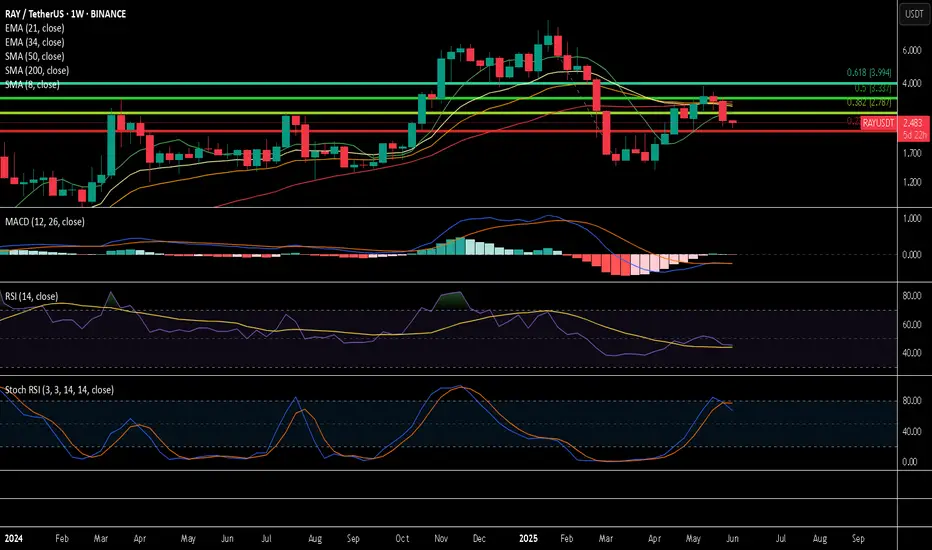
RAY the end or just the start?To first look at Ray we can start with RAYUSDT and move to RAYSOL and RAY BTC.
RAY is not sitting below all of the moving averages. Not an ideal position.
So far MACD cross down does not mean much as the week has not ended yet. Ideally to stay bullish it need to end the week not crossed down.
Stoch RSI cross down
Below 0.015 there is elevated risk that RAYSOL puts in a lower local low.
RAYBTC also not looking great.
With these charts it's pretty hard to make the case why I am long RAY. Let's try some long term fundamentals and see if that is a better picture.
Ray is all about the saying own the shovels. As an exchange the better Solana does the better Ray likely does. It's a widely known DEX it's weaknesses are Solana not getting trade volumes again. Competitors where other DEX are better. Also DEX aggregators have risks the volume does not get sent to Ray.
Disclaimer: The information provided in this post is for educational and informational purposes only. It does not constitute financial advice, investment recommendations, or a solicitation to buy or sell any financial instruments. All investments involve risk, and the past performance of a security, market, or trading strategy does not guarantee future results. I am not a financial advisor. Please conduct your own thorough research and consult with a qualified financial professional before making any investment decisions. You are solely responsible for any investment decisions you make.
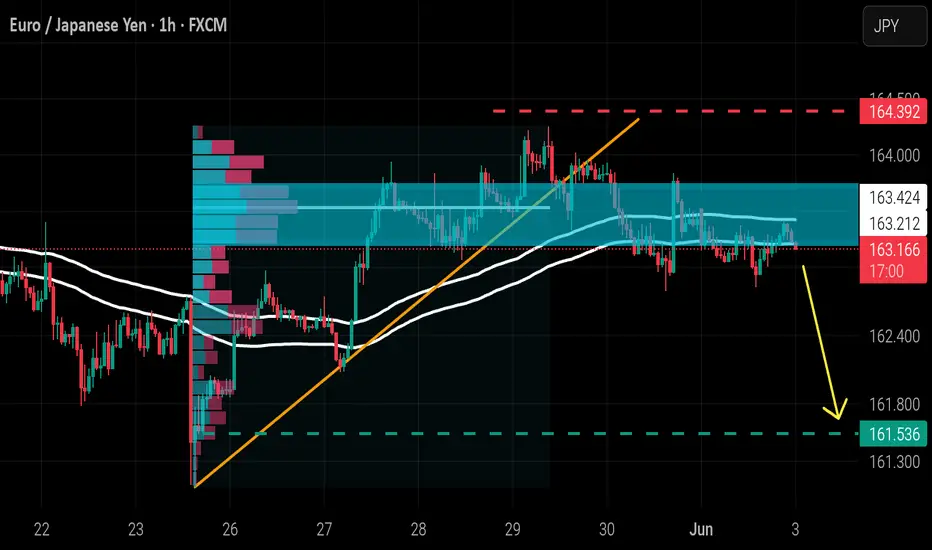
EUR / JPYAfter breaking the uptrend line and moving averages and closing below the volume zone, we will now enter selling.
UNH : Are Bad Days Over ? (Cautious)UNH shares have moved above the 50-period moving average but are trading below the 200-period moving average.
For now, since the 200-period moving average is very high, a small trade can be tried by keeping the stop-loss level a little tight.
A few weak movements may pull the average down and the price may break the average.
Therefore, small position sizes are ideal.
NOTE : If we can maintain persistence on 376(Which will take a few days),
then we will look at the other gaps.
Risk/Reward Ratio : 2.39
Stop-Loss : 274.99
Take- Profit Level : 376.38
Regards.

META : Old Peak can be TestedMeta platform has lost altitude from the channel it has formed since 2023, but has gained momentum and re-entered the channel. The possibility of testing the old peak contains a good RR rate.Of course, with a stop-loss close to the 200-period moving average.( Risk/Reward Ratio : 2.48)
Stop-Loss: 605.47
Target : 740.10

Jack in the Box | JACK | Long at $18.48Jack in the Box NASDAQ:JACK has taken a massive hit to its stock price since its peak in 2024 at just over $124 a share. It's currently trading around $18 and has entered my "crash" simple moving average zone. More often than not, this area signifies a bottom (or future bounce), but I view it more as a consolidation area to accumulate shares. Float = 18M; short interest = 19%...
Looking at NASDAQ:JACK fundamentally, this isn't the healthiest of restaurant companies. It is using a high level of debt to finance its operations and a high dividend yield of 9.28%. The company's revenue and profits have been slowly declining since 2023, as well. However, after 2025, the company anticipates a slow turnaround to begin. It will be closing 80-120 restaurants across the U.S. in 2025, which is a positive to help the company moving forward. NASDAQ:JACK also just got a new CFO and they are (at least from an outsider's view) attempting to change to generate share value. At this share price, I believe the company is in dire straits to get some investor confidence back. It's a strong name with long history.
While the stock price may hit true resistance at just under $17, NASDAQ:JACK is in a personal buy zone at $18.48. Targets are set low due to economic uncertainty.
Targets:
$23.00 (+24.5%)
$25.00 (+35.3%)

Thor Exploration Stock Quote | Chart & Forecast SummaryKey Indicators On Trade Set Up In General
1. Push Set Up
2. Range Set up
3. Break & Retest Set Up
Notes On Session
# Thor Exploration Stock Quote
- Double Formation
* (P1)) - Long Support & Inverted Structure | Completed Survey
* (Box Thinking Bias)) On 0.5 Retracement Area
# Support & Resistance + Break Out | Subdivision 1
- Triple Formation
* (P1)) / (P2)) & (P3)) | Subdivision 2
* (TP1) | Subdivision 3
* Daily Time Frame | Trend Settings Condition
- (Hypothesis On Entry Bias)) | Regular Settings
- Position On A 1.5RR
* Stop Loss At 34.00 GBP
* Entry At 37.00 GBP
* Take Profit At 43.00 GBP
* (Uptrend Argument)) & No Pattern Confirmation
* Ongoing Entry & (Neutral Area))
Active Sessions On Relevant Range & Elemented Probabilities;
European-Session(Upwards) - East Coast-Session(Downwards) - Asian-Session(Ranging)
Conclusion | Trade Plan Execution & Risk Management On Demand;
Overall Consensus | Buy

Monero: The Hidden Signal of AltseasonMonero: The Hidden Signal of Altseason — A Fractal Reversal Confirmed Across Markets and Timeframes
While the market is still chasing noise from meme tokens and hype narratives, Monero (XMR) is silently building one of the cleanest structural setups I’ve seen this year. And it’s not just happening on one chart — this setup is being confirmed across multiple timeframes, pairs, and fractal levels.
1. XMRBTC (Weekly): The Foundation Is Set
On the weekly chart of XMRBTC, a classic double bottom has already formed. The neckline — aligned precisely with the 100-period moving average (MA100) — has been broken and successfully retested. This kind of structure, especially on a long-term timeframe, often marks the initiation phase of a new market cycle.
This is exactly the type of pattern I focus on in my proprietary approach: Fractal Reversal Law (FRL). The essence of FRL is that every market phase ends with a reversal pattern, where the neckline is flat and usually anchored to the origin of the last impulse — often near MA100. This pattern here is textbook.
2. XMRBTC (H1): A Smaller Echo of the Same Structure
Zooming in, we see an almost identical reversal structure forming on the H1 chart of XMRBTC. A minor correction inside a broader uptrend created another double bottom. The neckline? Again — MA100.
This structure mirrors the weekly pattern, just at a smaller scale — a direct confirmation of the fractal nature of reversals, a core component of FRL.
The significance here is not only in the pattern itself but in where it appears: right at the retest zone of the weekly breakout.
3. XMRUSD: Fibonacci Precision Meets Structural Logic
In the XMRUSD pair, we see further confirmation:
• Price made a strong upward impulse
• A correction followed, landing precisely at the 61.8% Fibonacci retracement
• A reversal formation is now visible on H1
• Neckline again aligns with MA100
• A bullish MACD divergence confirms momentum shift
This reinforces that the reversal we’re observing is not isolated. It’s happening across both BTC and USD pairs — a rare form of intermarket confirmation.
4. Reversal Against BTC = Signal and Context
From a broader view, a structural reversal against BTC is never a coincidence. It often signals more than just technical bounce — it suggests that:
• The alt is starting to outperform Bitcoin
• The background trend in BTC is supportive, not restrictive
It’s difficult to imagine a double bottom structure against BTC completing successfully during a strongly bearish phase in Bitcoin.
So, the pattern itself implies the context — that BTC is either stable or trending upward.
In this case, we’re not just spotting a reversal — we’re identifying the start of a sector rotation.
5. Fundamentals Matter — and Monero Delivers
While the structure is strong, Monero also holds weight fundamentally:
• It’s the most established and respected privacy coin, with real cryptographic innovation (ring signatures, stealth addresses, bulletproofs)
• It has resistance to ASIC centralization, fair emission, and a loyal dev community
• In an age of increasing regulation and surveillance, privacy coins may regain strategic importance
It’s not driven by hype, and that’s exactly why it might lead the next structural altseason.
Conclusion: Structure Is the Signal
What we’re seeing here is more than a pattern — it’s a fractal, multi-asset confirmation across timeframes.
• Weekly double bottom on XMRBTC
• Intraday reversal at the retest zone
• Fibonacci-aligned reversal with MACD divergence on XMRUSD
• MA100 acting as a dynamic neckline across all timeframes
Fibonacci Targets: Where Can Monero Go from Here?
If this setup plays out as expected, price targets can be projected using Fibonacci extension levels from the latest bullish impulse on the XMRBTC chart. The key levels are:
• 0.005 BTC — initial target based on the 1.618.
• 0.0077 BTC — corresponds to the 2.618.
• 0.010 BTC — round psychological level and the 3.618 .
These levels are not just mathematical — they also align with historical liquidity zones and may act as key take-profit areas during the next wave of the trend.
Each target should be monitored in the context of Bitcoin’s overall market behavior. But if the current FRL structure truly marks the end of an accumulation phase, Monero has room to move significantly higher.
This is a textbook FRL alignment, and one of the strongest multi-dimensional setups I’ve seen recently.

TJX: Sudden Drop After EarningsTJX fell sharply after its latest earnings report, and some traders may see more downside risk.
The first pattern on today’s chart is the drop on May 21 after backward-looking results beat estimates, but forward-looking guidance disappointed. Also notice the action on February 26, when an initial pop faded. Those reactions contrast with many post-earnings rallies in recent years, and may reflect weakening fundamentals.
Second, the discount retailer gapped down to its 50-day simple moving average. Instead of bouncing, it has consolidated at the line. Could a breakdown follow?
Third, the 8-day exponential moving average (EMA) has crossed below the 21-day EMA and remained there. That may reflect bearish short-term momentum.
Finally, chart watchers may view the October 7 close around $112 as the clearest support. TJX is about $14 above that level. Given the potential challenges cited above, buyers may wait for a test of those lower levels.
Check out TradingView's The Leap competition sponsored by TradeStation.
TradeStation has, for decades, advanced the trading industry, providing access to stocks, options and futures. If you're born to trade, we could be for you. See our Overview for more.
Past performance, whether actual or indicated by historical tests of strategies, is no guarantee of future performance or success. There is a possibility that you may sustain a loss equal to or greater than your entire investment regardless of which asset class you trade (equities, options or futures); therefore, you should not invest or risk money that you cannot afford to lose. Online trading is not suitable for all investors. View the document titled Characteristics and Risks of Standardized Options at www.TradeStation.com . Before trading any asset class, customers must read the relevant risk disclosure statements on www.TradeStation.com . System access and trade placement and execution may be delayed or fail due to market volatility and volume, quote delays, system and software errors, Internet traffic, outages and other factors.
Securities and futures trading is offered to self-directed customers by TradeStation Securities, Inc., a broker-dealer registered with the Securities and Exchange Commission and a futures commission merchant licensed with the Commodity Futures Trading Commission). TradeStation Securities is a member of the Financial Industry Regulatory Authority, the National Futures Association, and a number of exchanges.
TradeStation Securities, Inc. and TradeStation Technologies, Inc. are each wholly owned subsidiaries of TradeStation Group, Inc., both operating, and providing products and services, under the TradeStation brand and trademark. When applying for, or purchasing, accounts, subscriptions, products and services, it is important that you know which company you will be dealing with. Visit www.TradeStation.com for further important information explaining what this means.

Bitcoin on JUNE's Pivot, $103kI believe $103,300 ( June's Pivot ) will hold bitcoin, and in few days we see a rally to the upside, and by the end of June, Bitcoin will reach to $121,700 which is the 2nd resistance for the pivot.

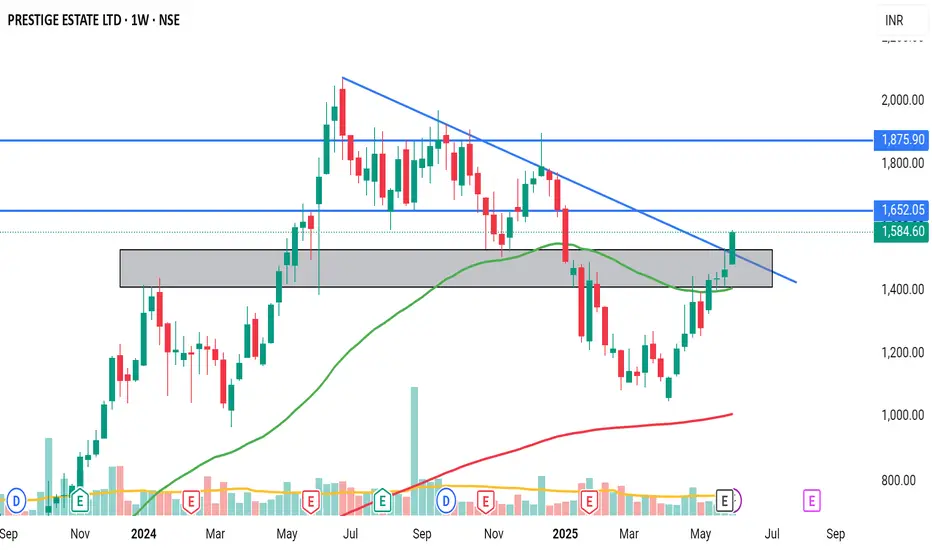
Low Risk High Reward TradeNoticable trend reversal with incoming fresh volume. Crossed 50EMA with big greens, also surpassed crucial supply zone.
$UNI - $10 from here?Hi guys! 👋🏻
🔔I'll be trying this setup for Uniswap
🔔 We have bounced from the strong support at $4.80, which we retested in April 25 and May 7 forming a pattern impersonating a double bottom
🔔 With the current chart pattern and levels, I'll be expecting a jump with a target on $10.
🔔 Might drop to $5.70 before another move upwards.
✊🏻 Good luck with your trades! ✊🏻
If you like the idea hit the 👍🏻 button, follow me for more ideas.
