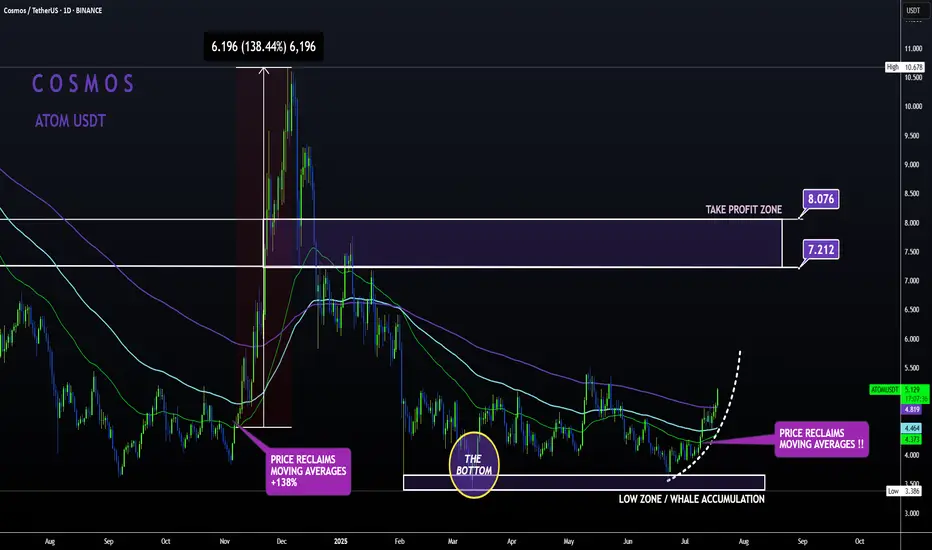
ATOM Sleeping GIANT ALT | Moving Averages BULLISH like NOV24'ATOM is slowly but surely making a turn up towards the first Take Profit point.
From the bottom, Cosmos has already increased a whopping 52% , with even more room to grow:
In my previous update, the 4 was still bearish when looking at trend lines and moving averages.
However, this has flipped to bullish from the 4h upward, with the price trading high above the moving averages in the 4h and in the daily timeframe:
4H:
Daily:
Note how previously, the big increases started as soon as the price regained the moving averages as support.
Movingaveragecrossover
Bitcoin MA 50 crosses 100If history repeats, this could be even bigger gains soon ahead. The blue MA 50 just crossed the orange MA 100 which happened in Oct '24 as well as Oct '23 -- this time happening so soon could defy historical pattern, but with a possible Fed interest rate cut in the works, this could be huge.
After the recent Fed announcement that there would be no interest rate cuts at this time, the reason given was that the market was holding steady, though a recession was not entirely ruled out. If a recession starts to rear its ugly head before June 17th Fed meeting, they may change their outlook and enact interest rate cuts to ensure the economy can continue unscathed. Since Trump has walked back tariffs on China and is still working with the rest of the world to lower tariffs, the interest rates may not be cut in June.
What does this mean for Bitcoin?
A recession is still on the horizon, even without rate cuts and with lowered tariffs. The damage has already been done by tariffs, enough so that reports of impending empty shelves soon to hit stores this month is still a concern. People flock to other investment strategies when the market is so uncertain, hence Gold and Bitcoin getting their boosts recently.
It's my opinion that Bitcoin will continue to grow in price as investors scramble to keep their portfolios on an uptrend. The MA 50 and MA 100 crossing is a great signal and gives me confidence in a continuing uptrend.

BTCUSDT: Signals a 2-Week Retest—Trend Still Alive
BTC’s been wild, but zoom out to the 2-week chart— we’ve got a solid uptrend with higher highs and lows. Last week’s dip isn’t a reversal—it’s a retest of the 50-day EMA (around $64.8k as of March 10, 2025). Volume’s thinning, RSI’s looks oversold. Indicators flashed a ‘hold’ here—no sell signal yet, which tells me the trend’s got legs or at least a bounce.
Bullish Case : If BTC holds the retested level (e.g., a prior resistance-turned-support), it could resume upward momentum. A two-week stabilization suggests accumulation, and a break above the recent high could target the next psychological level (e.g., $90,000).
Bearish Risk : If the retest fails—price breaks below the key level with high volume—it could signal a deeper correction, potentially revisiting lower supports (e.g., $70,000 or $60,000). A two-week trend turning into a failed retest might indicate profit-taking or macroeconomic pressure with all the news.
It's worth just taking a zoomed out look, no panic just yet and let it play out a little more.

The algos have awoken. $NIO Short term squeeze?As soon as the Weinstein 30-week indicator trended up on the 1-minute chart (first time since the start of January), price rallied by 1% and heavy call buying pushed the options premium to the bullish territory.
As a result, the indicator is trending up on the 30-minute chart for the first time since last November. I think that a squeeze is highly likely to occur over the next few days.

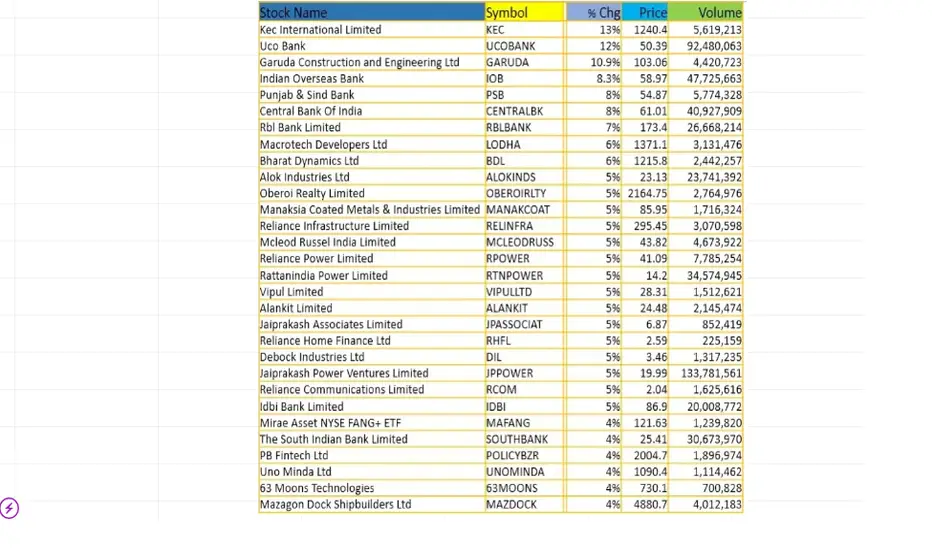
Best Intraday stocks technical & fundamental analysis| 3-jan2025Technical Analysis stocks (3-jan-2025)
follow us for more updates and information
message us for any stocks entry & exit and targets and related information.

Best Intraday stocks technical & fundamental analysis| 31Dec2024Technical Analysis of Moving average stocks (31/Dec/2024)
follow us for more updates and information
message us for any stocks entry & exit and targets and related information.

Best Intraday stocks fundamental-technical analysis |30 Dec 2024Fundamental Technical Analysis of Moving average stocks (30/Dec/2024)
follow us for more updates and information
message us for any stocks related information

Best Intraday stocks technical analysis | 27 Dec 2024Technical Analysis of Moving average stocks (20/Dec/2024)
follow us for more updates and information
message us for any stocks related information.

$SOL Short-Term Pain Ahead CRYPTOCAP:SOL price broke to the downside of the 50D SMA
Bearish Crossing from the 20D MA ahead.
Needs to hold critical support at $190 / .786 Fib
Another bearish day could dump CRYPTOCAP:SOL to $175 / .618 , and if that doesn’t hold the move should finish at $165 / 50% level.
RSI shows more downside for confluence.

Best Intraday stocks technical analysis | 19th Dec 2024Technical Analysis of Moving average stocks (19/Dec/2024)
follow us for more updates and information
message us for any stocks related information.

Best Intraday stocks technical analysis | 18th Dec 2024Technical Analysis of Moving average stocks (18/Dec/2024)
follow us for more updates and information
message us for any stocks related information.

Best Intraday stocks technical analysis | 17th Dec 2024Technical Analysis of Moving average stocks (16/Dec/2024)
follow us for more updates and information
message us for any stocks related information.

Best Intraday stocks technical analysis | 16th Dec 2024Technical Analysis of Moving average stocks (16/Dec/2024)
follow us for more updates and information
message us for any stocks related information.

Best Intraday stocks technical analysis | 12th Dec 2024Technical Analysis of Moving average stocks (12/Dec/2024)
follow us for more updates and information
message us for any stocks related information.

Intraday stocks for today (11/Dec/2024)Technical Analysis of Moving average stocks (11/Dec/2024)
follow us for more updates and information

Intraday stocks for trading (09/Dec/2024)Technical Analysis of Moving average stocks (09/Dec/2024)
follow for more updates and information

Intraday top stocks for trading (06/Dec/2024)Technical Analysis of Moving average stocks (06/Dec/2024)
follow for more updates and information

Intraday moving average stocks for (05/Dec/2024)Technical Analysis of Moving average stocks (05/Dec/2024)
follow for more updates and information
Intraday moving average stocks for (04/Dec/2024)Technical Analysis of Moving average stocks (04/Dec/2024)
follow for more updates and information

Intraday moving average stocks for (03/Dec/2024)Technical Analysis of Moving average stocks (03/Dec/2024)
follow for more updates and information

Analysis of Moving average stock (25/Nov/2024) Analysis of Moving average stock (25/Nov/2024)
follow for more updates and information

Analysis of Moving average stock (25/Nov/2024)Analysis of Moving average stock (25/Nov/2024)
follow for more updates and information

Moving Average Positions (50,100,200)Normally when bear moves arise the 50 and 100 are above the 200 as there is more room for a downward move than an upward one.
Right now the 50 and 100 are BELOW the 200, which suggests that they have more room to move up ABOVE the 200MA in red, which would happen during a bull move.
Observation of the MA's
Comment if you think otherwise !
Daily timeframe
