NEAR’s Pullback Zone Found — Is $4 Next?NEAR just pulled off a +50% rally from the 0.618 Fibonacci retracement at $2.224 — a strong show of force from the bulls. After that explosive move, price is now cooling off in a consolidation phase, preparing for the next leg higher.
🟢 Long Setup — Dip Before Lift?
The next high-probability long zone lies between:
$3.026 – $2.94
Possible but less likely of a deeper dip to $2.78 (0.5 Fib of the recent move)
Long entries can be laddered between $3.00 and $2.90 (even $2.80 if volatility kicks in).
Stop-Loss: Below the daily 21 EMA ($2.7344) and 21 SMA ($2.6739)
Target: $4.00
R:R: ~4:1 — clean and structured
This setup aligns with standard continuation behaviour after strong impulses — consolidation, retrace, and resume.
🔴 Short Setup (on Rejection at $4.00)
Entry: ~$4.00
Stop-Loss: Above $4.25
Target: Yearly open (~$3.65)
R:R: ~1.5:1 — not ideal, but valid on confirmation
🎯 Summary
NEAR is consolidating after a strong move — either ready to continue higher or retest deeper into Fib support
Long zone: $3.00–$2.90 (poss. $2.80)
Short zone: $4.00 (on rejection only)
Simple structure, clean risk, and nothing forced — exactly how it should be.
Sometimes, less is more. Let price show the next move. Stay ready. 📈
___________________________________
If you found this helpful, leave a like and comment below! Got requests for the next technical analysis? Let me know.
Movingaveragestrategy

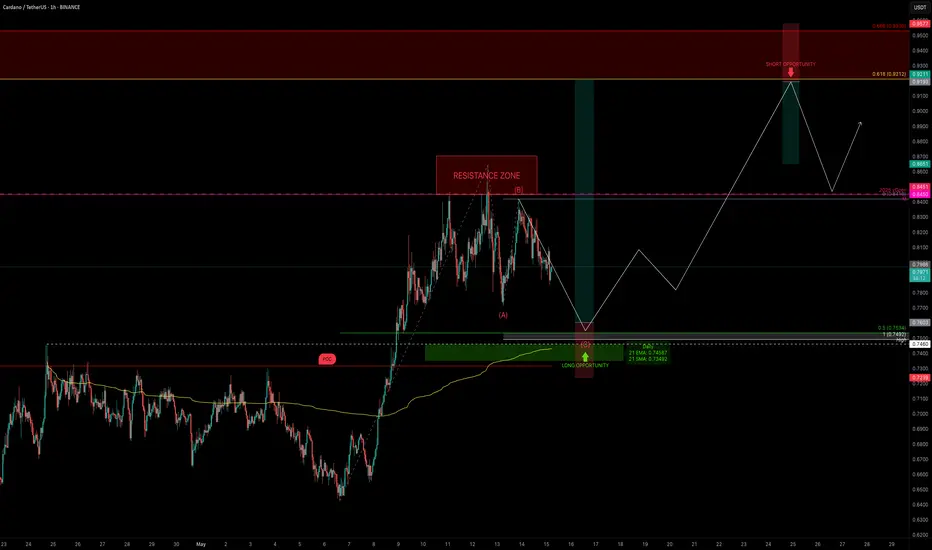
ADA Correction Nearing Completion — Trade It Like a ProADA is respecting structure beautifully and currently consolidating after completing a 5-wave impulse move. The key question now is: where are the next high-probability trade setups?
Let’s break it down step by step.
Market Structure & Elliott Context
ADA has completed a full 5-wave bullish sequence, and—as expected—is now in a correction phase. This appears to be forming a classic ABC correction.
Using the Fibonacci retracement tool:
0.5 retracement of the entire move sits at → $0.7534
This aligns perfectly with the previous swing high at $0.746 — a level that has yet to be retested
The 1:1 trend-based Fib extension of a potential ABC correction puts Wave C at → $0.7492
Confluence Check:
This entire support zone (~$0.75) is stacked with technical alignment:
✅ Previous swing high: $0.746
✅ 0.5 Fib retracement: $0.7534
✅ 1:1 extension: $0.7492
✅ Daily 21 EMA: $0.7455
✅ Daily 21 SMA: $0.7347
✅ Point of Control (POC): ~$0.7318
✅ Anchored VWAP: Also sitting in this zone
✅ Pitchfork golden pocket: Aligns as dynamic support
All of these support indicators point to one thing: this ~$0.75 zone is a high-probability long entry area.
🟢 Long Setup
Entry zone: Ladder between $0.77 – $0.75
Average entry: ~$0.76
Stop-loss: Below $0.7318 (under POC)
Target: $0.9212 (0.618 retracement of the recent down wave)
R:R: ~5:1
Potential upside: +22%
🔴 Short Setup (on Rejection Only)
Entry: $0.9212 (0.618 Fib retracement of downtrend)
Stop-loss: Above 0.666 Fib → ~$0.958
Target: previous swing high or yearly open
R:R: ~1.4:1 (it can be adjusted tighter upon confirmation)
This short setup isn’t ideal in terms of R:R unless we see clear rejection. But with confirmation — like an SFP, bearish engulfing, or divergence — the stop can be tightened, making the risk-to-reward much more favourable.
📘 Educational Insight: Why Structure Beats Emotion
In trading, the strongest setups occur where multiple tools converge—Fib levels, EMAs, VWAP, volume zones, and past price action. When these align, it’s not about guessing—it’s about preparing.
The key is to wait for structure to come to you, not the other way around. Patience allows clarity. Clarity allows precision. And precision pays.
💡 Final Thoughts
The plan is clear. Levels are set. Now it’s just observation and discipline.
Good trades don’t chase attention — they present themselves to those who wait.
___________________________________
If you found this helpful, leave a like and comment below! Got requests for the next technical analysis? Let me know.
XRP Correction Complete? — Long Setup Aligned with Fib & OBXRP has completed a 5-wave impulse move. As expected, XRP is now in a corrective phase, pulling back after rejecting from a key resistance — and it’s doing so with technical precision.
The question now: where is the next high-probability long setup? Let’s break it down.
🧠 Market Structure & Key Zones
Using Fibonacci retracement from the base of the 5-wave impulse, we now have a potential golden pocket target aligned with major confluence.
🔽 Support Zone
🔹 0.618 Fib retracement: $2.2982
🔹 Daily Bullish Order Block: $2.2949
🔹 Daily 21 EMA: $2.329
🔹 Daily 21 SMA: $2.301
🔹 Liquidity pool
🔹 0.786 Fib Speed Fan (only if price drops between May 17–18)
This creates a high-confluence support cluster at ~$2.3 — a prime candidate for a long re-entry.
🟢 Long Trade Setup
Entry: Ladder between $2.32 and $2.28
Stop-loss: ~$2.21
Target: $2.7175 (0.618 Fib retracement of the corrective downtrend)
R:R: ~5:1
🔴 Short Setup (Conditional)
Trigger: Rejection at $2.7175
Entry: ~$2.7175
Stop-loss: Above $2.8033 (0.666 Fib) → set at ~$2.811
Take Profit: ~$2.56 or lower
R:R: ~2:1+ (dependent on entry confirmation and PA behaviour)
Shorts only valid if a clear rejection or SFP pattern emerges. If momentum is strong, this level may break — so wait for structure to confirm.
📘 Educational Insight: Why Confluence Matters
Too often, traders chase single-indicator signals. But real edge comes from confluence — when multiple tools (Fibs, MAs, Order Blocks, Liquidity, VWAPs, FVG, Speed Fans etc.) agree on the same zone. This alignment not only increases confidence in your entry, but also sharpens your risk management.
Think of it as building a case — the more aligned evidence you have, the stronger your trade thesis becomes.
📌 Summary
XRP is in a corrective phase after a 5-wave impulse
Clean rejection from weekly resistance → continuation of bearish trend
Long zone: ~$2.3
SL: ~$2.21 | TP: $2.7175 | R:R ~5:1
Optional short: $2.7175 rejection → SL $2.811 | TP $2.56
Precision isn’t about predicting — it’s about being ready when the chart speaks with clarity. Patience makes probability powerful.
___________________________________
If you found this helpful, leave a like and comment below! Got requests for the next technical analysis? Let me know.

VIRTUAL TA Masterclass — Elliott Wave Meets Gartley HarmonicVIRTUAL has been on fire! Printing a clean 5-wave Elliott impulse with a +431% run in just 33 days. But after every strong trend comes a healthy correction, and that’s where we likely are now. Trading below key resistance and showing signs of exhaustion. The question: Where is the next high probability trade setup?
Let’s break down what the chart is telling us.
🧠 Structure Overview
Wave 5 peaked at $2.2169
Wave A dropped -25%
Wave B bounced +30%
Currently: VIRTUAL's trading under the $2 psychological level and weekly open ($2.0358) → signs of momentum cooling
A corrective Wave C is likely underway, and all signs point toward a very specific zone.
⚠️ Liquidity Dynamics
The longer VIRTUAL grinds sideways near $2.00 without showing real momentum, the more vulnerable late long positions become:
Retail traders are buying resistance
SLs are likely clustered just below Wave A’s low
This creates a liquidity pocket waiting to be swept — perfect fuel for Wave C
🔍 The $1.58–$1.47 Support Cluster: 14 Layers of Confluence
This zone isn’t guesswork — it’s loaded with technical overlap:
1️⃣ 1:1 Trend-Based Fib Extension of Wave A → $1.573
2️⃣ Monthly Open → $1.5354
3️⃣ 0.382 Fib Retracement of the entire rally → $1.5295
4️⃣ Bullish Fair Value Gap → $1.57–$1.53
5️⃣ Anchored VWAP from ATH → ~$1.46
6️⃣ Anchored VWAP from Wave 3 → ~$1.46
7️⃣ 0.618 Fib Speed Fan Support (~end of May timing)
8️⃣ 4H 233 SMA → ~$1.52
9️⃣ 4H 200 EMA → ~$1.52
🔟 Daily 200 SMA → $1.5251
1️⃣1️⃣ Weekly 21 SMA → $1.462 (reinforces the VWAP zone)
1️⃣2️⃣ Declining Daily Volume → momentum weakening
1️⃣3️⃣ Liquidity Pool below Wave A → likely to be swept
1️⃣4️⃣ $2 = Golden Pocket Resistance + Psychological Barrier
🔴 Short Trade Setup (Active as Long as SFP Holds)
For those favouring downside continuation toward the Wave C target, a short setup is in play:
Entry: Weekly open retest around $2.0358
Stop-loss: Above SFP high at $2.143
Target: 1:1 Trend-Based Fib Extension of Wave A → $1.573 or the Swing Low of Wave A at $1.647
R:R ≈ 1:4 — a solid, well-structured short opportunity
As long as price remains below the SFP and the $2.00 golden pocket resistance, bears maintain control.
🟢 Long Trade Setup
Entry: Ladder between $1.58–$1.47
Avg. Entry: ~$1.53
SL: Below $1.40
TP1: $1.88 (local resistance) → R:R ≈ 1:2.5
TP2: $3.33 (0.618 Fib of entire bear market) → R:R ≈ 1:12
👉 Bonus TP for Harmonic Setup: 0.618 Fib of CD leg
✨ Bonus Confluence: Potential bullish Gartley Harmonic in Play
VIRTUAL is also forming a valid Gartley harmonic pattern — one of the most reliable reversal setups in classical trading theory.
🔸 XA: B retraced to 0.602 → ✅ (criterion: ~0.618)
🔸 AB: C retraced 0.87 → ✅ (valid range: 0.382–0.886)
🔸 CD: Projected to complete at 0.786 of XA → ~$1.474
• CD is a 1.356 expansion of BC
• AB ≈ CD symmetry is valid
• TP = 0.618 retracement of CD leg
This adds even more weight to the $1.47–$1.53 buy zone.
📘 Educational Takeaway
The best setups don’t rely on one method — they align multiple disciplines. Here, we have Elliott Waves, Fibonacci retracements, anchored VWAPs, volume structure, moving averages, time symmetry, and now a harmonic pattern — all pointing to the same opportunity. Most traders never wait for alignment. That’s why most lose.
💬 Final Words
✍️ Smart trading isn’t about always being in a trade — it’s about being in the right one at the right time.
While others FOMO at $2, you wait for the right opportunity to come to you — where structure, liquidity, and probability all shake hands.
The patient are rewarded. Always.
___________________________________
If you found this helpful, leave a like and comment below! Got requests for the next technical analysis? Let me know.

$NAS100 / $QQQ – The 200 SMA Breakout... or Bull Trap?📈 Nasdaq just charged through the 200-day moving average like it wasn’t even there. But if you zoom out, this level has acted as a brick wall before — and we may be walking straight into a trap.
🔍 Key Observations:
The last failed breakout above this zone led to a major rejection.
We're back at horizontal resistance from prior tops.
Price action resembles a Rope-a-dope move — run up, suck in longs, then rug pull.
⚠️ No real breakout without confirmation + volume. Don’t let the short-term green candles distract you from the macro ceiling above.

THETA at Rock Bottom? The Bounce Could Be LegendaryFor the past 136 days, THETA has been in a strong downtrend, shedding an incredible -82% from its high at $3.351. Recently, it tapped into a major support level at $0.617, interesting that it's like the golden ratio 0.618. And it bounced off it beautifully. Over the last few days, we’ve seen a notable surge in volume, hinting at potential accumulation. Could this be one of the best times to scale in? It might just be. An 82% discount is no joke.
🔑 Key Levels to Watch
The $1 level is the key psychological and technical resistance everyone’s eyeing. Longing from current levels to $1 offers a solid +40% gain, not bad at all. But let’s zoom out and get the bigger picture with some Fibonacci levels.
Using Fib retracement on the full 136-day move down:
0.236 Fib = $1.252 → Approx. +75% from current price
0.382 Fib = $1.653 → Roughly +135% gain
These are solid mid- to long-term upside targets if bullish momentum builds.
📈 Trade Setup & R:R
Invalidation: Current low at $0.600
Monthly Open: $0.804. Reclaiming and flipping this level into support would be a bullish sign.
Current Resistance: Around $0.71, where the anchored VWAP (yellow line) aligns with a yearly level. This needs to be broken and ideally retested as support.
We might also be seeing the early formation of an inverse head and shoulders pattern. While the “head” is still developing, if this setup plays out, the target sits at $1.5.
And here’s the kicker:
That $1.5 region lines up with multiple higher timeframe moving averages, adding significant weight to the level:
Monthly 21 EMA: $1.52
Monthly 21 SMA: $1.47
Weekly 21 SMA: $1.514
This confluence makes $1.47–$1.52 a major magnet for price and a likely take-profit or reaction zone if momentum continues.
👉 Feel free to use this indicator—just head over to my profile and under the Scripts section, add it to your favorites. Enjoy.
🎯 Risk to Reward Potential
These setups have excellent R:R potentials, ranging from 3:1 to over 60:1, depending on entry, stop-loss placement, and target selection. These are the kinds of high-probability setups that traders dream of. Clean structure, strong support, major upside, and clear invalidation.
If we see a breakout above $1 with strong volume, it could act as a catalyst for an even faster move toward higher Fib levels and MA targets.
Didn’t want to go too deep, but this lays out a clear roadmap with levels to monitor and possibilities to consider. The rest depends on how new data unfolds in the coming weeks. As always... plan your trade, manage your risk, and let the market come to you. Keep monitoring volume, structure, and key levels. The opportunities are here, now it's about execution.
____________________________________
If you found this helpful, leave a like and comment below! Got requests for the next technical analysis? Let me know.

Approaching the 200-Week SMA – AgainHistory doesn’t repeat… but it sure does rhyme.
If all you did was buy the S&P 500 every time it touched the 200-week moving average, you would’ve: ✔️ Bought 2011, 2016, 2018, 2020, 2022… 💰 Absolutely cleaned house.
Now in 2025, we’re approaching the same level again. That SMA has acted like a trampoline for the last 15 years — will it bounce once more?
🧠 Food for thought as fear builds and the market cools.
Let’s see if the buyers step in where they always have. 👀

$RKLB preparing for takeoff? 3...2...1... NASDAQ:RKLB : Good support in the $15 area, good volume in that buy zone and floating above it's 200EMA/SMA, 50EMA/SMA and a nice weekly candle. Targets: $21.80, $22.50 and mega momentum towards $25.
WSL.

ADA - Next Trade Setups to WatchADA’s been stuck in this sideways grind for a while, and the volume’s basically ghosting us. So, where’s it at, and where’s the next move? Let’s dig in.
ADA’s sitting at $0.6615 right now, trading below the yearly open at $0.8451 and the range’s sweet spot, the POC, at $0.7325. That tells me it’s leaning a bit bearish, but not exactly screaming panic, more like it’s just chilling in this 57 day range. It tapped the monthly open at $0.6328 recently, bounced a little, but without volume showing up, it’s like nobody’s ready to commit yet.
Key Levels
Resistance Zones (Short Opportunities)
1.) Range POC: $0.7325, this is the most traded price within the 57 day range, acting as a magnet for price. A rejection here could signal a short setup.
2.) Yearly Open ($0.8451): a psychological and structural level that could cap upside if momentum remains weak. Trading below this level keeps the yearly bias bearish. A break above with volume would flip the narrative.
Support Zones (Long Opportunities)
1.) Monthly Open: $0.6328, already saw a little bounce here with that swing failure move, perfect setup for a long trade if you were quick on the draw.
2.) Yearly Open 2024 + 21 Monthly EMA: $0.594 - $0.5928, strong confluence with the prior yearly open and a key moving average. This zone aligns closely with the swing low at $0.5801, forming a robust support cluster between $0.5801 - $0.594.
3.) 21 SMA: $0.53, a deeper support level if the above zone fails. This would indicate a more significant breakdown, but it’s a potential accumulation area for longer-term traders.
Market Structure Analysis
Bearish Bias Above Swing Low: Trading below the yearly open and POC suggests sellers are in control unless price reclaims $0.7325 with conviction.
Range-Bound Behaviour: The 57 day range indicates consolidation. Volume is the missing catalyst, watch for a spike to confirm direction.
Swing Low as Key Pivot: The $0.5801 level is critical. A hold here maintains the range; a break below shifts focus to $0.53 and signals capitulation.
High-Probability Trade Setups
Long Setups
1.) Long Setup #1 at Swing Low ($0.5801 - $0.594 Zone)
Entry Trigger: Look for a swing failure pattern (SFP) where price dips below $0.5801, reclaims it, and shows rejection of lower prices (e.g., a bullish candle with a wick below).
Stop Loss (SL): Place just below the swing low
Take Profit (TP): $0.70 (near-term resistance)
Stretch Target: $0.8451 (yearly open), though this requires stronger momentum.
Confirmation: Higher-than-average volume on the reclaim + bullish price action (e.g., engulfing candle).
2.) Long Setup #2: $0.4735 Sniper Entry
Entry Trigger: If ADA takes a bigger tumble, $0.4735 is your sniper’s nest, think of it as catching the knife with style. Could be a wick that snaps back.
This is a deeper, high-reward play. Price has to fall by a lot from here, but if it hits, the R:R is amazing, and it’s below most traders radar. Patience is the name of the game.
Short Setup
At POC ($0.7325) or Yearly Open ($0.8451)
Strategic Outlook
Current Stance: If not in a trade, the $0.5801 level is the highest-probability long setup due to confluence and R:R. The SFP at $0.6328 today was a missed opportunity, but a deeper pullback sets up an even better entry.
Breakout Watch: A decisive close above $0.7325 (POC) with volume shifts focus to $0.8451. Conversely, a break below $0.5801 targets $0.53.
Patience is Key: Low volume suggests waiting for a clear catalyst (e.g., news, BTC move) to drive ADA out of this range.
Wrapping It Up
The $0.5801 swing low long with SL below and TP at $0.7 - $0.8451 is the standout trade right now—low risk, high reward, and backed by confluence. Monitor volume closely, as it’s the linchpin for any breakout or reversal. If ADA holds this support and volume picks up, the retest of $0.8451 becomes plausible.
If you found this helpful, please leave a like and a comment. Happy trading!

HBAR Bulls Nowhere in Sight – Where’s the Bottom?HBAR had an incredible bull run from November 2024 to mid-January 2025, rallying for 74 days and gaining +865%, moving from $0.0416 to a high of $0.40139. However, since then, the market has reversed, entering a 73 day downtrend and dropping -58% from its peak.
Now, the big question is: where is HBAR heading next? Let’s break down the key resistance and support levels and map out potential high-probability trade setups.
Current Market Structure – Bears in Control
HBAR is trading at $0.16765, just below a key low at $0.17721, which it must reclaim to show any bullish strength. Several critical resistance levels lie ahead:
🔴 $0.18 - $0.20 Zone: Previously strong support, now acting as resistance
🔴 Weekly Level at $0.18375 – A significant resistance zone
🔴 Monthly Open at $0.21352 – Bulls must reclaim this to regain momentum
🔴 Weekly 21 EMA at $0.20 & 21 SMA at $0.2348 – Price is trading below both, a bearish sign
🔴 200 EMA/SMA Lost – Another bearish indicator
🔴 0.618 Fibonacci Retracement at $0.17904 – This level was lost, further confirming the bearish trend
📉 Conclusion: As long as price remains under $0.18-$0.20, the trend remains bearish, and there is no sign of reversal yet.
Where Could HBAR Go Next? Finding the Next Support Levels
If HBAR fails to reclaim the key resistance levels, price could continue dropping toward the next major support zone. Here’s where the next support zone is:
🟢 0.786 Fibonacci Retracement at $0.1186 – A key potential target
🟢 Weekly Support at $0.1259 – Close to the 0.786 Fib level, adding confluence
🟢 Monthly Support at $0.1145 – Further strengthening this zone
🟢 Log Scale 0.5 Fib Retracement at $0.12923 – From the full bull run, adding another layer of support
🟢 21 Monthly EMA at $0.132 & 21 Monthly SMA at $0.1079 – These levels align perfectly with the other supports
🟢 Fib Channel Lower Support (April 4th - 9th) – If price drops to $0.12 during this time window, it aligns with the lower channel support line
📉 Conclusion: A strong support zone lies between $0.132 - $0.1079, where buyers could step in for a potential bounce.
Potential Trade Setups
📌 Long Setup (High Probability Reversal Zone)
Entry: DCA around $0.12
Stop Loss: Below $0.098
Target: $0.166
Potential Gain: +40%
R:R Ratio: 2:1 or better
🔹 If price regains $0.18-$0.20, we can look for long opportunities.
📌 Short Setup (For Those Already Shorting from Higher Levels)
Take Profit Target: Between $0.14 - $0.12
Stop Loss: Above $0.20
Market Outlook
With HBAR currently in a bearish trend, we have clearly defined key support and resistance zones and potential trade setups. The next few weeks will be crucial, as price either reclaims $0.18-$0.20 (bullish case) or drops further toward $0.12 (where a strong bounce could happen).
📢 Patience is key! Let the setup come to you and don’t force trades. Always manage risk properly.
What are your thoughts on HBAR’s next move? Leave a comment below! 🚀

Bitcoin’s Battlefield: Support, Resistance and Trade SetupsBitcoin’s price has been showing signs of a sustained downtrend after forming a double top pattern. The recent action, combined with low volume and failure to breach key resistance zones, points to a likely retest of lower levels. Over the weekend, the price couldn’t break past the 85K resistance, and the low trading volume around this level suggests that buyer interest is waning.
6H TF Chart:
Big Picture vs. Short-Term Action
On a higher timeframe (6H), my indicator neatly outlines the bear market of 2022 and the bull market that started in early 2023—when the “cloud” turned green, signaling a shift in momentum. The cloud's lower boundary is currently at $73,364, which is key. Imo, holding above 70K is critical for keeping that bullish vibe alive.
1H TF Chart:
Switching over to the 1H chart, the picture shows a bearish structure. The upper resistance around 95K (which aligns with the yearly open near $93,455.85) is proving a solid resistance. The anchored VWAP from the all-time high also sits right at this level, adding more weight to the resistance. Bulls need to clear this yearly open to signal a true recovery.
Key Levels & Confluence Zones
1.) Upper Resistance – 93K to 95K:
The 95K zone aligns closely with the yearly open ($93,455.85) and the anchored VWAP from the all-time high, both acting as resistance.
Daily moving averages (62 EMA at ~$91,316 and 62 SMA at ~$94,900) provide further confluence.
Additional resistance between 85K-86K.
2.) Critical Support – 73K to 70K Zone:
The lower edge of the cloud on the 6H timeframe sits around 73K.
The 0.382 Fibonacci retracement (from the low at $15,473.78 to the all-time high at $109,354) is at $73,492, while the 0.618 retracement (from $49,217 to the all-time high) is around $72,205.
Moving Averages on Weekly Chart: The weekly 62 EMA ($72,919) and 62 SMA ($71,590) align well with this support region.
Additional Support: A bullish monthly order block at $71,320 adds another layer of confluence.
Psychological Importance: A hold above 70K is critical to maintaining bullish momentum.
3.) Monthly Open – $83,385.74:
This level serves as a pivot: price is currently hovering below it. A reclaim by bulls would be a positive sign for higher price action, while a rejection reinforces the bearish setup.
Trade Setups
Long Trade Setup:
Entry: Consider laddering in between 75K and 70K as the price retests support.
Take Profit: Aim for the monthly open (~84K) initially, and if support holds and flips, a move toward 90K could be considered.
Stop Loss: Set below 70K to protect against a further downturn.
Short Trade Setup:
Entry: A short setup can start at the monthly open, using a laddering approach between 84K and about 86.9K.
Take Profit: Target the previous low or 74K.
Stop Loss: Place just above 87K to keep risk in check.
Thank you for taking the time to read through this technical analysis. I hope it provides valuable insights for your trading decisions. Happy trading!

SOL Trading Plan: Stacking Entries Like a ProSolana (SOL) has been in a slow uptrend over the past five days, after hitting the low at $112. The current price action looks like an ABC corrective pattern, which could mean we’re setting up for lower prices.
To get the best trade execution, we'll use a laddered entry approach, meaning we’ll scale into positions gradually instead of going all in at once. This helps us get a better average entry price while managing risk effectively. By placing orders at key levels, we increase our chances of catching the right move without overcommitting too early.
Resistance Zone ($136 - $143.80)
A major resistance zone has formed between $136 - $143.80, where price is likely to struggle. This area contains multiple technical confluences that suggest a potential reversal or strong reaction:
$136 – 0.618 Fibonacci Retracement
$140.09 – 1:1 Trend-Based Fibonacci Extension
$141.40 – Anchored VWAP from the $179.85 swing high
$143.80 – Point of Control (POC) from the 19-day Fixed Range Volume Profile
This makes $136 - $143.80 a prime area to consider short positions, especially if price starts showing weakness.
Support Zone ($102.1 - $98.50)
On the downside, a major demand zone is forming between $102.1 - $98.50, where buyers are likely to step in aggressively. This zone has multiple technical confluences, making it a high-probability long entry area:
$102.1 – 2024 Yearly Open & Monthly Support
$100 – Bullish Monthly Order Block & Anchored VWAP Support
$98.50 – Final key demand zone
This zone presents a solid long opportunity, allowing for gradual scaling into positions as price moves deeper into support.
Short Trade Setup – Laddered Entry Approach
Instead of entering all at once, we’ll ladder into the short position gradually, starting small and increasing size as price moves deeper into resistance.
Short Entry Levels & Position Sizing
Trade Details
Average Entry Price: $140.12
Take Profit Target: slightly above $102.10 (Monthly Level)
Stop Loss: slightly above $146.70 (Above POC)
Risk-Reward Ratio (R:R): ~6:1
Long Trade Setup – Laddered Entry Approach
For the long setup, we start with small entries at higher prices and increase size as price moves deeper into support, ensuring a better average entry in a key demand zone.
Long Entry Levels & Position Sizing
Trade Details
Average Entry Price: $102.72
Take Profit Target: slightly below $120.00
Stop Loss: slightly below $95.00
Risk-Reward Ratio (R:R): ~2.45:1
Market Outlook
Short Bias: Until price reclaims $143.80, this remains a strong resistance zone for potential short trades.
Short Setup: Laddering into resistance ensures better risk management and higher average entry efficiency.
Long Setup: Starting small at $112 and increasing position size down to $98.50 ensures strong positioning in a high-confluence demand zone.
By scaling into trades rather than committing at a single price, we increase flexibility, improve trade execution, and adapt better to price movements. 🚀
Weekly Timeframe - 200 EMA Support
$100 coincides with the 200 EMA on the weekly timeframe, adding confluence to this area as strong support.
If Solana decisively breaks above $144, it would invalidate the short thesis and suggest a potential move higher toward $150. Conversely, a strong rejection from the resistance zone would likely accelerate the move toward $112 to test demand at swing low.

XLM Crashes Below Key Support – Is a Reversal Near?XLM has broken its previous low, raising the question: where is the next major support zone? To determine this, we will focus on fibonacci, moving averages, and order blocks to find a high-probability bounce area for a potential long position.
🔍 Fibonacci Retracement – Locating the Next Support Level
Using the Fibonacci retracement tool from the low at $0.0757 to the high at $0.6374:
0.618 Fib Retracement → $0.2903 (Already Lost) ❌ Current Price: $0.248
Next Major Fib Level – 0.786 Retracement at $0.1959
Since the 0.786 Fib level is a key retracement point, we need further confluence factors to confirm its strength as a potential support zone.
🔗 Confluence Factors Strengthening the Support Zone ($0.1959 – $0.17179)
1:1 Trend-Based Fibonacci Extension
High: $0.6374
A: $0.3179
B: $0.515
1:1 extension aligns at $0.1902 → Strong confirmation near 0.786 Fib retracement ✅
Wave A-B Fibonacci Extension
1.618 Fib extension from wave A to B is at $0.1875 → Aligns with the 1:1 trend-based extension ✅
Daily Support Level at $0.1962
Sits almost exactly at the 0.786 retracement ($0.1959) ✅
21 EMA & 21 SMA for Moving Average Support
21 EMA at $0.20338
21 SMA at $0.17187
Order Block Between $0.2208 – $0.1964
Demand area aligns with the major support zone ✅
Key Takeaway:
A high-probability support zone is now identified between $0.1959 and $0.17179, with multiple confluences suggesting a strong potential bounce.
Trade Plan – Scaling Into a Long Position
Given the strong confluence at the support zone, the best approach is scaling into a long trade.
DCA Entry Strategy:
Start scaling in at $0.22, as an order block exists between $0.2208 – $0.1964
Main focus remains on the support zone ($0.1959 – $0.17179)
Stop Loss:
Below the 21 SMA ($0.17187) for invalidation
Take Profit Levels for Optimal R:R:
First TP at $0.25 → Resistance area
Next TP at $0.30 → Strong psychological & resistance level
R:R Approximation:
2:1 R:R for first TP ($0.25)
3:1+ R:R if targeting $0.30
High-Probability Support Zone Identified
✔ Multiple confluences confirm a strong support zone at $0.1959 – $0.17179
✔ Scaling into a long from $0.22 to $0.17179, with stop loss below the 21 SMA ($0.17187)
✔ Take profit levels set at $0.25 & $0.30 for a solid R:R trade
Alternative bullish scenario: A reclaim of lost key low at $2526 with rising volume could signal a long opportunity, only on confirmation.
💬 Will XLM bounce from this key support? Let me know your thoughts in the comments! 🚀🔥

Bitcoin: Mastering the Art of Resistance and SupportBitcoin recently broke below a 105‐day trading range, anchored by the critical 90K level. After the breakdown, it found support around 80K, prompting a sharp rebound back toward the previous range. This rebound, however, was short‐lived: BTC tested 95K, then quickly retraced, only to rally again toward 90K, where it trades at present.
Overview of BTC’s 105‐Day Range Break and Retest:
Yearly Open at $93,576: This is the single most important level to watch. Price currently sits below the yearly open, suggesting that, for now, bears hold the upper hand. If bulls cannot reclaim this threshold, the yearly candle remains vulnerable to turning red.
90K–95K Resistance Zone: With Bitcoin failing to sustain gains above 95K, this band becomes a natural focal point for potential short entries. Bears are expected to defend this region aggressively.
The question: Where do we go next? Let’s break down both the resistance (short setup) and an upcoming support zone (long setup), incorporating a variety of confluences—from volume profiles and trend lines to Fibonacci retracements and pitchfork alignments.
1. Resistance Analysis & Short Thesis
1.1. Double Top Target at $72,800
A double top pattern has formed, suggesting a measured‐move target near $72,800. While not a guaranteed endpoint, this target serves as an early directional clue. Price could still find support at higher levels, so we use this only as one piece of a larger puzzle.
Double Top Pattern with $72,800 Target:
1.2. The 105‐Day Trading Range & Retest
Bitcoin spent over 100 days ranging between roughly 90K and 105K. The downside break turned that prior range into a new resistance zone—specifically 90K–95K, with an even stronger cluster up to $96,418 (Point of Control from that range).
Fixed Range Volume Profile: The POC (Point of Control) from this 105‐day period lies at $96,418.05, further extending our resistance zone. Price retesting anywhere between 90K and the POC around 96K sets up potential short entries.
Fixed Range Volume Profile Showing POC at $96,418.05:
Stop Loss Guidance: Given the possibility of wicks or “stop hunts,” a safer invalidation point sits above 98K. That buffer allows the trade room to breathe without prematurely stopping out on minor spikes.
1.3. Daily & Weekly Moving Averages
In addition to the above factors, both the daily 21 EMA/SMA and the weekly 21 EMA/SMA are converging in the 90-92K region, acting as additional resistance.
1.4. Bearish Trend Line & Pitchfork Alignment
Bearish Trend Line: Connecting the all‐time high at $109,588 and the swing high at $106,457.44 yields a downward sloping line. This trend line has already acted as resistance near 100K on February 21.
Pitchfork (Modified Schiff): Anchoring from the all‐time high (109,588) to the swing low (97,777.77) and back up to 106,457.44 confirms the same bearish trajectory, aligning neatly with the trend line around 95K.
Bearish Trend Line & Pitchfork Convergence Around 95K:
1.5. Monthly Order Block & Fibonacci Confluence
Monthly Order Block: Spanning from the yearly open (93,576) up to the POC (~96,418), this monthly order block forms a substantial supply zone. Price often gravitates toward the median line of an order block, which sits near 94–95K.
Fibonacci Retracement (0.786): From the swing high at 99,475 (Feb 21) down to the low at 78,258.52, the 0.786 retracement is at 94,934.67—almost exactly the median line of the monthly order block.
Monthly Order Block, Median Line, and 0.786 Fib at ~94,934.67:
When price rallies swiftly to the 0.786 for the first time, it often presents an ideal short entry—especially under a confluence of bearish signals:
2. Short Trade Setup: Laddering In & Out
2.1. Scaling In (Entries)
We allocate $25,000 (from a $100,000 account) and ladder our entries from 89,736 up to 96,206:
Short Trade Laddered Entries:
Stop Loss: $97,560 (slightly below the higher “breathing room” area of 98K).
Max Risk: Approximately $1,028.16 (about 4.11% of the GETTEX:25K position, or 1.03% of the $100k account).
2.2. Scaling Out (Exits)
We plan to take profits in increments as price drops, aiming for an average exit around $79,822.10:
Potential Profit: Approximately $3,704.16 on a $25,000 position, which is +14.82% (or +3.70% of the $100k account).
Risk‐to‐Reward Ratio: 3.60, an attractive R:R for a swing trade.
3. Support Analysis & Long Thesis
Having addressed the downside retest and short scenario, let’s turn to potential support where Bitcoin might reverse for a long trade.
3.1. Double Top Target & 5‐Wave Structure
The double top projected target near $72,800 aligns with a broader Elliott Wave possibility, where BTC may have completed a 5‐wave structure from the low at $15,476 to the all‐time high at $109,588.
A typical Fibonacci retracement of this 5‐wave move suggests the 0.382 level at $73,637.22, which sits near a notable swing high of $73,777—coincidence?
5‐Wave Structure & 0.382 Fib Retracement at ~$73,637:
3.2. Monthly Bullish Order Block & Further Fib Confluence
Monthly Bullish Order Block: Located around $71,280, historically a place where buyers have stepped in.
Fib Retracement (49K to 109K): The 0.618 retracement lands at $72,144.62, adding further confluence around the 72–73K zone.
Taken together, we begin to see a support band forming between $73,777 and $71,280.
Monthly Bullish Order Block & 0.618 Fib ~$72,144.62:
3.3. Fib Speed Fan & Bullish Trend Line
Fib Speed Fan (0.7): On higher timeframes, the 0.7 fan lines up with the same 71–73K region if BTC dips this month.
Bullish Trend Line: Connecting the lows at 49K and 52,550 also aligns with this zone, reinforcing the idea that a cluster of support awaits if price slides that far.
Bullish Trend Line & Fib Speed Fan ~$71–73K:
3.4. Potential Long Trade Setup
Entry Range: Ladder in from 76K down to 71K (or adjust according to personal risk appetite within that 73–71K zone).
Stop Loss: Below 70K, providing sufficient buffer.
Target: At least the monthly open ($84,350), or higher if momentum supports a stronger bounce.
Risk‐to‐Reward (R:R): Aim for 2:1 or better, depending on exact entries and the final target.
4. Summary
Short Trade:
Resistance Zone: 90K–95K, extending up to $96,418 (POC) and with the daily/weekly 21 EMA/SMA acting as additional resistance in the 90-92K region, plus a stop‐hunt buffer above 98K.
Laddered Entry: GETTEX:25K allocated, averaging around $93,706, with a stop near $97,560.
Scaling Out: Average exit near $79,822, netting a +14.82% gain on the position (+3.70% on account).
R:R: 3.60—solid for a swing setup.
Long Trade:
Support Zone: Between $73,777 and $71,280, with multiple Fibonacci and structural confluences.
Laddered Entry: Potential DCA from around 76K down to 71K, with a stop under 70K.
Target: At least $84,350 (monthly open), likely offering a 2:1 or better risk‐to‐reward.
Sharp moves up or down have been the norm lately, often gravitating to the 0.786 fib retracement on each leg, so remain vigilant for sudden volatility.
Ultimately, flexibility is key. If Bitcoin reclaims the yearly open at $93,576 and pushes decisively above 95–98K, the bearish case weakens. Conversely, a significant drop below 80K brings the deeper support zone near 73–71K into sharper focus.
Always be prepared for shifts in market conditions—confirm each setup with multiple indicators and chart patterns before entering any trade. Stay up to date with evolving market dynamics and adjust your strategy accordingly.
Happy trading!
P.S. If you have any coin requests, feel free to share them in the comments. I will be selecting one or two for the next technical analysis.

Coffee Futures Outlook: Potential Corrections Ahead After HistorCoffee futures have experienced a strong upward movement, breaking their all-time high and unlocking Fibonacci-based mirroring and projection targets. However, the manner in which the price reached this level—overextended and distanced from its moving averages—combined with last month’s candlestick signaling selling pressure, suggests a high probability of corrective movements in the coming months. Should a pullback occur, it will be crucial to monitor how the price reacts upon testing the 20-period moving average.

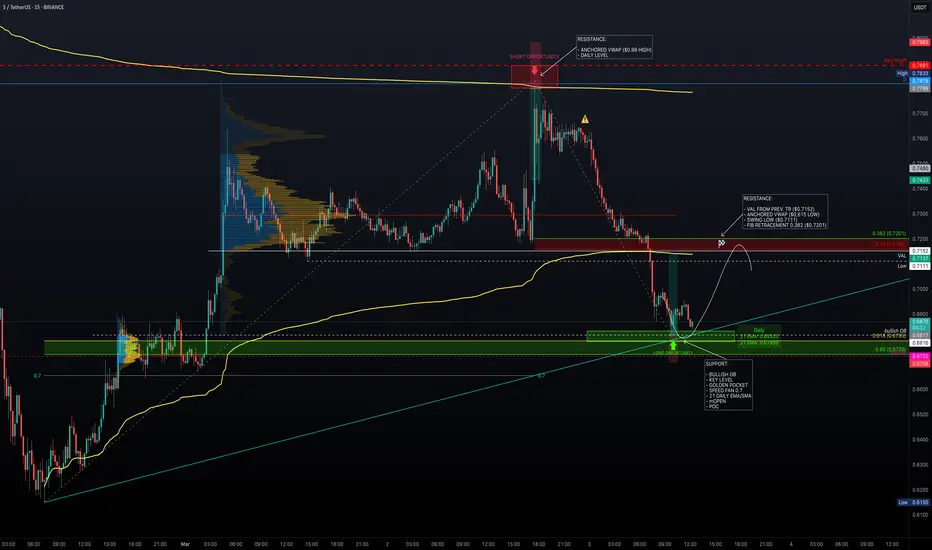
Major Levels – Is Sonic Ready to Pump?After reaching the daily resistance level ($0.7818), price faced strong rejection. The anchored VWAP, acting as dynamic resistance just below the daily level, provided additional confluence for a low-risk short opportunity.
Additionally, a key high at $0.7891 further reinforced this resistance zone. Following the rejection, price sharply declined -13%, retracing back into the previous trading range.
Support Confluence
Price is now approaching a well-defined support zone:
Bullish Order Block: $0.6816
Key Level Near Order Block: $0.6803
Golden Pocket (Fib 0.618 - 0.65): 0.618 at $0.6793 & 0.65 at $0.6739
Monthly Open: $0.6732
Point of Control (POC): $0.6732 (aligning with Monthly Open)
Daily 21 EMA/SMA: 21 EMA at $0.6835 & 21 SMA at $0.6790
Fib Speed Fan 0.7 (from $0.615 to $0.7818): Providing additional support in this zone
Long Trade Setup
Entry Zone: $0.6816 – $0.6732
Stop Loss: Below the Monthly Open ($0.6732)
Take Profit Zone: $0.7111 – $0.7201
Risk-to-Reward (R:R): 3:1 R:R setup, offering a high-probability trade
Take Profit Targets & Resistance Zones
Previous Swing Low: $0.7111 (untested)
Value Area Low (VAL): $0.7152
Anchored VWAP (from $0.615 low): $0.7137
Fib Retracement 0.382 (from $0.7818 high to current low): $0.7201
DEEP - Finding The Next Trade SetupDEEP recently took out the January 13, 2025 low at $0.12345 with a Swing Failure Pattern (SFP), followed by a successful retest. This led to a bounce that hit a key level at $0.12141, presenting a solid long opportunity with minimal risk.
After this, the market turned bullish, forming a 5-wave structure and rallying to the 0.786 Fibonacci retracement level at $0.18643 (measured from the $0.20473 high to the $0.11922 low). This was a key take-profit zone for longs and a great short opportunity.
Adding confluence, the anchored VWAP also acted as resistance just above at $0.19, offering another low-risk short setup. Additionally, a key resistance level at $0.1809 further reinforced the rejection zone.
Current Price Action & Short Setup
From the 0.786 Fib retracement, DEEP retraced 20% downward, nearly touching the 0.618 retracement of the 5-wave structure before bouncing. Now, price is finding resistance at the golden pocket (0.618 at $0.17347 and 0.666 at $0.17534) of the recent drop, aligning perfectly with the daily 21 EMA ($0.1757) and daily SMA ($0.17347).
This setup suggests an ABC corrective move is forming.
Using the trend-based Fibonacci extension, the 0.786 extension aligns with the 0.618 retracement at $0.1457, creating a strong short setup.
Short Entry: Between $0.17347 - $0.17534
Target: $0.1457 (0.786 trend-based Fib extension / 0.618 retracement)
Stop Loss: $0.1845
Risk/Reward: 2.5:1
There’s also potential to extend the target to the 1:1 trend-based Fib extension at $0.13733, but this would depend on price action.
Potential Long Setup
If price reaches the $0.1457 support zone, this could present a high-probability long opportunity.
Entry: Around $0.1457
Risk/Reward: 2:1 or better, but confirmation is needed before executing the trade

SOL on the Slide: Is a Bounce from $150 in the Cards?Solana has been in a downtrend for over 30 days after reaching its ATH at $295.83. For the past two weeks, SOL was stuck in a trading range that formed a descending triangle (a bearish pattern) which eventually broke down, confirming the downtrend. Additionally, SOL lost its yearly support level at $189.31. Where is SOL heading next? Let's find out!
Key Support Zone
Our main long opportunity is around the $150 level, where several confluences align:
Fibonacci Levels:
The 0.5 fib retracement of the entire 5-wave structure sits at $151.92.
The 0.786 fib retracement from the 5th wave is at $149.77.
A fib extension 1.618 of the descending triangle is at $148.65, which is very close to the $150 mark.
Volume Profile:
The Point of Control (POC), highlighted by the red horizontal ray, is around $144, adding another layer of support.
Trade Setup
Currently waiting for SOL to reach the support zone between $152 and $144. An alarm is set when price nears these levels for a long opportunity.

BNX - Finding Support, Resistance and Trade SetupsAfter yesterday's push to test the $1 level, BNX got hit with some rejections. Following the swing high SFP (Swing Failure Pattern), the price is down about 10%. Let's update our analysis with some key levels that clearly outline our support and resistance zones, and then we'll dive into the trade setups.
Support & Resistance Criteria
Resistance Levels
BNX faced rejection around the $1 mark, with the resistance zone clearly defined between $1.0137 and $1.0263
A short trade could have been initiated from this zone, with a stop loss placed just above $1.03
The Fibonacci retracement highlights key resistance levels at: 0.618 retracement at ~$0.9774, 0.786 retracement at ~$0.9952
The Point of Control (POC) of the current trading range sits around 0.786, and the daily open is at $0.9966
The pitchfork upper resistance trend line further reinforces this area
Moving Averages Adding Resistance:
15-minute 200 SMA: Currently at $0.9836, aligning with the fib retracement 0.618 and adding extra resistance
1-hour 55 SMA: Currently at $0.98085, further supporting the resistance
Note: These SMAs are expected to move down in price over time
Support Levels
Primary Support for Long Trade Opportunity:
The overall short trade target remains at around $0.8, supported by multiple Fibonacci confluences:
-0.6 negative Fibonacci retracement at $0.7912
Trend-based Fibonacci extension 1.272 at $0.7914
The previous key high at $0.7801 and Fibonacci extension 0.133 at $0.7924
These levels give us a strong support window between $0.8 and $0.78.
If the price reaches this level by 17th February, the pitchfork's lower support trendline adds even more strength.
Moving Average for Support:
Daily 200 SMA: Currently at $0.7786, which confirms the support zone
Note: This SMA is expected to move up as time passes, reinforcing support over time
Additional Support Zone:
Another key support region lies between $0.72 and $0.7075, with a key level at $0.7177 supported by a weekly bullish order block, trend-based Fibonacci extension 1.618 at $0.7075, and the anchored VWAP (yellow line) just below.
Trade Setups
Short Trade Setup
Entry Strategy: Look for short entries between $0.981 and $1 as the price tests the resistance area. Confirm entry through order flow and rejection candles
Stop Loss (SL): Place the SL just above the recent high at around $1.018
Target: Aim to reach $0.8, where our confluence of Fibonacci levels and moving averages align
Risk/Reward Ratio: This setup offers an amazing risk/reward ratio of approximately 5:1! Potentially up to 9:1 with effective DCA (dollar-cost averaging) into the short trade
Long Trade Setup
Entry Strategy: If price drops decisively and reaches the support window between $0.8 and $0.78, consider a long trade on confirmation
Stop Loss (SL): Place the SL below $0.77
Target: Aim for a profit target at $0.85
Risk/Reward Ratio: This setup offers an approximate risk/reward ratio of 2.5:1
Keep an eye on the charts, set your alarms to the key support and resistance zones, and wait for a solid signal before jumping in. Be ready to tweak your strategy as the market shifts. Happy trading!

Analysis of Moving average stock (26/Nov/2024)Analysis of Moving average stock (25/Nov/2024)
follow for more updates and information
Understanding and analysing moving averages is vital when executing technical analysis on stocks and finding ideal stocks to invest in that match the investment strategy. However, finding stocks that fulfil the set moving average criteria is difficult as it requires taking stocks individually and determining if their moving average matches the criteria included in the investment strategy. The process is highly time-consuming and may lead to manual errors, forcing investors to make the wrong investment decisions.
A moving average screener is an ideal tool that assists investors in filtering thousands of stocks based on their moving averages to produce a list of stocks that have the same moving averages as the criteria set by the user. Investors can customise moving average stock screeners to meet specific criteria based on the trader's or investor's preferences. For example, some traders may use moving average crossovers to identify entry and exit points in a trade, while others may use moving average trends to identify long-term investment opportunities. However, investors must use the screeners along with other technical indicators and tools to make informed investment decisions.

MA Trading Strategies for Experienced TradersMA Trading Strategies for Experienced Traders
Despite their simplicity, moving average (MA) trading strategies remain popular with experienced traders looking to refine their market analysis. This article delves into various MA types and four advanced MA strategies, including moving average ribbons, envelopes, and channels, providing actionable insights to potentially boost trading performance.
Moving Average Indicators: Advanced Types
This is a short overview of moving averages (MAs). If you already know this, please scroll down and learn advanced types of MAs and comprehensive trading strategies.
Moving averages are fundamental tools used by traders to smooth out price data and identify trends. By averaging the price over a specified period, MAs help traders filter out the noise from random price fluctuations, providing a clearer picture of the underlying market direction.
Traders use moving averages in various ways, such as determining trend direction, identifying potential support and resistance levels, and confirming other technical indicators. They can also help in spotting reversals and momentum changes. Below are the most notable moving averages that traders can use to construct a strategy.
To see how each works, head over to FXOpen’s free TickTrader trading platform to explore every tool described here and a world of more than 1,200 trading tools.
Types of Moving Averages
Simple Moving Average (SMA)
- Overview: The SMA calculates the average of a selected range of prices, typically closing prices, over a specific period.
- Usage: SMA trading is straightforward. The Simple Moving Average helps traders identify the direction of the trend by smoothing out short-term fluctuations.
Exponential Moving Average (EMA)
- Overview: The EMA gives more weight to recent prices, making it more responsive to new information.
- Usage: It reacts more quickly to price changes than the SMA, which can be beneficial in fast-moving markets.
Weighted Moving Average (WMA)
- Overview: The WMA assigns different weights to data points, with the most recent prices typically given more importance.
- Usage: Like the EMA, it reduces lag but in a slightly different manner by linearly increasing the weight of each successive data point.
Volume-Weighted Moving Average (VWMA)
- Overview: The VWMA takes volume into account, giving more weight to price points with higher trading volumes.
- Usage: Useful in identifying price moves that are supported by high trading volumes, which can indicate stronger trends.
Hull Moving Average (HMA)
- Overview: The HMA aims to improve smoothness and responsiveness to the latest data. It’s calculated using a combination of WMAs.
- Usage: Known for its responsiveness and reduced lag, making it a favourite for trend analysis.
Arnaud Legoux Moving Average (ALMA)
- Overview: The ALMA uses a Gaussian distribution to smooth data, reducing lag and improving the reliability of signals.
- Usage: It's designed to provide a balance between smoothness and responsiveness.
Volume-Weighted Average Price (VWAP)
- Overview: The VWAP calculation is based on volume and price. The indicator reflects the average price a security has traded at throughout the day.
- Usage: Widely used by institutional traders, VWAP helps determine the true average price of a security over a given period. It is crucial for understanding the market's intraday trend and for executing large orders efficiently without distorting the price.
Advanced Moving Average Indicators
Moving Average Ribbons
- Overview: This involves plotting multiple moving averages of different lengths on the same chart. The Guppy Multiple Moving Average (GMMA) is a popular example, using short-term and long-term MAs to analyse market behaviour.
- Usage: The spacing and interaction between these ribbons can indicate the strength and direction of a trend. Converging/tightening ribbons may signal a trend reversal while diverging/widening ribbons indicate a strong trend.
Moving Average Envelopes
- Overview: Envelopes consist of two bands plotted at a fixed percentage distance above and below a moving average (e.g., 2%).
- Usage: They help identify overbought and oversold conditions. Price movement outside the envelopes can indicate potential reversal points or the start of strong trends.
Moving Average Channels
- Overview: Channels are created by plotting a moving average of the highs and a moving average of the lows over a specified period.
- Usage: Traders use these channels to identify breakouts and confirm trends. Breakouts beyond the channel may signal the beginning of a new trend.
Four Advanced Moving Average Trading Strategies
Here are four advanced moving average trading strategies. You can test other settings to make the strategies more suitable for your trading approach and the timeframe you trade on.
Moving Average Ribbon Strategy
The Moving Average Ribbon Strategy leverages the Guppy Multiple Moving Averages (GMMA) alongside the ADX to identify potential breakout points. This strategy works by observing the convergence and divergence of multiple MAs to pinpoint moments of price compression and subsequent breakout, enhanced by confirming the trend strength with the ADX.
Indicators Used
- Guppy Multiple Moving Averages (GMMA): This indicator uses a series of short-term and long-term moving averages. The short-term MAs are sensitive to recent price changes, while the long-term MAs help identify the overall trend.
- Average Directional Index (ADX): This measures the strength of a trend, with values above 20 indicating a strong trend.
Entry
- Traders typically look for the long-term MAs in the GMMA (red) to converge and tighten, indicating a compressed range.
- Then they look for the price to break away from the long-term MAs with a series of closes beyond the short-term MAs - below in the downturn and above in the uptrend. Ideally, these are strong closes with minimal wicks, but a series of candles in the projected direction suffice.
-The price should remain beyond both the short-term and long-term MAs.
- The ADX should be above 20 and rising, indicating strong trending conditions. It shouldn’t be stalling or declining. Sometimes, the ADX crosses above 20 after the price has moved beyond the long-term/short-term MAs; this is also valid.
- Once these criteria are met, traders enter with a market order.
Stop Loss
- Stop loss is commonly set beyond the long-term MAs. This provides a buffer against minor fluctuations and potentially protects against false breakouts.
Take Profit
- Profits might be taken at key support or resistance levels.
- Alternatively, traders might look for the price to close beyond the short-term MAs in the opposite direction (e.g., a bullish close above the MAs in a short trade).
- A trailing stop loss positioned beyond the long-term MAs can also be used to capture sustained trends while potentially protecting gains.
Moving Average Envelopes Strategy
The Moving Average Envelopes Strategy leverages the EMA envelopes to identify potential reversal points by examining price interactions with the upper and lower bands. When combined with RSI, this stock and forex moving average strategy helps traders pinpoint overbought and oversold conditions, offering a robust method for trading reversals.
Indicators Used:
- Moving Average Envelopes: Uses an exponential moving average (EMA) set to a length of 20. The envelope percentage is adjusted based on asset volatility: 0.25%-0.5% for forex and 1%-2% for stocks might be good starting points, with a lower percentage creating more frequent opportunities but with greater false signals and vice versa. It forms an upper and lower band alongside a central EMA, similar to Bollinger Bands.
- Relative Strength Index (RSI): Set to a standard length of 14, indicating overbought conditions above 70 and oversold conditions below 30.
Entry
- Traders typically observe when the price crosses the moving average envelope bands, either upper or lower. Ideally, the price wicks through and then closes back inside the boundary, but sustained price action beyond these levels is also considered valid.
- The RSI should be above 70 for a potential short entry, indicating overbought conditions, or below 30 for a potential long entry, indicating oversold conditions.
- An entry might be made once the RSI crosses back into the normal range (between 70 and 30) and the price closes back inside of the bands.
Stop Loss
- Stop losses are generally set beyond the most recent swing point to potentially provide a buffer against minor fluctuations.
Take Profit
Profits might be taken at multiple points:
- The centerline EMA, which acts as a mean reversion target. This is the smallest target, which may be insufficient when considering the risk/reward ratio.
- The opposite envelope bound, capitalising on the price's full range movement.
- Significant support or resistance levels, providing predefined exit points.
- When the RSI crosses into the opposite territory (e.g., from overbought to oversold), indicating a potential reversal in the opposite direction.
Strategy with Three MAs
The strategy with three MAs combines the Hull Moving Averages (HMA) with the Commodity Channel Index (CCI) to identify potential trading opportunities. This strategy leverages the smoothness and responsiveness of the HMA and the momentum indications provided by the CCI to capture effective trade entries and exits.
Indicators Used
- Hull Moving Averages (HMA): Three HMAs with lengths of 13, 36, and 100.
- Commodity Channel Index (CCI): A momentum-based oscillator set to a standard length of 20. The CCI measures the difference between the current price and its average over a given period.
Entry
- Traders look for the price to be above the 100-period HMA for long positions and below it for short positions.
- Simultaneously, the CCI should be above 100 for long entries, indicating strong upward momentum, and below -100 for short entries, indicating strong downward momentum.
- Traders then watch for the 13-period HMA to cross above the 36-period HMA for long positions or below it for short positions. It should ideally be the first crossover after the price moves above or below the 100-period HMA. Occasionally, the CCI may move above 100 or below -100 shortly after this crossover occurs rather than before.
- Once these criteria are met, they enter with a market order.
Stop Loss
- Stop losses are typically set just beyond the 36-period HMA.
- Alternatively, traders may choose the 100-period EMA or a recent swing point.
Take Profit
- Profits might be taken once the price crosses back over the 100-period HMA, signalling a potential end to the current trend.
- Alternatively, traders may choose to take profits at significant support or resistance levels, providing predefined exit points based on market structure.
Moving Average Channel Strategy
The Moving Average Channel Strategy utilises the Moving Average Channel along with the Parabolic SAR and ADX to identify potential trading opportunities. This strategy helps traders capture breakouts by confirming trend strength and potential reversals, offering a robust approach to trading trending markets.
Indicators Used
- Moving Average Channel: Set to a length of 50, this channel uses the moving averages of the highs and lows to create two lines, forming a channel around the price.
- Parabolic SAR: An indicator that plots dots above or below the price to signal potential reversals.
- Average Directional Index (ADX): Measures the strength of a trend, with values above 20 indicating a strong trend.
Entry
- Traders look for the price to trade through the Moving Average Channel, either breaking from above to below (for a downtrend) or from below to above (for an uptrend), ideally with a series of strong candles.
- Simultaneously, the Parabolic SAR should plot dots above the price, indicating a bearish signal, and vice versa.
- The ADX should be above 20 and rising, not stalling or declining, confirming a strong and growing trend.
- All three signals (price breaking through the channel, Parabolic SAR, and ADX above 20 and rising) should occur relatively close to each other, typically within a few candles.
- Once all criteria are met, traders enter.
Stop Loss
- Stop losses are typically set just beyond the Moving Average Channel or at a nearby swing point.
Take Profit
- Profits might be taken when the price closes back through the other side of the Moving Average Channel, signalling a potential trend reversal. In this scenario, there is a risk of missing a part of potential profits in the solid trend.
- Alternatively, traders might choose to take profits at significant support or resistance levels, providing predefined exit points based on market structure.
Best Practices for Using Moving Average Indicators
Moving average indicators are essential tools in technical analysis. Here are some best practices to maximise their effectiveness:
Choosing the Right Type
Selecting the appropriate type of moving average is crucial. For example, an EMA is more responsive to recent price changes, making it suitable for short-term trading, while an SMA may be better for long-term trend analysis.
Choosing Suitable Lengths
It’s best to use a combination of short-term and long-term moving averages to get a comprehensive view of the market. For instance, combining a 20-day, 50-day, and 200-day moving average can help in identifying both short-term fluctuations and long-term trends.
Experimenting
There are various moving average types beyond the well-known SMA and EMA, such as the Hull Moving Average (HMA), Volume Weighted Moving Average (VWMA), and more. Experimenting with different types can help you find the best fit for your MA strategy.
Combining with Other Analysis
You can potentially enhance your moving average strategy by combining it with other forms of analysis and indicators, such as those described in the strategies above. This will allow you to confirm signals and get a more comprehensive market picture.
Backtesting and Forward Testing
Before deploying any moving average strategy in real-time, traders typically backtest it with historical data to understand its performance under different market conditions. Then, when transitioning from backtesting to live trading, they forward test with a demo account to refine their strategy without risking real money.
Beware of False Signals
Moving average crossovers in choppy markets can generate false signals. Consider additional filters, such as trend confirmation from the ADX, to avoid whipsaws.
Following these best practices can help you effectively incorporate moving averages into your trading strategies, whether you're using a moving average crossover strategy or an EMA trading strategy.
The Bottom Line
Advanced moving average strategies can offer a route to potentially enhance your trading analysis and performance. As always, it’s best to experiment with different indicators and backtest strategies to find what works best. To start implementing these strategies, consider opening an FXOpen account. Use our robust tools and enjoy low commissions and tight spreads from 0.0 pips.
FAQs
How to Use Moving Averages?
Moving averages smooth out price data, helping to identify trends and potential support/resistance levels. Traders often use moving averages to determine trend direction, confirm breakouts, and identify reversals. Combining short-term and long-term moving averages provides a well-rounded market overview. For instance, a simple SMA strategy might see a trader watch for a crossover between a pair of long and short-term SMAs before entering.
What Is the Simple Moving Average?
The Simple Moving Average represents an asset’s average price over a specified period. It's a fundamental tool in trading, smoothing out fluctuations to highlight the underlying trend. An SMA trading strategy typically involves comparing SMAs of different lengths to identify crossovers and trend changes.
What Does EMA Stand For in Trading?
The EMA stands for the Exponential Moving Average. Unlike the SMA, the EMA gives more weight to recent prices, making it more responsive to price changes. This responsiveness makes the EMA popular in strategies that require quick reaction to market movements, such as an EMA crossover strategy.
What Moving Average Should Be Used for Day Trading?
In moving averages for day trading, shorter periods like the 9 or 21 are often used due to their responsiveness to recent price changes. These shorter EMAs help day traders quickly identify trend direction and potential entry/exit points.
This article represents the opinion of the Companies operating under the FXOpen brand only. It is not to be construed as an offer, solicitation, or recommendation with respect to products and services provided by the Companies operating under the FXOpen brand, nor is it to be considered financial advice.

Short StacksShort this Little puppy.
might go up Slightly to one of the above two moving averages
The stock Lost momentum, and should continue to fall along the general trajectory of the moving averages
i am Expecting Disappointing Earnings, on September 4th, to be Exact.

Big Runner - Running'Big Runner' - This pine script strategy is available in my scripts section and is fully open source, here it is performing algorithmic trades on SPX 4hour timeframe.
This strategy works seamlessly with any instrument, showing visuals on the chart for moving averages and ribbons to execute Long and Short trades.
I'm working to update it's script to further improve its use case.
