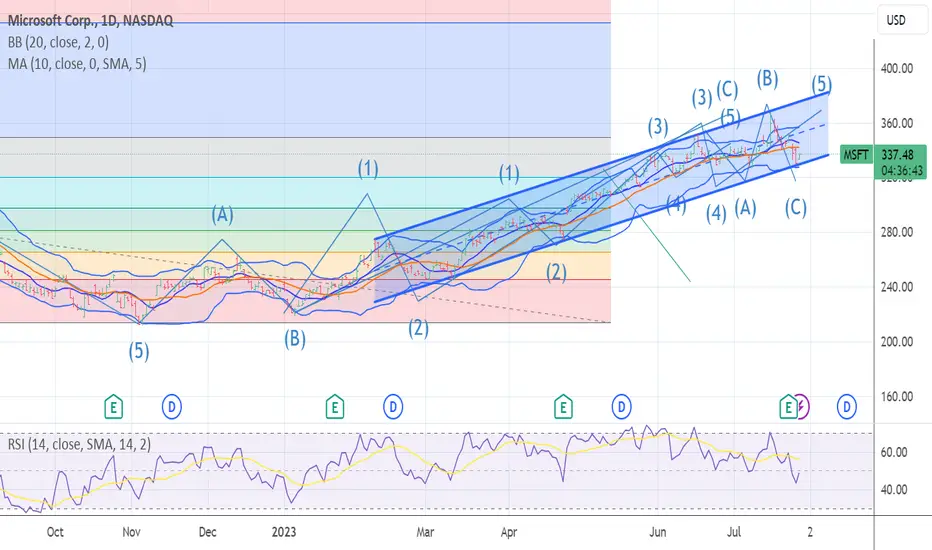
MSFT NO CHANGE IN TARGET381/383The chart posted is MSFT and I had stated that the peak would be 361 area we saw a 366 print this is 1.147 x the drop from 2021 peak to the low nov 2022 212 area . I see this has an abc flat to end a wave 4 from which we should rally to 381/383 in wave 5 of wave B 1.236 =target 381 1.27 is 383.9 so now you have the targets for the last part of the puzzle . I am long calls from 327.9 and 329
Microsoft (MSFT)

DBL TOP on MSFT? Waaaat! Long Term chart. #MSFT This double top on MSFT screams downside for the Stock Market in August, don't it? July 31st 2023. Levels = From 335 down to 320 316 off 21 SMA. 21 SMA bounce right here??

Microsoft Challenges Fib 3.618 levelMicrosoft - NASDAQ:MSFT
Expectations were beat across the board today but what does the long term monthly chart tell us? All is revealed in the chart. This is a key moment for NASDAQ:MSFT and a pull back or break through to established new highs wouldn't surprise. I'm happy to wait for the confirmations outlined in the chart. That MACD cross though looks appealing.
Earnings Summary
- Profits jumped 20% to 20.1 b
- EPS: $2.69 / Exp $2.56
- Revenue: $56.19B / Exp $55.49B
- Azure (cloud) revenue up 26% / Exp 27%

Natural Gas & SPY QQQ & 7 MEGA Cap Tech Stocks Analysisinside bar for stock market thursday low and high is key for me which way we break

MSFT WAVE 5 of 5 has started target 381/383The chart posted is that of MSFT we have now formed a nice ABC decline after hitting the top of the weekly BB bands . we now very over sold and I have moved back into CALLS in msft today at the open . LOOK for msft to rally to 381/383 this should now most likely bring the sp to 4631/4658 and the QQQ to 388/393 I tend to lead toward 391.3


MICROSOFT Huge MACD Bearish Cross ahead of earnings. Still buy?Microsoft (MSFT) has been trading within a Channel Up pattern since the March 13 Low, with the 1D MA50 (blue trend-line) supporting all the way, having made no contact with the price at all. You can see that on the chart on the right (1D time-frame).
On the bigger picture, the 1W time-frame (chart on the left), the stock closed last week's 1W candle on a very discouraging Bearish Pin Bar, which is a candle formed on technical trend reversals from bullish to bearish. In addition the 1W RSI remains overbought above 70.00, despite dropping from the even higher levels of May 30.
Perhaps the strongest alarming indicator at the moment showing that the market may have hit a temporary top is the emerging Bearish Cross on the 1W MACD. Since 2020, we have seen that formation another 7 times, with 6 of them delivering a Lower Low. As a result when the 1W MACD Bearish Cross is completed, it will be more probable to see a correction, not necessarily an earth shuttering one.
But back to the 1D time-frame (chart on the right) if that happens, we will wait for a candle close below the 1D MA50 and sell, targeting the 1D MA200 (orange trend-line) on a projected contact at $300. Until this happens though, the Channel Up is on full effect and we are targeting the Internal Higher Highs trend-line at $380.
In the meantime, observe the 1D RSI, which is trading inside a Rectangle for the past 6 months and has offered accurate buy signals at its bottom and sell signals at its top.
-------------------------------------------------------------------------------
** Please LIKE 👍, FOLLOW ✅, SHARE 🙌 and COMMENT ✍ if you enjoy this idea! Also share your ideas and charts in the comments section below! **
-------------------------------------------------------------------------------
💸💸💸💸💸💸
👇 👇 👇 👇 👇 👇

$MSFT #Microsoft Earning PlayNASDAQ:MSFT #Microsoft Earning Play if you have been long NASDAQ:MSFT like we have it is prudent to take profits or if you are in the business of shorting stocks this is an excellent shorting opportunity. Know your target before you make the trade. There is a Double Top where you can stop out if it closes above the double top on a weekly basis.

MICROSOFT'S Fiscal 2023 Q4 Results: Assessing Growth and....Microsoft's Fiscal 2023 Q4 Results: Assessing Growth and Profitability
Investors are eagerly anticipating Microsoft's fiscal 2023 fourth-quarter results, set to be unveiled on July 25. The upcoming report holds significance as it is expected to include the company's outlook for fiscal year 2024, making it a crucial event for evaluating Microsoft's growth opportunities, profitability, and cash demand trends.
When considering Microsoft as an investment, three key factors set it apart from others.
Diverse Business:
Microsoft's strength lies in its diverse business offerings. Unlike companies that focus on specific industries or technologies, Microsoft provides exposure to various growth niches, including enterprise cloud services, AI, productivity software, and more. Owning Microsoft allows investors to capitalize on multiple expansion opportunities under one brand, thereby reducing the risks associated with heavy reliance on a single sector.
High Profitability:
Despite some fluctuations in financial metrics since the peak of the pandemic in 2021 and early 2022, Microsoft remains one of the most efficient generators of cash and profits in the market. In the last quarter, the company achieved an impressive 15% year-over-year increase in operating income, resulting in $22.4 billion in profit on $53 billion in sales. This high level of profitability reinforces Microsoft's position as a robust and stable investment option.
As the report is released, investors should focus on these essential growth indicators and look beyond short-term sales volatility to assess Microsoft's long-term potential. The company's diverse business and strong profitability make it an attractive investment opportunity for those seeking stability and growth in their portfolio.
Pricey Stock:
In terms of valuation, Microsoft is considered a pricey stock, with investors having to pay a premium for its valuable assets. Presently, Microsoft stock is valued at over 12 times its annual sales, comparable to the faster-growing Palo Alto Networks. However, in comparison, Apple offers a relatively better bargain with a valuation of 8 times its sales, while Amazon is even cheaper at less than 3 times its sales.
While there is a possibility that Microsoft's valuation may decrease in the coming quarters, particularly if the company reports disappointing sales results in late July or forecasts challenges in the upcoming operational year, the more likely scenario is that the business will continue to gain market share in various significant global tech industries. Additionally, any cyclical downturn in its operating system segment or consumer tech devices division is expected to be short-lived.
Considering Microsoft's bright long-term outlook, industry-leading profit margins, ample cash flow, and rising dividend payments, it emerges as an incredibly attractive stock to consider adding to your portfolio. For tech stock investors who prefer a less risky approach in a fast-moving industry, Microsoft provides an excellent opportunity to gain exposure to major trends while investing in one of the most valuable companies in the world.

Golden ticket go to next stop $740Weekly chart
MicroStrategy NASDAQ:MSTR has broken up descending trend line and now it's pulling back to the support around $380
It's time to get in and go to next stop
Wait a confirmation around the support

NQ Weekly Lower High?If you remember from back in October 22' - The economic news media was on full panic mode. If you only listened to them, you would have been closing positions and preparing for more downside. Smart money did the opposite at that time. 1-5 Elliot Wave is something I had posted during the Oct 22' lows, expecting large demand at those levels.
Now we are almost a year into the future, and about 40% higher from the lows created last year. The economic news media is calling for ATH's, soft landings and it seems hard to believe. Another interest rate hike is right around the corner on Wednesday with 98% certainty, along with mega cap tech stocks earnings.
Do we form a lower high? Not sure, but it would really start to look good for people selling options moving into the bloody months of Sept and August. A move lower from these levels is starting to get more and more probable, and at some point, every bear is right. I am not a perma bear, I just believe that some mega cap stocks (NVDA) are completely disconnected from reality and a correction to some big names could leak into other tech stocks. Be prepared, and good luck.
Thanks,

7 MEGA Cap Tech & QQQ SPY Analysis- GOOGL MSFT ER Tuesday AH
- META ER Wednesday AH
- Many Big names starting to weaken

Daily Market Analysis - MONDAY JULY 24, 2023Key News:
UK - S&P Global/CIPS UK Manufacturing PMI
USA - S&P Global US Services PMI (Jul)
The Dow Jones Industrial Average celebrated a remarkable milestone on Friday, securing its 10th consecutive weekly gain and extending its longest winning streak since 2017. However, the market's positive performance was tempered by cautiousness among traders ahead of the upcoming quarterly results from major tech companies.
The Dow managed a marginal increase of 0.01%, equivalent to a mere 3 points, which might seem modest, but it's significant given the index's prolonged daily winning streak, last witnessed on August 7, 2017. The primary force behind the Dow's recent success lies in the gains made by defensive sectors, particularly utilities, which have helped bolster overall market sentiment.
In contrast, the Nasdaq experienced a slight decline of 0.2%, while the broader S&P 500 index edged up by 0.1%, showcasing a mixed performance across the board.
Traders remained watchful and exercised caution as they eagerly await the upcoming quarterly reports from major tech companies. These reports could have a considerable impact on market dynamics, influencing the direction of future trades and investor sentiment.
NASDAQ indices daily chart
DJI indices daily chart
S&P500 indices daily chart
As the new week kicked off, gold prices experienced a slight dip as investors exercised caution ahead of a highly anticipated Federal Reserve meeting. Meanwhile, copper prices faced significant losses, primarily driven by concerns surrounding weakening demand in China.
The metal market witnessed additional pressures with the dollar staging a recovery. The greenback strengthened, moving away from the 15-month lows it had reached earlier in July.
These developments have created a sense of uncertainty and wariness among investors, who are closely monitoring the upcoming Federal Reserve meeting for any signals that could impact the precious metals and copper markets. The performance of the dollar is also being closely scrutinized, as its strength or weakness can have substantial implications for metal prices and global trade dynamics.
In light of the prevailing economic uncertainties, market participants are treading carefully and making informed decisions as they navigate through this crucial week, where the outcomes of central bank policies and macroeconomic indicators are expected to shape market trends in the near term.
XAU/USD daily chart
The spotlight in recent market activity has been firmly fixed on the Federal Reserve's forthcoming decision on interest rates, set to be revealed at the conclusion of a two-day meeting on Wednesday. The prevailing consensus among investors is that the central bank will opt to raise interest rates by 25 basis points.
Nevertheless, there exists a strong belief among market participants that the Federal Reserve might also indicate a pause in future rate hikes. With the central bank nearing the conclusion of its nearly 16-month-long rate hike cycle, such a stance could signal a potential break from the previous trend of steady increases in interest rates.
This prospect of an extended pause in rate hikes has caught the attention of investors, particularly in relation to the impact on the precious metal market, notably gold. Historically, rising interest rates tend to elevate the opportunity cost of investing in gold, as higher rates make alternative assets more appealing for yield-seeking investors. Conversely, if the Federal Reserve hints at a pause or slower pace of future rate increases, it could potentially be favorable for gold, as it reduces the opportunity cost of holding the precious metal compared to other interest-bearing assets.
As the markets eagerly await the Fed's decision and the accompanying guidance, the implications for gold and other asset classes remain uncertain. The outcome of the meeting and the central bank's tone in their statements will undoubtedly have significant repercussions on investment strategies and market sentiment in the days to come.
EUR/USD daily chart
The dynamics in the EUR forward curve are undergoing a shift due to two essential factors. Firstly, foreign exchange traders are adjusting their pricing of lower US real rates in the long-term forwards after the recent Consumer Price Index (CPI) report. This indicates a realization that they may have been overly aggressive in their initial assessments. Secondly, the impact of ECB commentary on the Eurozone's economic data and inflation is likely to moderate, given the weaker economic indicators in the region.
The Bank of Japan's decision on maintaining its current interest rates is also a significant point of interest. With rates at 0% or in negative territory for an extended period, it is somewhat expected that they will continue with this stance.
China's 0% Consumer Price Index (CPI) rate is another crucial observation, as its potential spread could impact Japan first and have broader implications for global markets, particularly for stock markets and the future trajectory of the dollar. The actions and statements of these central banks will be closely watched by investors, as they could set the tone for market movements in the days to come.
On a different note, the US earnings season is entering a crucial phase this week, with major companies like Meta Platforms, Microsoft, and Alphabet preparing to release their reports. These earnings announcements are likely to have a significant impact on stock markets and investor sentiment.
As the week unfolds, investors will be navigating through these key developments in global monetary policies, inflation trends, and corporate earnings, which will undoubtedly shape market dynamics and future trading strategies.
MSFT stock daily chart
META stock daily chart
GOOG stock daily chart
Absolutely, the upcoming earnings results of major companies like Meta Platforms, Microsoft, and Alphabet are crucial in meeting market expectations and justifying the current valuation of the S&P 500. The current earnings multiple of 20 times and the substantial year-to-date gains of 19% in the index indicate high market optimism.
Investors will be closely scrutinizing these earnings reports to assess the health and potential direction of the market. Meeting or exceeding market expectations in these reports will likely be seen as a positive sign, reinforcing confidence in the ongoing market rally. On the other hand, any disappointments or weaker-than-expected results could raise concerns and potentially lead to market corrections.
Given the prevailing market conditions and the momentum in the S&P 500, investors are eager to ascertain the sustainability of the rally and whether the current valuations are justified by the underlying company fundamentals.
As the earnings season unfolds, the market sentiment will be heavily influenced by the performance of these major companies, as well as the guidance provided by their management teams.

QQQ SP500 7 Mega Cap Weekly time Frame Analysislots of weekly reversal patterns forming on these big names

Microsoft Long Alltime High hit Earnings New 52-week highs this week, powered by the Dow which, on Friday, extended its streak of positive days to ten — something the blue chip index has not done in almost six years. The Dow has been powered by, among other things, a slew of corporate financial results, particularly from the banks, which showed not only improved profitability, but also strong guidance for the next quarter and full year.
I have explained 2 bullish scenarios,1 bearish(worse case).
Bullish:
higher highs higher lows
poc uprising
volume increasing
capital flow rising
In case the Take profits hit, and we have increased volume, I will ride the trend.
I will only take profit 10% of the microsoft portfolio and let the profit run.
Exit :Stop loss or trend change signal
The mid and long term horizon is bullish. If any Profit taking level reaches, and trend continuation is signalizing that the uptrend will be continued, I will increase agressively my positions and take only 10% profits of each position.I will let the prfoits run.
This trade setup is only for trend followers and on daily TF.

MSFT Microsoft Options Ahead of Earnings ! Growth Thesis !If you haven`t bought MSFT when they Bought 49% Stake in OpenAI, creator of ChatGPT:
Or sold on their warning to investors:
Then analyzing the options chain and chart patterns of MSFT Microsoft prior to the earnings report this week,
I would consider purchasing the 345usd strike price Calls with
an expiration date of 2024-1-19,
for a premium of approximately $28.95.
If these options prove to be profitable prior to the earnings release, I would sell at least half of them.
The investment by Microsoft in OpenAI signifies a significant boost to their artificial intelligence capabilities. OpenAI's advanced technologies and expertise in AI research and development could potentially enhance the capabilities of Microsoft's Bing search engine. With access to powerful AI algorithms and resources, Bing may be able to offer more personalized and accurate search results, thereby attracting users who seek a more refined search experience.
Microsoft has been making strategic moves to expand its presence in various sectors, including cloud computing and enterprise services. By integrating Bing into its ecosystem of products and services, Microsoft can leverage its existing user base and partnerships to promote Bing as a viable alternative to Google.
In recent years, Google has faced scrutiny over data privacy concerns and antitrust issues, which could create an opportunity for Bing to gain traction among users seeking more privacy-focused alternatives. Additionally, Microsoft has been actively investing in marketing and advertising efforts to raise awareness about Bing and improve its market positioning.
While Google currently holds a dominant position in the search engine market, the landscape is dynamic and subject to change. If Microsoft successfully leverages its partnership with OpenAI to enhance Bing's capabilities, coupled with strategic marketing initiatives, it could potentially chip away at Google's market share over time.
The implementation, by Microsoft, of a chatbot like ChatGPT, powered by OpenAI's advanced natural language processing capabilities, could indeed provide an opportunity for consumers to find the cheapest price online for the same product. In an era where price comparison and cost-saving measures are highly valued by customers, this feature could be a valuable asset for Bing.
Amazon's reputation for having expensive and overvalued prices has been a topic of discussion among consumers. While Amazon provides a wide range of products and convenient shopping experiences, some users have expressed concerns about the pricing competitiveness on the platform. This presents an opening for Bing to attract cost-conscious consumers who are actively seeking better deals.
The concern over the origin of products, particularly those manufactured in China, has gained attention in recent years. Some consumers prefer to avoid purchasing Chinese-made products due to quality, safety, or political reasons. If Bing can provide a search experience that allows users to filter or identify the origin of products more effectively, it could cater to a segment of consumers who prioritize alternative sourcing.
I think MSFT will be one of the winners of the AI race.
Looking forward to read your opinion about it.

Pt 2 of 7 Mega Cap Tech stocks | QQQ SPY Analysis- GOOGL MSFT ER Tuesday AH
- META ER Wednesday AH
lots of big techs shaping up enough room from its drop to shape up a daily downtrend now we will see how earnings come in to see if it shapes up.

Pt 1 of 7 Mega Cap Tech stocks | QQQ SPY Analysis- GOOGL MSFT ER Tuesday AH
- META ER Wednesday AH
lots of big techs shaping up enough room from its drop to shape up a daily downtrend now we will see how earnings come in to see if it shapes up.

Part 2 of 7 Mega cap Tech stocks | QQQ Sp500 AnalysisHourly downtrends confirm on all mega cap tech and QQQ/ SPY
will see if bears are serious about confirming daily and 4h downtrend in the next couple trading days.

Part 1 of 7 Mega cap Tech stocks | QQQ Sp500 AnalysisHourly downtrends confirm on all mega cap tech and QQQ/ SPY
will see if bears are serious about confirming daily and 4h downtrend in the next couple trading days.

MSFT suppressed by the 3.000 level of the golden sectionMSFT suppressed by the 3.000 level of the golden section
This chart shows the weekly candle chart of Microsoft stock in the past two years. The graph overlays the low point at the end of October 2022 against the golden section. As shown in the figure, Microsoft's stock has reached another new high this week, breaking through the highest point at the end of 2021! But the weekly pattern of Microsoft stock this week is a long shadow line, with the highest point precisely suppressed by the 3.000 level of the golden section in the figure! Based on last week's weekly pattern, Microsoft's stock market is likely to enter a contraction triangle consolidation state in the future!

QQQ: Looking Out for a 20-40% Pull BackThe NASDAQ100 is currently sitting at the 0.886 and 1.618 PCZs of big Bearish Shark and Bearish Butterfly patterns as the indicators hover around the overbought zones; we don't exactly have much confirmation yet that these PCZs will hold, but it seems like it wouldn't be a bad idea to position against the QQQ early on via some SQQQ monthly calls and perhaps getting Bearish on some of the top stocks within the index such as NVDA, TSLA, and MSFT.
Being conservative, I will only be looking for it to come back to the common Fibonacci Retracement zones below, but it's also possible that this ends up being a macro top; for the time being, that doesn't really matter because as of right now, it looks quite Bearish.
On a side note, the VIX also looks like it's been preparing to spike up for a few months now and the targets for such a spike are pretty massive, as seen here:
