MSFT possible pullbackHere is a possible pullback considering possible prices of resistance including the lowest price of an old candle, the 50% of the fibonacci retracement (where retracements are more likely to happen). The price already hit the zone but it is common for the price to come back up before the day end. Furthermore, the 50% fibonacci retracement also happens with the weekly timeframe. The risk/reward ratio do not consider the current trend, therefore it is better to maybe take out the TP to see how far the price might go down.
Microsoft (MSFT)

MSFT Potential for Bearish Momentum | 26th September 2022On H4, with the price moving within the descending channel and below ichimoku cloud , we have a bearish bias that the price may drop from the sell entry at 236.25, which is in line with the 78.6% fibonacci projection to the take profit at 208.8, where the 78.6% fibonacci projection is. Alternatively, the price may rise to the stop loss at 252.14, which is in line with the 23.6% fibonacci retracement .
Any opinions, news, research, analyses, prices, other information, or links to third-party sites contained on this website are provided on an "as-is" basis, as general market commentary, and do not constitute investment advice. The market commentary has not been prepared in accordance with legal requirements designed to promote the independence of investment research, and it is therefore not subject to any prohibition on dealing ahead of dissemination. Although this commentary is not produced by an independent source, FXCM takes all sufficient steps to eliminate or prevent any conflicts of interest arising out of the production and dissemination of this communication. The employees of FXCM commit to acting in the clients' best interests and represent their views without misleading, deceiving, or otherwise impairing the clients' ability to make informed investment decisions. For more information about the FXCM's internal organizational and administrative arrangements for the prevention of conflicts, please refer to the Firms' Managing Conflicts Policy. Please ensure that you read and understand our Full Disclaimer and Liability provision concerning the foregoing Information, which can be accessed on the website.

NASDAQ decision time soonusing Nasdaq futures to monitor the long term trendline from 1999 till now... we violently broke the trend in 2008, but bounced beautifully in 2018/2020 and I think we soon get a decision on how price will act this time around... it should also let us know what to expect for tech valuations in the coming months/year!

MSFT Potential for Bearish Momentum | 26th September 2022On H4, with the price moving within the descending channel and below ichimoku cloud, we have a bearish bias that the price may drop from the sell entry at 236.25, which is in line with the 78.6% fibonacci projection to the take profit at 208.8, where the 78.6% fibonacci projection is. Alternatively, the price may rise to the stop loss at 252.14, which is in line with the 23.6% fibonacci retracement.
Any opinions, news, research, analyses, prices, other information, or links to third-party sites contained on this website are provided on an "as-is" basis, as general market commentary, and do not constitute investment advice. The market commentary has not been prepared in accordance with legal requirements designed to promote the independence of investment research, and it is therefore not subject to any prohibition on dealing ahead of dissemination. Although this commentary is not produced by an independent source, FXCM takes all sufficient steps to eliminate or prevent any conflicts of interest arising out of the production and dissemination of this communication. The employees of FXCM commit to acting in the clients' best interests and represent their views without misleading, deceiving, or otherwise impairing the clients' ability to make informed investment decisions. For more information about the FXCM's internal organizational and administrative arrangements for the prevention of conflicts, please refer to the Firms' Managing Conflicts Policy. Please ensure that you read and understand our Full Disclaimer and Liability provision concerning the foregoing Information, which can be accessed on the website.

$MSFT: Monthly trend could reverse...1st time this happens ever since the trend turned bullish in 2012 for $MSFT. By the end of the month, we will get confirmation of a potential bear market trend starting to gain traction here.
Investors had a tremendous 10 year run ever since but it appears to be over.
Best of luck!
Ivan Labrie.

Beginning of an End (Update on Uber 3)Uber is at the peak of driver's dissatisfaction. Will bribery rescue it once again? No.
It is beside the company's debts and cyber security weakness.
It got no future...

𝗧𝗲𝘀𝗹𝗮 𝗨𝗽𝗱𝗮𝘁𝗲: $TSLA Daily. Bearish Divergence Blue pill or red pill? 💊 First time with bearish divergence on the daily in ~2 years
$QQQ $NQ_F $NDX $AAPL $MSFT $SOX $ES_F $SPY $SPX $TLT $TNX $VIX #Stocks 📉

MICROSOFT ACCUMULATION AREAMICROSOFT ACCUMULATION AREA, long-term
1ST entry 2022 possible 2nd entry 2023

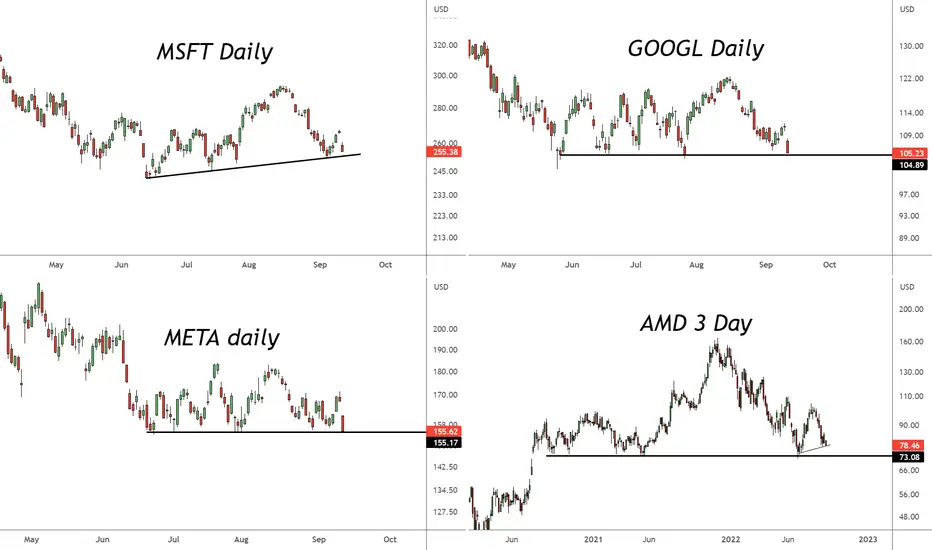
Big Tech - Head & Shoulder Pattern Galore These four big tech stocks are on thin ice.
A break of these necklines suggests more downside. These levels likely indicate around 11,900 on the Nasdaq as the line in the sand.
Question is, does this lead to capitulation or a longer duration downtrend. TBD...
Nasdaq 11,900 level = red line
MSFT: Head, shoulders, knees and toesMicrosoft has painted a head & shoulders formation, and is on track to confirm a neckline break on the daily and weekly timeframes. Expect a continuation of the downtrend on this neckline break, as well as further index weakness given MSFT's tremendous weight in the indices.
Notes:
Confirmation still required on neckline break, a wick below is insufficient.
Weekly closure above the neckline will invalidate the pattern.

𝗡𝗮𝘀𝗱𝗮𝗾 𝗨𝗽𝗱𝗮𝘁𝗲: $QQQ Daily. 🐂 trap + wave 3𝗡𝗮𝘀Got a 🐂 trap above the 200dma to complete B wave. As I've stated, we appear to be in a wave 3 on a few time frames. 300 the pivot
$NQ_F $NDX $AAPL $MSFT $SOX $ES_F $SPY $SPX $TLT $TNX $VIX #Stocks 📉

MSFTHELLO GUYS THIS MY IDEA 💡ABOUT MSFT is nice to see strong volume area....
Where is lot of contract accumulated..
I thing that the buyers from this area will be defend this long position..
and when the price come back to this area, strong buyers will be push up the market again..
UPTREND + Support from the past + Strong volume area is my mainly reason for this long trade..
IF you like my work please like share and follow thanks
TURTLE TRADER 🐢

$MSFT up to no goodMSFT is in a massive downtrend, broke below the volume shelf and also broke the short term trendline. $240 seems plausible.

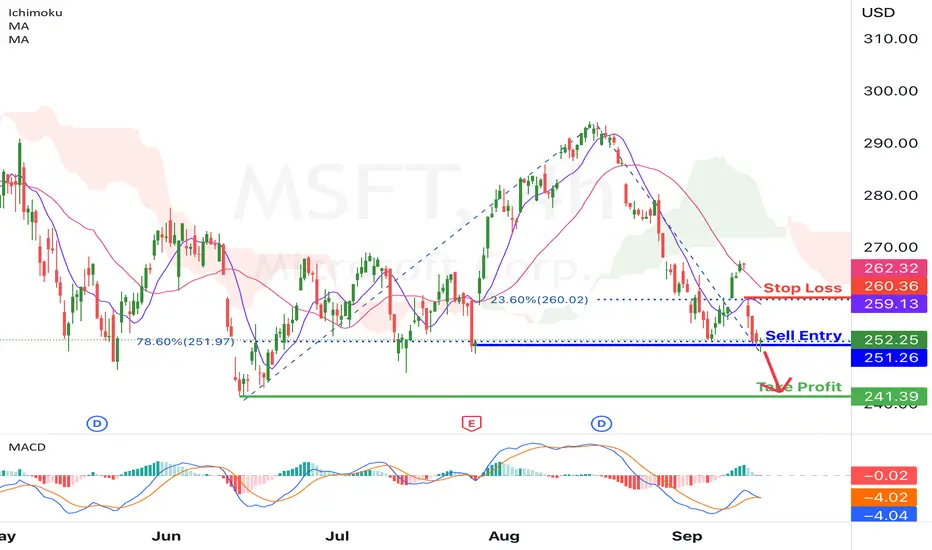
MSFT Potential for Bearish Continuation| 15th September 2022On H4, with the price moving below the ichimoku cloud and MACD is showing a death cross, as well as the MA 30 is above MA10, we have a bearish bias that the price may drop from the sell entry at 251.26, which is in line with the swing lows and 78.6% fibonacci retracement to the take profit at 241.39, where the previous swing low is. Alternatively, the price may rise to the stop loss at 260.36, where the 23.6% fibonacci retracement is.
Any opinions, news, research, analyses, prices, other information, or links to third-party sites contained on this website are provided on an "as-is" basis, as general market commentary, and do not constitute investment advice. The market commentary has not been prepared in accordance with legal requirements designed to promote the independence of investment research, and it is therefore not subject to any prohibition on dealing ahead of dissemination. Although this commentary is not produced by an independent source, FXCM takes all sufficient steps to eliminate or prevent any conflicts of interest arising out of the production and dissemination of this communication. The employees of FXCM commit to acting in the clients' best interests and represent their views without misleading, deceiving, or otherwise impairing the clients' ability to make informed investment decisions. For more information about the FXCM's internal organizational and administrative arrangements for the prevention of conflicts, please refer to the Firms' Managing Conflicts Policy. Please ensure that you read and understand our Full Disclaimer and Liability provision concerning the foregoing Information, which can be accessed on the website.

MSFT Potential for Bearish Drop | 9th Sept 2022On H4, with the price moving below the ichimoku cloud and descending trend line, we have a bearish bias that the price may drop from the sell entry at 255.76, where the previous swing low is to the take profit at 249.68, which is in line with the significant swing lows. Alternatively, the price may rise to the stop loss at 261.73, where the 23.6% fibonacci retracement is.
Any opinions, news, research, analyses, prices, other information, or links to third-party sites contained on this website are provided on an "as-is" basis, as general market commentary, and do not constitute investment advice. The market commentary has not been prepared in accordance with legal requirements designed to promote the independence of investment research, and it is therefore not subject to any prohibition on dealing ahead of dissemination. Although this commentary is not produced by an independent source, FXCM takes all sufficient steps to eliminate or prevent any conflicts of interest arising out of the production and dissemination of this communication. The employees of FXCM commit to acting in the clients' best interests and represent their views without misleading, deceiving, or otherwise impairing the clients' ability to make informed investment decisions. For more information about the FXCM's internal organizational and administrative arrangements for the prevention of conflicts, please refer to the Firms' Managing Conflicts Policy. Please ensure that you read and understand our Full Disclaimer and Liability provision concerning the foregoing Information, which can be accessed on the website.

MSFT - Short position When looking at MSFT current underlying value and most recent price behaviour when using a 2-hour range, investors can see that on the 02/09/22 a three-bar pattern formed making up a shooting star. In this instance, this was a bareish indication, a failed attempt to correct the underlying stock value´s bearish momentum with bullish momentum.
When observing 50 and 100 day ranged EMA averages investors can see that on the 26/08/22 shorter 50-day EMA moving average crossed beneath the longer 100-day EMA moving average. This dead cross was followed by a strong down trend, underlying prices falling 7%. This was after bullish rallies that were witnessed since mid-July. On 27/07/22 shorter 50-day EMA moving average crossed above longer 100-day EMA moving average. This fresh bullish crossover was followed by a rally that saw the underlying share value continue to increase over 10%. Currently EMA moving average lines are not moving back towards one another, instead they are moving parallel in a different trajectory. Therefore, the down trend is more likely to strengthen before corrections occur.
When observing MACD and signal lines, investors can see that 06/09/22 the MACD line crossed beneath the signal line. This further supports our bearish sentiment.
Based on EMA moving averages, candlestick patterns and behaviour as well as MACD and signal lines, we are bareish in sentiment. We anticipate that the stock will fall further and have taken a short position as a result.

SPYCurrent bounce spot is here.. 388-390 is that level. Sell through it and we see plentiful more downside to come on it.
Would think 406 is still possible to the upside if it can get bought up although I'm not buying this myself.

MSFTShortest short short short
230 and 215 support lvls are to watch. Tech breaking down with yields shooting up. SPY currently at bounce zone though so i'm currently indecisive, lets see what Powell has in store for us..

MSFT Potential for Bearish Continuation| 6th September 2022On H4, with the price crossing the ichimoku cloud , within the descending channel and DIF line is below zero axis, we have a bearish bias that the price may drop from the sell entry at 251.96, which is in line with the 78.6% fibonacci retracement to the take profit at 240.90, where the swing low is. Alternatively, the price may rise to the stop loss at 265.50, which is in line with the 23.6% fibonacci retracement .
Any opinions, news, research, analyses, prices, other information, or links to third-party sites contained on this website are provided on an "as-is" basis, as general market commentary, and do not constitute investment advice. The market commentary has not been prepared in accordance with legal requirements designed to promote the independence of investment research, and it is therefore not subject to any prohibition on dealing ahead of dissemination. Although this commentary is not produced by an independent source, FXCM takes all sufficient steps to eliminate or prevent any conflicts of interest arising out of the production and dissemination of this communication. The employees of FXCM commit to acting in the clients' best interests and represent their views without misleading, deceiving, or otherwise impairing the clients' ability to make informed investment decisions. For more information about the FXCM's internal organizational and administrative arrangements for the prevention of conflicts, please refer to the Firms' Managing Conflicts Policy. Please ensure that you read and understand our Full Disclaimer and Liability provision concerning the foregoing Information, which can be accessed on the website.

MSFT Potential for Bearish Continuation| 6th September 2022On H4, with the price crossing the ichimoku cloud, within the descending channel and DIF line is below zero axis, we have a bearish bias that the price may drop from the sell entry at 251.96, which is in line with the 78.6% fibonacci retracement to the take profit at 240.90, where the swing low is. Alternatively, the price may rise to the stop loss at 265.50, which is in line with the 23.6% fibonacci retracement.
Any opinions, news, research, analyses, prices, other information, or links to third-party sites contained on this website are provided on an "as-is" basis, as general market commentary, and do not constitute investment advice. The market commentary has not been prepared in accordance with legal requirements designed to promote the independence of investment research, and it is therefore not subject to any prohibition on dealing ahead of dissemination. Although this commentary is not produced by an independent source, FXCM takes all sufficient steps to eliminate or prevent any conflicts of interest arising out of the production and dissemination of this communication. The employees of FXCM commit to acting in the clients' best interests and represent their views without misleading, deceiving, or otherwise impairing the clients' ability to make informed investment decisions. For more information about the FXCM's internal organizational and administrative arrangements for the prevention of conflicts, please refer to the Firms' Managing Conflicts Policy. Please ensure that you read and understand our Full Disclaimer and Liability provision concerning the foregoing Information, which can be accessed on the website.

$MSFT - potential support in phase 4 $MSFT has been in selloff and it's been frequently discussed these days. If we break current level, there is not much demand down to $220 and $208, which would be about 36-40% down from ATH, respectively.
I can see MSFT getting there if overall market is wacky. Chaikin Oscillator with Bollinger bands also generated sell signal on August 8th and since then it's been in an ugly downtrend. This also looks like a phase 4 - downtrend.
I'll wait patiently and might start adding to my position around 220. Good old MSFT.

MSFTNot financial advice. The essence of investing & trading is the intelligent and patient preying on the greed, fear, impatience, addiction and ignorance of the majority. It's definitionally Darwinian.
