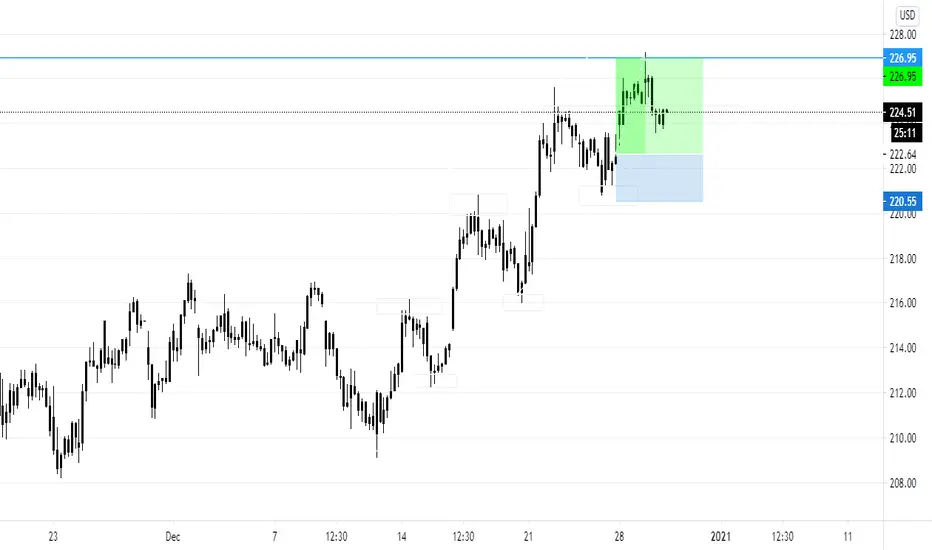
$MSFT Going for that gapMSFT printed today an inside day and has cooled off after a strong bounce since Friday. I am eyeing the top and bottom gaps as interesting levels, although I believe we will continue swinging towards that 1.618 fib level after the previous flag. Indicators are taking a breather, but if CPI numbers are good and TNX stays low, we could see a stronger tech rally now that many stocks, like MSFT, are decently positioned to continue this trend.
Msftlong


$MSFT Microsoft Weekly Chart. looks good. Price target $275Weekly Chart. looks good.
Price target $275
Stop Channel break.


Microsoft Long PositionThis is NOT financial advice
Merely utilizing Technical analysis for opportunities in the market .
So following the news with Bill and Melinda gates divorcing we see a clear SELL THE NEWS tactic in order to sell at the top and buy the dips approaching a key Point of Support .
The daily Timeframe shows that although price is dropping it is still on an uptrend overall. Which means we are going LONG
Microsoft is on track to reverse off of the 50% retracement off of our Fibonacci extension with 2 confident positions for a LONG TERM HOLD. This is Looking like a steal ,Family.

MSFT - 10.43% Profit Potential - Bullish PennantBullish Pennant formed after a modest 9-month rally.
Great risk-reward ratio and target set at a potential formation of a 1-year resistance line.
- Target Entry $252.04
- Target Stop Loss $246.36
- Target Exit 279.40
About me
- Note that I tend to adjust stop losses in order to secure profits early and preserve capital. This means that the target price is going to be achieved as long as there are no strong pullbacks that trigger my new adjusted stop loss
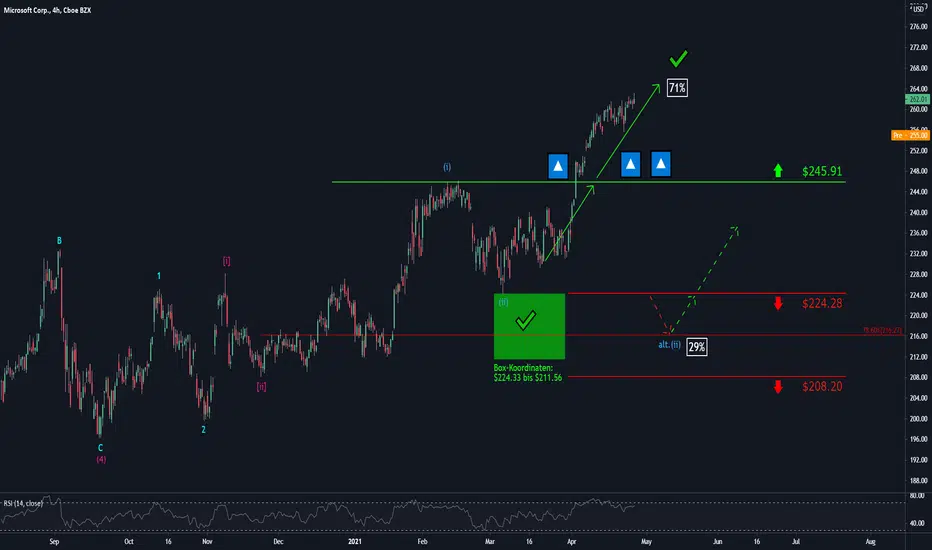
Microsoft: Reliable as it gets! 🙏🙏🙏Is there much to say about Microsoft? Not really, right?! Our technical analysis also reflects this, as we can see that the price is going to strongly increase after already crushing through the resistance at $245.91. From here, there is only one way: up!
Anything you would like us to analyze?
MSFT could continue the uptrendMSFT rise yesterday above the last resistance, so I expect an increase in the following days.

MSFT LongI think MSFT will break out of its bull flag and give us a 250 by June or before. It bounce of its Golden pocket on the fib and should retrace the length of the flag pole

MSFT Reversal Head and Shoulders- BullishAs you can see from the chart, MSFT broke out of a symmetrical triangle formation right around January 20th and enjoyed a very strong uptrend for about a month. We can see a clear break in this uptrend around February 18th just based on price action and we can also see that at this same time our fast EMA's quickly turned silver indicating a weakening of the uptrend. Since February 18th we can see that MSFT has formed a reversal head and shoulders pattern, with the head bouncing perfectly on the previous broken resistance line from the symmetrical triangle formation that it broke out of at the end of January (new support level). In addition to my T.A, I also have a strong price target for MSFT based on my fundamental analysis and believe $275-$300 price target is very possible.

MSFT 🌦Not sure howI feel about Microsoft. It Looks bullish; however, I don't think it will moon like other tech stocks.
***This does not constitute financial advice.***

TECHNICAL - GAP FILL - Microsoft $MSFTQuick Idea:
- Critical level for MSFT.
- Bulls need stopping volume to stop the island reversal drop.
- Gap will probably be filled, even if for dead cat bounce.
- At 234~ another decision point to confirm a downtrend

$MSFT TK cross PT $280 Heikin -AshiTK CROSS OVER CLOUD
BULLISH GREEN CLOUD
TRAILING LINE OVER PRICE ACTION
Would like entry here with tight stop or on a touch of base line.

Microsoft Long📈 NASDAQ:MSFT LONG H4
🛒Buy above = 245.52
🎯Target1 = 255.23
🎯Target2 = 261.2
🎯Target2 = 270.95
🛑Stop loss or cancel trade = 229.79

MSFT thoughtsIn a clear uptrend since inception
I wonder how these vital tech stocks will perform in comparison to cryptocurrencies this year
You need computers for cryptocurrency right? MSFT seems like a prime target
I would be long these tech stocks if I could find an easy and appealing investment tool for ones like this one


MSFT stock will increase! MSFT released the financial data on 26/01/2021, and as seen by far it had a increase more then expected. Eventually also by watching technical chart we can expect a growth in the next days! NASDAQ:MSFT

MSFT ladder entries for a long swing - safe signal MSFT about to breakout, we will go into long with ladder entries as follow:
1. $220 (20%)
2. $205 (30%)
3. $190 (50%)
average entry in case all entries hit will be $200.5
Target $244+

BUY 1/15 220c $MSFT - Entry 216.73, PT 219.70, SL 214 #options MSFT is hovering at both the 15 minute 200 MA, and the recent strong 216.5 resistance/support level for the past two months. A break here should see a run to 220 where there is bound to be serious resistance. I plan on entering this trade for January 14th, assuming the entry point breaks with reasonable volume and the market is doing well.

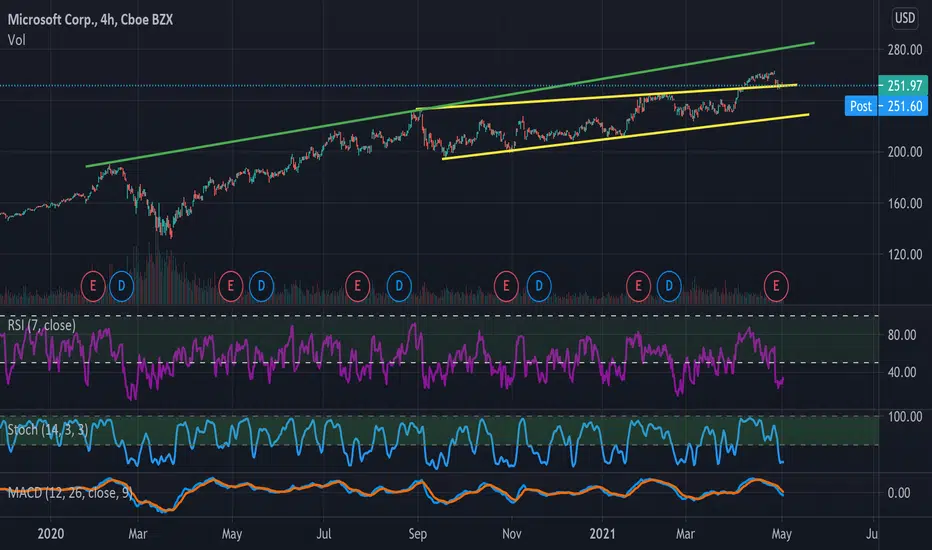
$MSFT 6-Month long formation. Microsoft has been seeing a lot of momentum towards the upside, while still holding intact a 6 months symmetrical triangle. I am waiting for another move through our (green) top ray, and to support upon our (blue) 224.49 level.