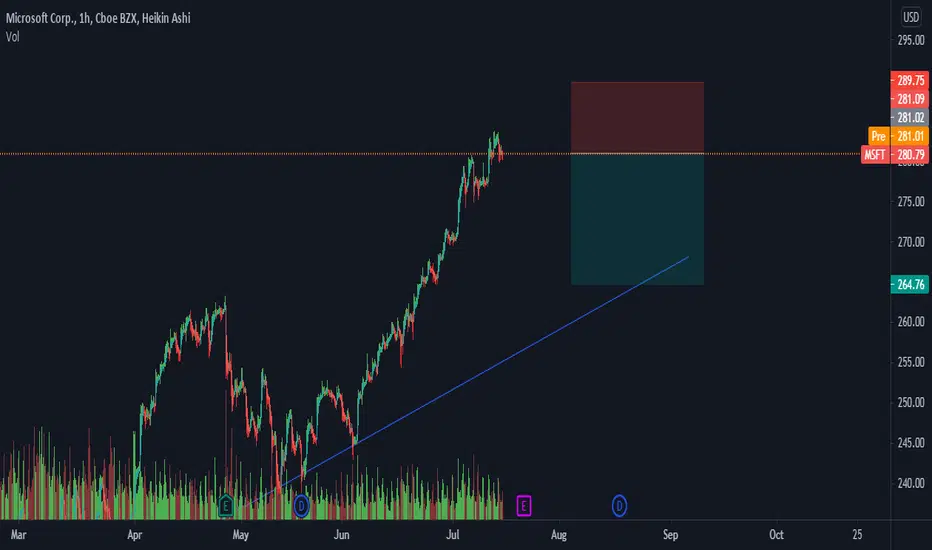
Microsoft (MSFT) | The safest target to climb📍Hello traders, Microsoft in daily timeframe , this analysis has been prepared in daily timeframe but has been published for a better view in 2 day timeframe.
The overall identity of this counted wave is unclear and we need more waves to detect it.
Now, according to the count, the main waves 1 and 2 have been formed and now we are inside wave 3.
This wave 3 has formed its wave 4 in such a way that it can not be said that it is complete or this ascent that we are considering is part of wave 4.
In terms of time, wave 4 is normal compared to wave 3.
Currently we are waiting for an ascending move that should be done before the 0.5 Fibo range and if this Fibo and the black channel are broken, this ascent will not take place.
🙏If you have an idea that helps me provide a better analysis, I will be happy to write in the comments🙏
❤️Please, support this idea with a like and comment!❤️
Msftstock

Microsoft: Trend Line ShortMicrosoft - Short Term - We look to Sell at 297.12 (stop at 305.71)
We look to sell rallies. We look to set shorts in early trade for a further test of the fragile looking support. Prices expected to stall near trend line resistance. The trend of lower highs is located at 302.00.
Our profit targets will be 261.14 and 254.00
Resistance: 300.00 / 310.00 / 320.00
Support: 270.00 / 260.00 / 240.00
Disclaimer – Saxo Bank Group. Please be reminded – you alone are responsible for your trading – both gains and losses. There is a very high degree of risk involved in trading. The technical analysis, like any and all indicators, strategies, columns, articles and other features accessible on/though this site (including those from Signal Centre) are for informational purposes only and should not be construed as investment advice by you. Such technical analysis are believed to be obtained from sources believed to be reliable, but not warrant their respective completeness or accuracy, or warrant any results from the use of the information. Your use of the technical analysis, as would also your use of any and all mentioned indicators, strategies, columns, articles and all other features, is entirely at your own risk and it is your sole responsibility to evaluate the accuracy, completeness and usefulness (including suitability) of the information. You should assess the risk of any trade with your financial adviser and make your own independent decision(s) regarding any tradable products which may be the subject matter of the technical analysis or any of the said indicators, strategies, columns, articles and all other features.
Please also be reminded that if despite the above, any of the said technical analysis (or any of the said indicators, strategies, columns, articles and other features accessible on/through this site) is found to be advisory or a recommendation; and not merely informational in nature, the same is in any event provided with the intention of being for general circulation and availability only. As such it is not intended to and does not form part of any offer or recommendation directed at you specifically, or have any regard to the investment objectives, financial situation or needs of yourself or any other specific person. Before committing to a trade or investment therefore, please seek advice from a financial or other professional adviser regarding the suitability of the product for you and (where available) read the relevant product offer/description documents, including the risk disclosures. If you do not wish to seek such financial advice, please still exercise your mind and consider carefully whether the product is suitable for you because you alone remain responsible for your trading – both gains and losses.

MSFT Microsoft W-shaped recoveryDan Ives from Wedbush Securities said that investors should focus on “oversold” tech stocks including Microsoft, Apple, Oracle, Adobe and Salesforce, “as well as core chip names ” and cybersecurity companies after Russia invaded Ukraine.
My target for MSFT is $312 for a W-shaped recovery.
Looking forward to read your opinion about it.

Microsoft: Buy at Crucial Support Microsoft - Short Term - We look to Buy at 279.24 (stop at 272.73)
Preferred trade is to buy on dips. A higher correction is expected. Previous support located at 280.00. 280.00 continues to hold back the bears. The bias is still for higher levels and we look for any dips to be limited.
Our profit targets will be 299.23 and 309.50
Resistance: 300.00 / 315.00 / 350.00
Support: 280.00 / 260.00 / 250.00
Disclaimer – Saxo Bank Group. Please be reminded – you alone are responsible for your trading – both gains and losses. There is a very high degree of risk involved in trading. The technical analysis, like any and all indicators, strategies, columns, articles and other features accessible on/though this site (including those from Signal Centre) are for informational purposes only and should not be construed as investment advice by you. Such technical analysis are believed to be obtained from sources believed to be reliable, but not warrant their respective completeness or accuracy, or warrant any results from the use of the information. Your use of the technical analysis, as would also your use of any and all mentioned indicators, strategies, columns, articles and all other features, is entirely at your own risk and it is your sole responsibility to evaluate the accuracy, completeness and usefulness (including suitability) of the information. You should assess the risk of any trade with your financial adviser and make your own independent decision(s) regarding any tradable products which may be the subject matter of the technical analysis or any of the said indicators, strategies, columns, articles and all other features.
Please also be reminded that if despite the above, any of the said technical analysis (or any of the said indicators, strategies, columns, articles and other features accessible on/through this site) is found to be advisory or a recommendation; and not merely informational in nature, the same is in any event provided with the intention of being for general circulation and availability only. As such it is not intended to and does not form part of any offer or recommendation directed at you specifically, or have any regard to the investment objectives, financial situation or needs of yourself or any other specific person. Before committing to a trade or investment therefore, please seek advice from a financial or other professional adviser regarding the suitability of the product for you and (where available) read the relevant product offer/description documents, including the risk disclosures. If you do not wish to seek such financial advice, please still exercise your mind and consider carefully whether the product is suitable for you because you alone remain responsible for your trading – both gains and losses.

Microsoft Analysis 26.01.2022Hello Traders,
welcome to this free and educational analysis.
I am going to explain where I think this asset is going to go over the next few days and weeks and where I would look for trading opportunities.
If you have any questions or suggestions which asset I should analyse tomorrow, please leave a comment below.
I will personally reply to every single comment!
If you enjoyed this analysis, I would definitely appreciate it, if you smash that like button and maybe consider following my channel.
Thank you for watching and I will see you tomorrow!

MSFT Microsoft TrendlineMicrosoft’s buyout of Activision Blizzard for $69 billion would be the largest tech deal of all time.
And Microsoft needs Activision to be a major gaming developer and metaverse competitor.
Microsoft is still in the bullish trendline before the earnings this week.
My price target is $331.
looking forward to read your opinion about it.

Microsoft Analysis 13.01.2022Hello Traders,
welcome to this free and educational analysis.
I am going to explain where I think this asset is going to go over the next few days and weeks and where I would look for trading opportunities.
If you have any questions or suggestions which asset I should analyse tomorrow, please leave a comment below.
I will personally reply to every single comment!
If you enjoyed this analysis, I would definitely appreciate it, if you smash that like button and maybe consider following my channel.
Thank you for watching and I will see you tomorrow!

I recommend MSFT for purchaseHello guys , according to my graphical analysis of microsoft , there is a high probability of an increase towards over 327$ in the next few days

Microsoft Analysis 20.12.2021Hello Traders,
welcome to this free and educational analysis.
I am going to explain where I think this asset is going to go over the next few days and weeks and where I would look for trading opportunities.
If you have any questions or suggestions which asset I should analyse tomorrow, please leave a comment below.
I will personally reply to every single comment!
If you enjoyed this analysis, I would definitely appreciate it, if you smash that like button and maybe consider following my channel.
Thank you for watching and I will see you tomorrow!

msft analysemsft now is in the résistance area in the range and there is no volume that give an opportunity for a break . so i think it will go down

Microsoft: It ain’t over! 🙌🙌🙌In our current analysis of the Microsoft stock, we have identified a turnaround area around $272.26. After reaching a low there, the stock should soar to new heights around $330.
Happy weekend!

Microsoft Analysis, The Bulls Are Not StoppingHello everyone, as we all know the market action discounts everything :)
_________________________________Make sure to Like and Follow if you like the idea_________________________________
The MSFT has been having a great year so far and the Bullish trend doesn't seem to be slowing down yet. over the year the trend has been going up and forming new support levels and it started after the fall that happened to the stock on February 13 2020.
MSFT is currently trading near its 52 week high, which is a good sign. The S&P500 Index however is also trading near new highs, which makes the performance in line with the market.
MSFT has an average volume of 21698600. This is a good sign as it is always nice to have a liquid stock.
Scenario for the market action :
The price has reached and brokeout all the daily resistance lines spreading from 301.42 to 304.71, a very strong movement for the stock today, If the bulls were able to keep this momentum up then the stock won't have any problem reaching the weekly resistance line located at 306.86 by the end of the week. but if the trend lost some short-term momentum then we will see the price drop a bit and sit near the 304.71 level for this week.
Technical indicators show :
1) The market is above the 5 10 20 50 100 and 200 MA and EMA (Strong Bullish sign)
2) The RSI is at 65.52 showing Great strength in the market. there is a possibility for a divergence to form soon as the market is showing but nothing too big yet
3) The ADX is at 30.53 showing that the market is trending, With a positive crossover between DI+ (28.33) and DI- (14.33)
Daily Support and Resistance :
support Resistance
1) 298.13 1) 301.42
2) 296.47 2) 303.05
3) 294.84 3) 304.71
Weekly Support and Resistance :
support Resistance
1) 293.34 1) 300.10
2) 290.98 2) 304.50
3) 286.58 3) 306.86
Fundamental point of view :
MSFT has a Return On Assets of 18.36%. This is amongst the best returns in the industry. The industry average is -4.59%. MSFT outperforms 96% of its industry peers, and the stock Profit Margin of 36.45% is amongst the best returns of the industry.
In addition to announcing a six-cent-per-share dividend increase, Microsoft announced a share buyback program. The company’s three-year dividend growth is over 31%, which is exceptional. And this is an example of a stock that is also making growth investors happy. Since the correction at the start of the Covid-19 pandemic, MSFT stock has seen its share price rise 102% as of this writing. The success of Microsoft Teams to facilitate the need for remote work as well as remote learning will likely continue to be a catalyst for some time. Analysts still foresee a nearly 10% upside for the stock from its current price at around $303 per share. According to marketbeat
This is my personal opinion done with technical analysis of the market price and research online from fundamental analysts for The Fundamental point of view, not financial advice.
If you have any questions please ask and have a great day !!
Thank you for reading.

MSFT Microsoft Price TargetMicrosoft Plans $60 Billion Share-Buyback Program and raised its quarterly dividend to 62 cents a share from 56 cents a share.
Based on the news and the bullish characteristics of the chart, my price target is 325usd before a pullback.

MICROSOFT Daily TIMEFRAMESNIPER STRATEGY
This magical strategy works like a clock on almost any charts
Although I have to say it can’t predict pullbacks, so I do not suggest this strategy for leverage trading.
It will not give you the whole wave like any other strategy out there but it will give you huge part of the wave.
The best timeframe for this strategy is Daily, Weekly and Monthly however it can work any timeframe above three minutes.
Start believing in this strategy because it will reward believers with huge profit.
There is a lot more about this strategy.
It can predict and also it can give you almost exact buy or sell time on the spot.
I am developing it even more so stay tuned and start to follow me for more signals and forecasts.

$MSFT Resistance Break $300 PT In Reach?video breakdown and up date on $MSFT after a nice break of resistance and retest of linear deviation

Microsoft - Daily Chart - Short ScenarioPlanning to take a Short if
1. Price moves against Resistance level ( upper blue line)
2. Price falls under Trendline (orange line)
3. Would also like to see the Gap (orange circle) beeing filled before breaking down
Target:
Strong Support level (lower blue line) - there is also a gap above it.
Dont forget:
- Watch your Risk management
- DYOR (Do-Your-Own-Research)
- This information / article is only for educational purporses and not a recommendation to buy or sell. I'm not a Financial Advisor.
Thanks for reading!
trader_se

$MSFT Healthy Pullback? Cyclical Movement Video update and breakdown on $MSFT
Holding that 285 level after earnings well.


$MSFT Earnings Season! $300 PT REMAINSUpdate video on $MSFT if you havent seen any of my previous videos on $MSFT it may be worth checking out.
Thank you for all the support

msft update microsoft still broke the highest but it's time to down , because the market it's saturation of buying
sell the market
MSTF 1H What Can Stop Microsoft's grow Supercycle?Today, we will look at the behavior of the share price of Microsoft Corporation on a global chart.
Patient investors have been gaining the position of Msft shares for 13 long years, and the price itself during this period was stuck in the consolidation of $20-37
However, look at the result: as of now, the share price has risen +1000% , and the super cycle of growth itself has been going on for 8 years.
Moreover, during this long super cycle of growth, there have not yet been significant corrections. The recent news that the Pentagon is breaking a $10 billion contract with Microsoft shook the share price down 1%, but the next day, Msft's share price updated its all-time high.
Even during the Covid market drop in February-March 2020, Msft shares fell by only -30% and left the price within the parabolic rally. For example, then the S&P500 fell by -35%, the DJI index -38%, and for example, the hypes TSLA shares by as much as -60%
By the way, yesterday we made an idea for TESLA, we invite you to view:
For ourselves, we set the bar for the growth of Msft shares to $349-350 , from where a long correction may begin. Of course, against the backdrop of such a powerful growth, it is hard to believe in such a deep correction, but it would be nice to test the strength of the top level of $60 per share for Microsoft
An alternative scenario is a breakout and consolidation of the price above $350 , then nothing will prevent the price from moving further with parabolic growth, and the zone of $825-880 per share of MicrosoftCorporation will wait from above

MICROSOFT records the highest value since inception New support and resistance , probability to correction but the trend remains up

$MSFT Looking For Support VIDEO UPDATEVideo update on $MSFT After we have a lower time frame support break of the ascending wedge.
More details within!
