$MSFT Support Bounce or Shoulder Building 6/14 (UPDATE)Update on last weeks video where we secured a bounce off support and a entrance into the gap. Looking into the potential cup and handle or even ascending triangle forming on the daily at $MSFT previous highs! Thank you for tuning in, and make sure to follow us for more breakdowns!
Msftstock

$MSFT Support Bounce or Shoulder Building 6/7We are in pivotal part of the market where investors or unsure and fear is aplenty. That being said I always trying to come at the market as a day trader and swing trader without being emotionally attached to a stock. I like certain stocks on fundamentals and will buy them again long term, but as a day trader I am only in search of weekly or monthly flings. Those profits go into long term accounts that are mostly sitting in cheap leaps or fundamentally sound stocks with long hedges.
All that being said we could see $MSFT go both ways, and until I see a break I'm not going to pretend that I know what i will do in a supply zone. I have received some flack for my "both ways recently" but during a time of great fear its better to leave your emotional bias at home and look at where things could get messy and be honest with yourself. Just some advice for those of you day trading and if you are in stocks long term, use that same approach to hedge yourself correctly.
Good luck !

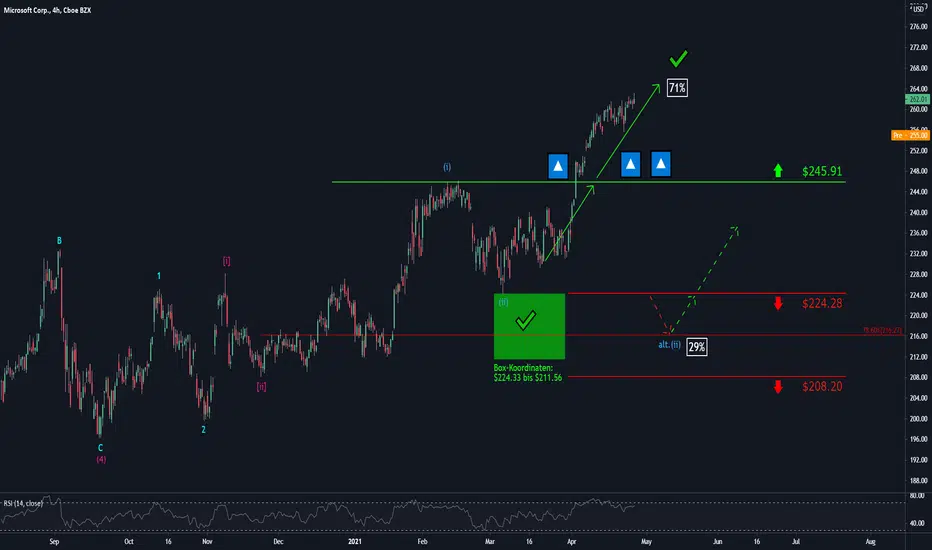
Microsoft: Reliable as it gets! 🙏🙏🙏Is there much to say about Microsoft? Not really, right?! Our technical analysis also reflects this, as we can see that the price is going to strongly increase after already crushing through the resistance at $245.91. From here, there is only one way: up!
Anything you would like us to analyze?
MSFT seems to be going down soonMSFT shows to be overbought, floating, I’m expecting a drop and then pull backs at the 78.60 Fibonacci levels.

$MSFT $9 Run Today! Whats Next?Great play today on $MSFT here is a video breakdown on our levels going foward. Hopefully the future acquisition will move this higher!

Microsoft Long📈 NASDAQ:MSFT LONG H4
🛒Buy above = 245.52
🎯Target1 = 255.23
🎯Target2 = 261.2
🎯Target2 = 270.95
🛑Stop loss or cancel trade = 229.79

MSFT thoughtsIn a clear uptrend since inception
I wonder how these vital tech stocks will perform in comparison to cryptocurrencies this year
You need computers for cryptocurrency right? MSFT seems like a prime target
I would be long these tech stocks if I could find an easy and appealing investment tool for ones like this one


Short on open: 209.40
Real-Time Algorithmic Trading Signals. All trades are based on a Geometric HMM.
The Ingenuity Trading Model is a Geometric Hidden Markov Model with specific inputs related to Price, Time, Volume , and Volatility .
Our Algorithmic Trading Model offers real-time buy or sell signals with specific entry and exit prices. This affords you the freedom to successfully trade across all markets and market regimes. We are not interested in biased economic research or opinions on the latest Wall Street narratives. We do not trade based on conventional financial analysis. Our signals prove the power of taking a more scientific approach to trading the market.

THE MSFT STOCKmore probability the stock going up the next day we can see the price at 217.00 and more

MSFT LONG SET UP (MICROSOFT CORP.)TITLE/(DATE)- BUY MSFT/USD
ASSET- STOCK
PLATFORM-MT4
ORDER TYPE- BUY Market
Time Frame-4hr
ENTRY PRICE 1- $206.50✅ market
ENTRY 2- $202.50 pending
STOP LOSS- $199.50 (70 PIPs)
TAKE PROFIT 1-$213.50 (70PIPS)
TAKE PROFIT 2- $220.50(140 PIPS)
TAKE PROFIT 3- $227.50 (210 PIPS)
TAKE PROFIT 4- $234.50 (280 PIPS)
TAKE PROFIT 5- $241.50 (350 PIPS)
STATUS:🏃🏽♂️RUNNING 🏃🏽♂️

MICROSOFT CORP. LONG📈 NASDAQ:MSFT LONG H4
🛒BUY above = 211.40
🎯Target1 = 216.40
🎯Target2 = 224.16
🛑Stop loss or cancel trade = 203
🙈Risk = (1%-2%)
#MSFT #MSFTLONG #BUYMSFT

MSFT Potential Talks of Buying TikTok wave (5) Play The 3 hours MSFT chart is showing we are setting up for one more push higher into wave (5) Green before a completed 5-wave impulse is complete. Looking to place a momentum trade on MSFT and potential takeover of TikTok for MSFT to expand into the social media business. Actionable Trade Execution in Video Report.

Microsoft Hitting Major Channel Resistance. (MSFT)We all know if you go back in time till now on Microsoft it has an insane parabolic curve.
I currently have a channel drawn out between the two lines.
Arrows and red line is Resistance.
Green line is support.
We are seeing the overall trend from the last impulse hit the top level of Resistance in the channel, where we have seen previous good size selloffs occur at.
The ema dots are all red and the custom rsi has already dropped off.
I'm in favor of a short up here at this top level of range.
I think it would be healthy to see a pullback here.

Buy Zone and Target for Microsoft $MSFTWhat i think $MSFT will do in upcoming days.
(Not financial advice)

ANALYZE: MSFTafter all i notice on the chart my probability the trend going down to test the support line

ANALYZE: MSFTafter breakthrough the strong support line high probability the trend go down to test the support line


🤔 Hidden Bearish Pattern For Microsoft? (MSFT)🐻 Similar to amazon stock I notice a rising wedge from the main structures. This could lead to a fakeout trap as we approach the upside of previous high and selloff.
Patterns do not always mean what they are said to mean in the textbook but we can use them to help us look for our next play. The top of the wedge lines up with previous high. Be cautious. Play short if the bottom support of wedge breaks.
You never know we could get caught off guard and the bulls could run it up. Anything is possible. Just manage the risk if it were to flip.
Happy trading! ✌😁✌
🥇MLT | MAJOR LEAGUE TRADER


