PUMP | #4h #long — Watching for Breakout Confirmation Early signals for a reversal, but not rushing in.
Some clear bullish divergence on the 4h RSI — first positive sign after an extended downtrend. Price can pop from here, but my plan is to wait for a break and hold above the 4h Order Block + MSS zone (red box) before taking any long entry.
Confirmation is key — I only want to get involved if we reclaim this area with momentum.
Scenario:
If we get a strong breakout and close above the red OB + MSS zone, that’s the first entry trigger for a potential trend reversal.
Until then — standing aside, letting the setup prove itself.
Reasoning:
Bullish RSI divergence often marks the beginning of a reversal, but without a structural breakout, the move can easily fail.
Patience pays off in these high-risk, low-liquidity coins.
Mss

BTC Reloading for Breakout — Watching for 1H MSS Flip
BTC has bounced from local support (green zone) and is challenging the descending trendline.
The price is now testing the red resistance zone and the upper boundary of the 1H MSS (market structure shift) box.
Scenario A (Bullish):
— If BTC cleanly breaks the trendline and flips the 1H MSS box into support (with a strong close above), this is a trigger for a scalp long.
— Target for the move is the upper green box/previous high area near $122,000.
Scenario B (Bearish/Invalidation):
— If price is rejected at the red resistance and falls back below the green support box, risk of deeper pullback toward $116,000 increases.
BTC has shown resilience by quickly reclaiming support after a sweep lower, indicating strong demand. The market looks to be reloading for another push, with liquidity building up just below resistance. The setup favors a breakout if NY Open brings momentum. The flip of the 1H MSS box would confirm bullish intent. However, caution if the breakout fails — structure remains choppy and a failed breakout can trap late buyers.

JTO — 1D Trend Breakout & MSS Hold1. Buy zone: 1.86–1.95 (hold above 1D S/R + MSS)
2. Entry: after trend breakout + MSS confirmation
3. Target: FVGs above, full tp 2.78
4. Stop: below 1.76

Bitcoin - V-shape recovery down towards the 4h FVG at $111.000?The move began with a strong rally that peaked near the $123,000 level. After hitting that high, Bitcoin quickly reversed and sold off aggressively, forming a classic V-shaped pattern. This type of formation typically indicates a strong shift in momentum, where bullish control is quickly overtaken by sellers, leading to swift downward movement.
4H bearish FVG
Shortly after the initial drop, Bitcoin made a retest of the bearish 4H FVG (Fair Value Gap) around the $119,000 to $120,500 zone. This fair value gap was created during the sharp move down and represented an area of inefficiency in price. The chart shows that price moved back into this zone and was “perfectly retested,” getting rejected almost immediately. This rejection confirmed that sellers are respecting this imbalance, turning it into a short-term resistance level.
Market structure
As the price failed to reclaim the fair value gap and continued lower, it broke the market structure at around $117,000. This break suggests that the previous higher low was taken out, signaling a bearish shift in the intermediate trend. The market structure break often acts as confirmation that buyers are losing control and lower prices are likely.
CME gap
Adding to the downside pressure is the CME gap, labeled as the "BTC CME GAP" on the chart. This gap spans from roughly $114,000 to $116,300 and was formed over the weekend when the CME (Chicago Mercantile Exchange) was closed. Historically, Bitcoin has shown a tendency to "fill" these gaps by revisiting the price levels within them. The current price action has already started to dip into this region, which could suggest further downside to complete the gap fill.
Bullish 4H FVG with support
Finally, the chart hints at the potential drop to the lowest 4H FVG and previous resistance, located just above $111,000. This fair value gap aligns closely with a prior resistance level from earlier in the month, making it a logical magnet for price if selling pressure persists. It represents a confluence zone where buyers may look to step in again, especially if the CME gap is filled and the market is searching for support.
Conclusion
In summary, Bitcoin is showing bearish technical signs following a V-shape top and a strong rejection from the 4H FVG at $120,000. The break of market structure and ongoing fill of the CME gap suggest that further downside toward the $111,000 level is a strong possibility. Traders should watch closely for price reaction in that lower fair value gap zone, as it could serve as a critical area for a potential bounce.
Disclosure: I am part of Trade Nation's Influencer program and receive a monthly fee for using their TradingView charts in my analysis.
Thanks for your support. If you enjoyed this analysis, make sure to follow me so you don't miss the next one. And if you found it helpful, feel free to drop a like and leave a comment, I’d love to hear your thoughts!

VIRTUAL — Clean MSS+BOS Flip Long | #1D | BULLISH1. Limit order on retest S/R flip (1.65–1.68)
2. Entry after confirmed hold above support
3. Main target: 2.18
4. Stop: Below 1.49

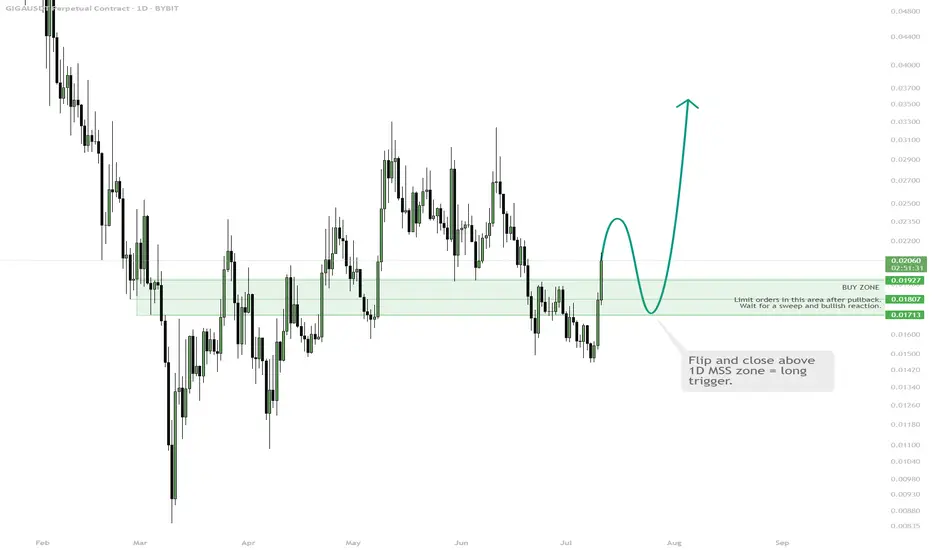
GIGA | Watch for 1D MSS Flip & Long TriggerBUY ZONE $0.0175–0.0192 — wait for pullback, enter on bullish signal.
TRIGGER: Flip and hold above 1D MSS zone.
STOP: Close below $0.0171 = exit.
TP: $0.025 / $0.03 — take profit on move up.
Wait for the break and flip above 1D MSS, then enter long on confirmation. Avoid early entry — only buy after a clear signal. Fix part of profit at resistance.
Market Structure Shift Meaning and Use in ICT TradingMarket Structure Shift Meaning and Use in ICT Trading
In ICT (Inner Circle Trader) trading, understanding Market Structure Shifts (MSS) is crucial for accurately interpreting market trends and making informed trading decisions. This article delves into the significance of MSS, its distinct indicators, and how it integrates with other trading elements like Breaks of Structure and Changes of Character.
Understanding Breaks of Structure and Change of Character
Comprehending the dynamics of Breaks of Structure (BOS) and Change of Character (CHoCH) can be crucial for analysing market trends. A Break of Structure occurs when price levels move beyond established support or resistance areas, indicating a potential continuation or acceleration of the current trend. For example, in an uptrend, a BOS is identified when prices break above a previous resistance level, suggesting further upward movement.
Conversely, a Change of Character signifies a possible shift in the market's direction. This occurs when the price action breaks against the prevailing trend, challenging the recent high or low points that served as market barriers. A CHoCH often raises a red flag about the sustainability of the current trend. For instance, in a sustained uptrend, a CHoCH would be marked by a significant downward breach that violates a previous low point, hinting at a weakening of bullish momentum.
Both BOS and CHoCH are pivotal in the ICT (Inner Circle Trader) methodology, where they are used to gauge market sentiment and potential shifts in trend dynamics. Traders monitor these patterns to adjust their strategies, whether to capitalise on the continuation signalled by a BOS or prepare for a trend reversal suggested by a CHoCH.
What Is a Market Structure Shift?
MSS, meaning a Market Structure Shift, is an indicator of a significant change in the prevailing trend, marked by a series of patterns that suggest a reversal is imminent. An ICT MSS is more than a simple Change of Character (CHoCH); it includes additional signals that strengthen the case for a directional change.
The process begins with a shift in market structure that fails to sustain the ongoing trend. For example, during an uptrend, the market might fail to make a new higher high, instead forming a lower high. This initial deviation raises a caution flag about the trend’s strength.
The confirmation of an MSS in trading occurs when there is a decisive break of a significant swing point, accompanied by a strong impulse move that deeply penetrates through this point, known as a displacement. This displacement is critical—it’s not merely a slight breach but a robust move that clearly indicates a shift.
In essence, an MSS signals that the current market momentum has not only paused but is likely reversing. For traders, this is a pivotal moment: the lower highs in an uptrend or the higher lows in a downtrend prior to the break suggest that a new opposite trend is starting to take shape.
How to Use a Market Structure Shift in Trading
An MSS ultimately serves as a directional tool. It helps traders understand when a potential trend reversal is underway, enabling them to align their strategies with the new market direction.
To effectively use an MSS in trading, traders often follow these steps:
- Observing Current Market Structure: They start by analysing the existing trend direction and key price levels. Understand whether the market is in an uptrend, downtrend, or sideways movement by identifying patterns of higher highs and higher lows or lower highs and lower lows.
- Watching for a Break in Key Levels: The core of an MSS is the break of an important high or low, combined with a sharp price movement that breaches a significant swing point (displacement).
- Confirming with News Releases: MSS often coincides with major economic announcements or news releases that can affect market sentiment significantly. For example, if there's a report indicating unexpectedly high US inflation rates, and this correlates with a sharp downward movement in EURUSD, it provides additional confirmation of the MSS. A stronger dollar against the euro, in this case, would signal a clear shift in market direction towards favouring the dollar.
By recognising these elements, traders can more confidently anticipate and adapt to changes in market direction. A well-identified MSS not only indicates a pause in the current trend but also the establishment of a new trend.
Using Market Structure Shifts With Other ICT Components
Using Market Structure Shifts with other Inner Circle Trader methodology components like break of structure, order blocks, and fair value gaps may enhance a trader's ability to interpret and react to market dynamics.
Integrating MSS with ICT Market Structure
An MSS identifies a potential reversal in the market’s direction. When an MSS occurs, it often leads to the formation of a new high-low range in the direction of the new trend. For example, if a bearish MSS results in a new lower high and lower low, traders can watch for a BOS of this range. A retracement back inside of the new range can signal a decent area to search for an entry to ride the trend that’s just beginning.
Utilising Order Blocks and Fair Value Gaps
However, there are scenarios where the price doesn’t establish a new high-low range but instead returns to the area where the original displacement occurred. This displacement often leaves behind a fair value gap and an order block.
- Fair Value Gap: This is a price range that the market skips over quickly during a displacement, leaving it untested by typical market trading. It often acts like a vacuum, drawing the price back to fill in the gap at a later stage.
- Order Block: An order block is typically a consolidation area that precedes a strong price move and is considered a footprint left by institutional traders. It represents levels where significant buying or selling occurred, potentially acting as support or resistance in future price movements.
If the price returns to fill a fair value gap and enters the order block, this scenario can provide a potent setup for a reversal. Traders might look for confirmatory signals at these levels to enter trades that anticipate the market returning to its previous course or extending the reversal initiated by the MSS.
The Bottom Line
The insights provided on MSS and its application within the ICT trading framework can be instrumental for any trader seeking to navigate the complexities of the market effectively. To put these strategies into practice and potentially improve your trading outcomes, practice a lot and learn more about ICT trading.
FAQs
What Is a Market Structure Shift?
A Market Structure Shift (MSS) indicates a potential reversal in market trends, marked initially by a lower high in an uptrend or a higher low in a downtrend, followed by a displacement—a significant and rapid price movement that decisively breaks through a key market level.
How to Identify Market Structure Shift?
Identifying an MSS involves observing for early signs of trend weakening (lower highs or higher lows) and waiting for a subsequent displacement that confirms the shift. This displacement should significantly penetrate a key swing point, clearly indicating a new direction in market momentum.
What Is the ICT Method of Trading?
The ICT (Inner Circle Trader) method of trading is a comprehensive approach that utilises various trading concepts such as market structure, order blocks, and fair value gaps, focusing on how institutional traders influence the market. It emphasises understanding and leveraging these components to align trading strategies with probable market movements.
What Is the Difference Between MSS and BOS in ICT?
In ICT, a Market Structure Shift (MSS) refers to a potential trend reversal, confirmed by a lower high/higher low followed by a displacement. A Break of Structure (BOS), however, simply indicates the continuation or acceleration of the current trend without necessarily suggesting a reversal, marked by the breach of a key high or low point within the ongoing trend direction.
This article represents the opinion of the Companies operating under the FXOpen brand only. It is not to be construed as an offer, solicitation, or recommendation with respect to products and services provided by the Companies operating under the FXOpen brand, nor is it to be considered financial advice.

AUDUSD (MSS + DEMAND + OTE)Hello traders!
My setup: MSS + DEMAND + 705 FIB
Target: till first problematic zone(BOS 1H)
Entry: Through confirmation on LTF
Have a profitable day and don't forget to subscribe for updates!

GBPCHF (MSS + DEMAND + OTE + 0.5 FIB)Hello Traders!
We have 2 strong zone for buying:
1) Unmitigated Demand + MSS + OTE
2) OB with Inducement.
Both scenario are valid in my opinion.
Have a profitable day and don't forget to subscribe for updates!

AR Trade Setup – Watching for Market Structure ShiftAR is showing early signs of strength after defending the $5 key level a crucial support that bulls needed to hold. Now, the focus is on a potential shift in market structure around $6, which could lead to a strong upside move.
📍 Entry Zone:
Enter around $6 after confirmation (e.g., reclaim with strong volume or bullish candle close)
🎯 Take Profit Targets:
🥇 $12
🥈 $16
🥉 $22
🛑 Stop Loss:
Below $5

NCKL ProjectionNCKL (IDX Composite)
Projection of the NCKL with 2 turning point
1. 740 (Market Structure Shift) from Bearish to Bullish
2. 855 (Market Structure Shift) from Bearish to Bullish

Bullish on BTC. Price Action suggesting upside. No explanation needed.
Simple ICT concepts in play.
Follow for more.
This idea is mine and it is not a financial advice.
It is a mere speculation educational post from me.
DYOR.

Is Apple's $1.5B Satellite Deal the Future?In the rapidly evolving world of satellite communications, a transformative partnership has emerged between tech giant Apple and satellite operator Globalstar. This landmark $1.5 billion agreement has the potential to reshape the way we connect in remote and underserved regions, inspiring questions about the future of global connectivity.
At the heart of this deal lies Globalstar's commitment to develop and operate a state-of-the-art mobile satellite services (MSS) network. Backed by Apple's substantial infrastructure prepayment of up to $1.1 billion and a $400 million equity investment, Globalstar is poised to enhance the reliability and coverage of emergency satellite communications for iPhone users worldwide. This strategic alliance not only demonstrates Apple's long-term vision for satellite-based connectivity but also positions Globalstar as a dominant player in an industry that is expected to witness a surge in activity in the coming decade.
As the satellite communications sector braces for the launch of an estimated 50,000 satellites into low-Earth orbit, this Globalstar-Apple partnership stands out as a game-changer. By dedicating up to 85% of its network capacity to Apple, Globalstar is solidifying its role as a critical infrastructure provider, catering to the growing demand for seamless connectivity in remote and underserved regions. This move, coupled with Globalstar's plans to expand its satellite constellation and ground infrastructure, suggests a future where satellite-based services become increasingly integrated into our everyday lives.
The financial implications of this deal are equally compelling. Globalstar projects that its annual revenue will more than double in the year following the launch of the expanded satellite services, marking a significant improvement from its recent financial performance. Furthermore, the company's ability to retire its outstanding senior notes and secure favorable adjustments to its funding agreement highlights the transformative nature of this partnership, positioning Globalstar for long-term growth and stability in the evolving satellite communications landscape.

GBPJPY 185.745 0.32% LONG IDEA MULTI-TIMEFRAME ANALYSISHELLO TRADERS
Hope everyone is doing great
📌 A look at STERLING from HTF - MULTI TIME-FRAME ANALYSIS
GBPJPY DAILY TF
* With las weeks bearish momentum coming into play,looking for a bit of a push up as we close the week on GJ.
* The weekly & daily TF show we are still showing signs of a BEARISH move, but looking for some retracement before continuation bearish.
* GJ took External range LQ, looking for that internal range LQ to be taken.
* We are trading in discount of the move,This is where I would be looking for long entries.
* With PO3 looking to open bearish this week to confirm a move higher into premium PD ARRAYS.
GBPJPY 4H TF
snapshot
* HTF BIAS (PO3) Is bullish .
* looking for long positions OPPORTUNITIES.
snapshot
* We saw a rally with the bears, strong momentum to the downside.
* Looking at the 1H MMS, this is where I would look for LONG entries this week.
* Should this PD ARRAY hold will be long for the GJ.
* BASED on the price action served this week.
HOPE YOU ENJOYED THIS OUT LOOK, SHARE YOUR PLAN BELOW,🚀 & LETS TAKE SOME WINS THIS WEEK.
SEE YOU ON THE CHARTS.
IF THIS IDEA ASSISTS IN ANY WAY OR IF YOU ENJOYED THIS ONE
SMASH THAT 🚀 & LEAVE A COMMENT.
ALWAYS APPRECIATED
____________________________________________________________________________________________________________________
*
Kindly follow your entry rules on entries & stops. |* Some of The idea's may be predictive yet are not financial advice or signals. | *Trading plans can change at anytime reactive to the market. | * Many stars must align with the plan before executing the trade, kindly follow your rules & RISK MANAGEMENT.
_____________________________________________________________________________________________________________________
| * ENTRY & SL -KINDLY FOLLOW YOUR RULES | * RISK-MANAGEMENT | *PERIOD - I TAKE MY TRADES ON A INTRA DAY SESSIONS BASIS THIS IS NOT FINACIAL ADVICE TO EXCECUTE ❤
LOVELY TRADING WEEK TO YOU!

Just an ideaJust an idea. Will wait for a market structure shift and a fill of that displacement towards the upside of the market.

SOLUSDT | Long H4 | Buy Limit | Technical Confluences for Trade:
- Stochastics are in Overbought Conditions on D1, H4 & H1 time-frame to activate our trade idea
- Entry level will be a Demand Zone for Solana
- Price action is in a consolidation zone
- Targeting the 61.8% Fibo retracement after trade is activated
Suggested Trade:
Buy Limit @ 123.15
SL @ 110.24
TP 1 @ 143.74 (Close Half-Position & move SL to Entry level once TP1 is achieved)
TP 2 @ 169.42
Risk-to-Reward @ Approx. 3.26 (Depending on Entry Level)
________________________________
Boosts 🚀, Follows ✌️, Shares 🙌 & Comments ✍️ are much appreciated!
If you have any ideas or charts, do share them in the 'Comments' section below and we can discuss our perspectives to improve or strengthen our strategies.
If you want something analyzed, do drop me a DM. :D
________________________________
Disclaimer: The above suggestion is an personal opinion in general and does not constitute as investment advice. Any decisions taken based on the above suggestion is purely your own risks.
Any websites / brokers / applications suggested here are also provided as informational purpose only.
________________________________

NASDAQ - 4HR With Monday's price action giving us a retracement into a discount. We can look for shorts 15500-15600 area. Wait for candle confirmation. We can see price push into the 4hr OB 15800-900 level.

BTC Dominance broke structure - 56% nextBTC Dominance retraced to the discount on this daily leg and broke structure to the upside before taking the sell-side-liquidity.
BTC Dominance need to retrace to the premium zone to fill the inefficiency on the weekly / monthly timeframe.
Once we see a lower timeframe confirmation around the 56% level, we can prepare for the altseason. Until then... Brace yourselves.

BTC FVG IDEAi like to participating when the btc make some retracement, since the HTF fvg (4h) has been fully mitigated but unfortunately the 4h candle close can hold above the fvg.
im ready to place sell order when mss is confirmed on 5m tf and execute my order when the price retest the high and failed.
dyor and keep safe

EURUSD Smart Money ConceptsThe EURUSD pair has been bearish this week. The first bubble at the top shows where the price tried to form a bullish MSS (market structure shift) or ChOCh (change of character), this happens after consecutive green higher highs, but the next higher high candle closed red, thus that was a failed MSS/ChOCh. Yesterday's price closed green on the day, this might form a bullish MSS/ChOCh if we can see more green higher highs, and closes. There was a sellside liquidity sweep where sellside liquidity was taken, this may be forming into a bullish MSS, but if the day closes red then it would be another failed MSS. Perhaps the EURUSD will try again later.

ESM - 15m 2022 Mentorship ModelPossible 2022 ICT Mentorship Model.
Created MSS and pullback to the 15m Inversion FVG. Reached 1st Target.
Also, touched 4h OB. Watching test of the mean threshold of this OB.

2022 ICT Mentorship ModelNice retest of the 4h Inversion FVG after MSS. Filled FVG and started selling off!

SPY Trading 2/8/23Not as huge wins as previous days but still green. Waiting for just the BOS or MSS as some may refer to it, is risky. I would recommend waiting for a FVG pullback after a MSS to confirm. But, as you can see with just the BOS or MSS you win and you lose.
